. 2019 Feb 27;6(3):554-574.
doi: 10.1002/acn3.730. eCollection 2019 Mar.

Anti-PrPC antibody rescues cognition and synapses in transgenic alzheimer mice

Affiliations

Anti-PrPC antibody rescues cognition and synapses in transgenic alzheimer mice

Timothy O Cox et al. Ann Clin Transl Neurol. .

Abstract

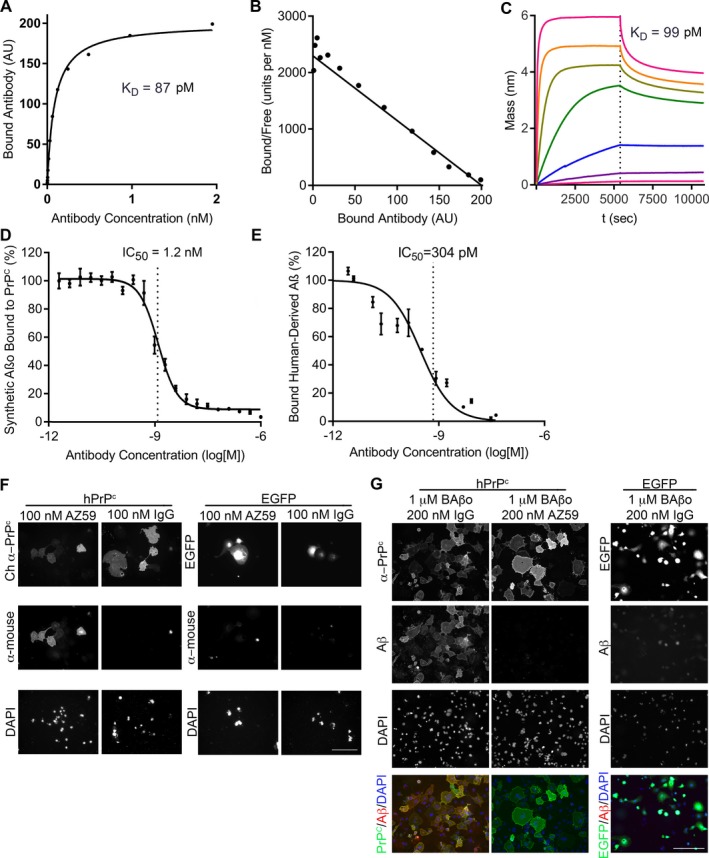
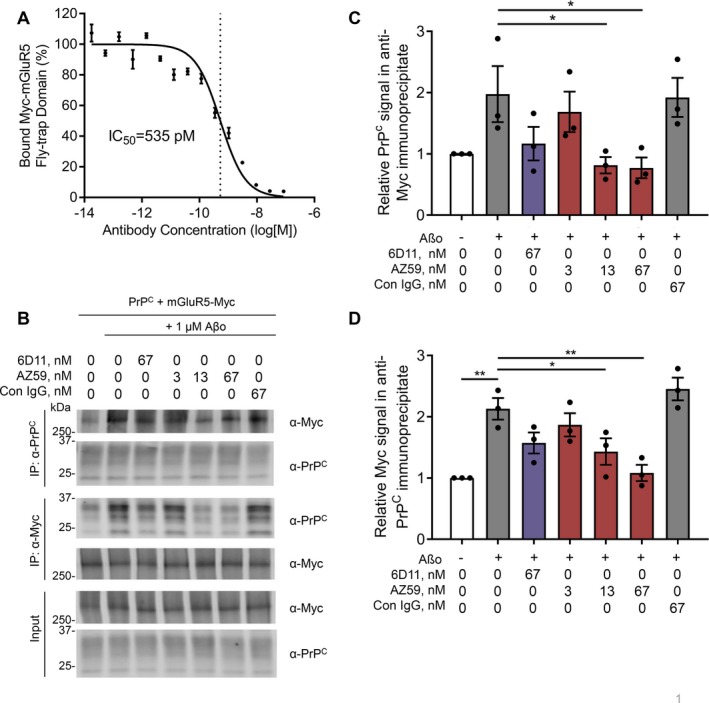
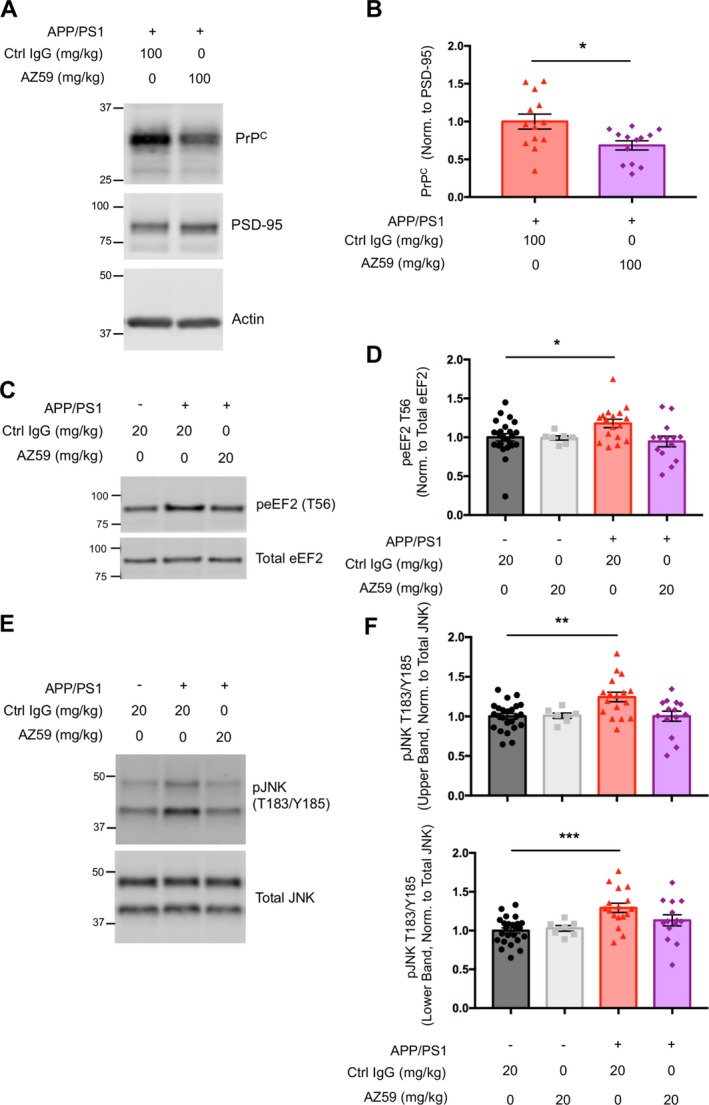
Objective: Amyloid-beta oligomers (Aßo) trigger the development of Alzheimer's disease (AD) pathophysiology. Cellular prion protein (PrPC) initiates synaptic damage as a high affinity receptor for Aßo. Here, we evaluated the preclinical therapeutic efficacy of a fully human monoclonal antibody against PrPC. This AZ59 antibody selectively targets the Aβo binding site in the amino-terminal unstructured domain of PrPC to avoid any potential risk of direct toxicity.

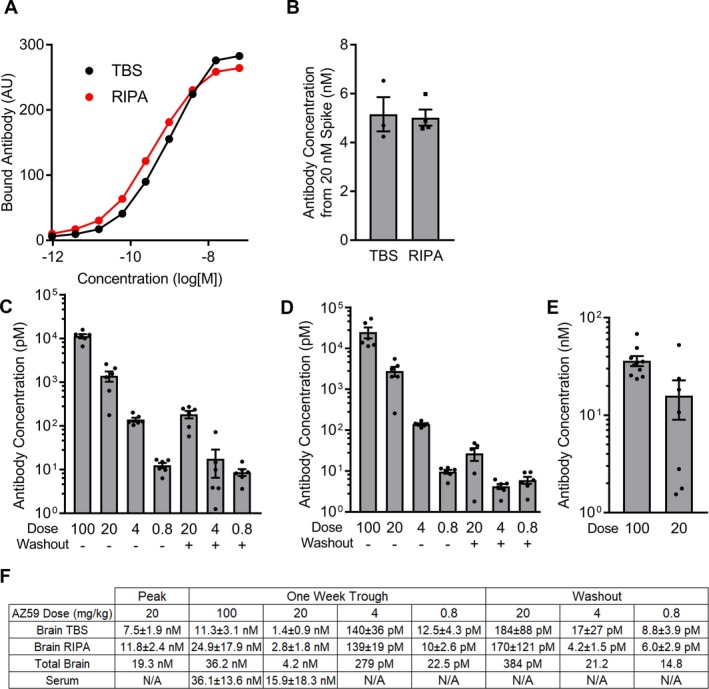
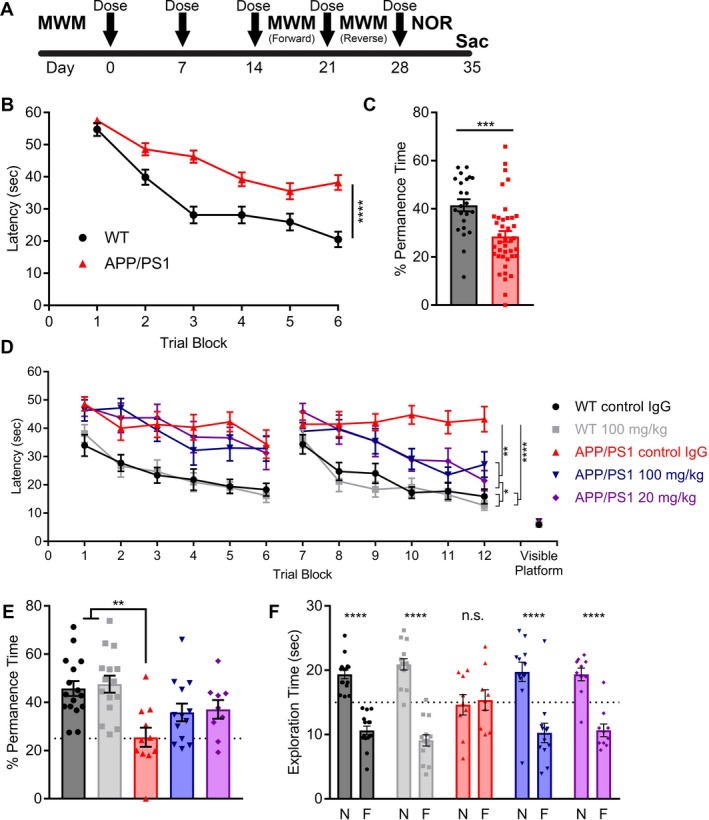
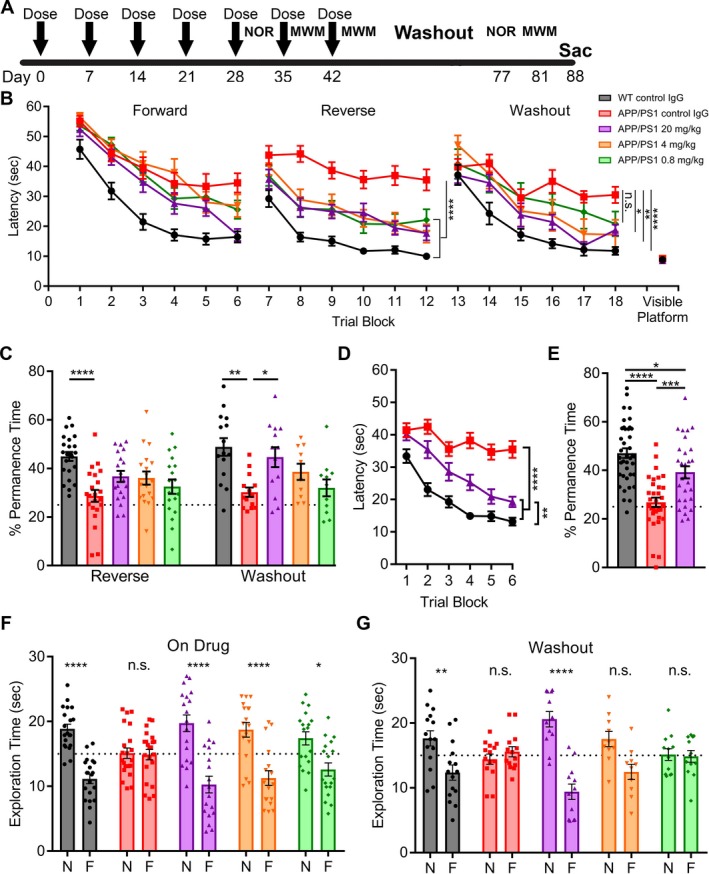
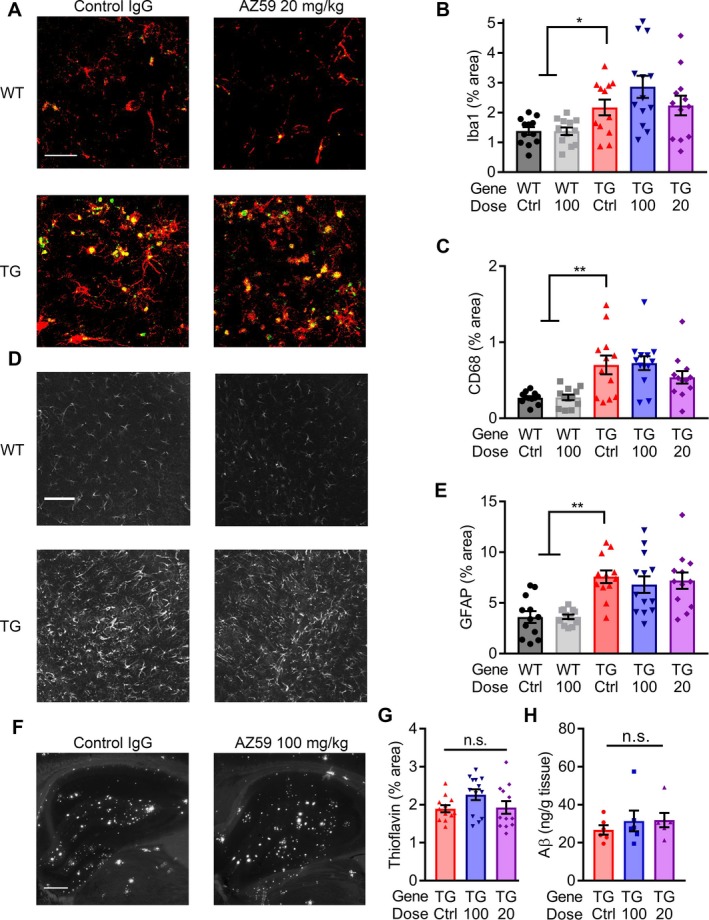
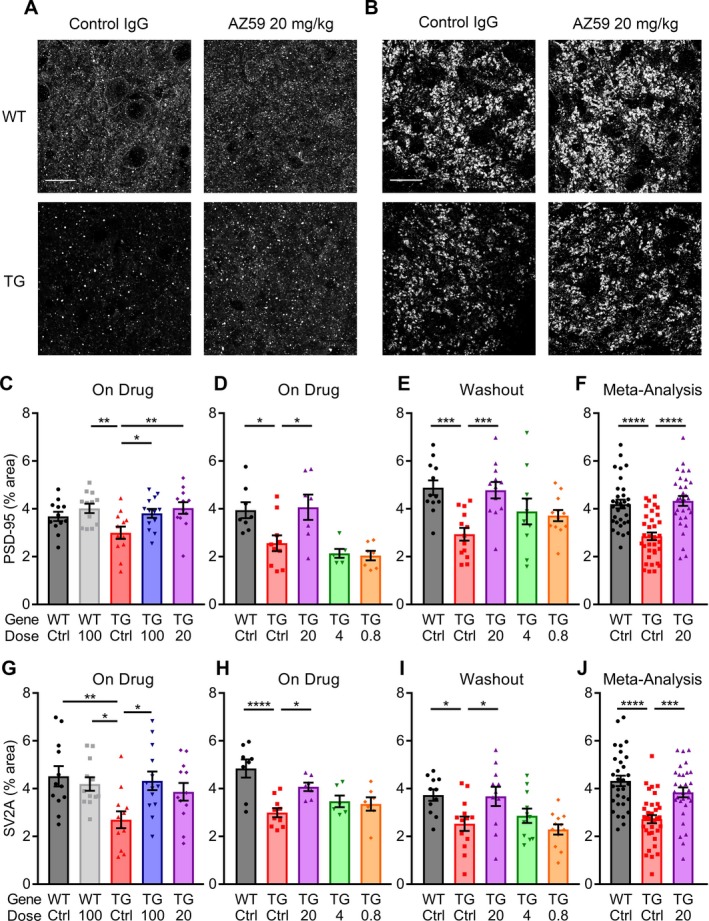
Methods: Potency of AZ59 was evaluated by binding to PrPC, blockade of Aβo interaction and interruption of Aβo signaling. AZ59 was administered to mice by weekly intraperitoneal dosing and brain antibody measured. APP/PS1 transgenic mice were treated with AZ59 and assessed by memory tests, by brain biochemistry and by histochemistry for Aß, gliosis and synaptic density.

Results: AZ59 binds PrPC with 100 pmol/L affinity and blocks human brain Aßo binding to PrPC, as well as prevents synaptotoxic signaling. Weekly i.p. dosing of 20 mg/kg AZ59 in a murine form achieves trough brain antibody levels greater than 10 nmol/L. Aged symptomatic APP/PS1 transgenic mice treated with AZ59 for 5-7 weeks show a full rescue of behavioral and synaptic loss phenotypes. This recovery occurs without clearance of plaque pathology or elimination of gliosis. AZ59 treatment also normalizes synaptic signaling abnormalities in transgenic brain. These benefits are dose-dependent and persist for at least 1 month after the last dose.

Interpretation: Preclinical data demonstrate that systemic AZ59 therapy rescues central synapses and memory function from transgenic Alzheimer's disease pathology, supporting a disease-modifying therapeutic potential.


Conflict of interest statement

J.H., G.R., B.D., M.G., M.G., C.D., T.V., I.C., and A.B. are full time employees of AstraZeneca MedImmune and have filed a patent application describing AZ59 antibody. S.M.S. is Inventor for an issued patent claiming use of PrPC inhibition for Alzheimer's disease.

Figures

Figure 1
Figure 1
AZ59 binds to PrPC with high affinity and specificity and inhibits Aβo binding in vitro. (A) The binding of AZ59 to a 384‐well plate coated with PrPC(23‐230). Data are mean ± SEM, n = 3 replicates per sample. (B) Scatchard analysis of the data in (A). (C) Biolayer interferometric association (0–5400 sec) and dissociation (5401–10,800 sec) traces of AZ59 at concentrations of 0.024 nmol/L, 0.98 nmol/L, 0.39 nmol/L, 1.56 nmol/L, 6.25 nmol/L, 25 nmol/L, 100 nmol/L with PrPC(23‐230)‐coated sensor, indicating a dissociation constant of 99 pmol/L. (D) Prion‐Linked ImmunoSorbent Assay (PLISA) measurement of AZ59 inhibition of Aβo/PrPC(23‐230) interaction, indicating an IC50 of 1.2 nmol/L. Data are mean ± SEM, n = 3 replicates per sample. (E) PLISA measurement of AZ59 inhibition of human brain‐derived Aβo binding to PrPC, indicating an IC50 of 0.3 nmol/L. Data are mean ± SEM, n = 3 replicates per sample. (F) AZ59 binds to Cos‐7 cells expressing hPrPc but not EGFP. No binding of mouse IgG control was detected in either scenario. Scale bars = 200 μm. (G) AZ59 (100 nmol/L) completely blocks binding of biotin‐Aßo (1 μmol/L monomer equivalent) to Cos‐7 cells expressing myc‐tagged hPrPc. Scale bars = 200 μm.
Figure 2
Figure 2
AZ59 disrupts the Aβo‐induced interaction of PrPC and mGluR5. (A) The binding of Myc‐tagged fly‐trap domain of mGluR5 to a 384‐well plate coated with PrPC(23‐230). Data are mean ± SEM, n = 3 replicates per sample. (B) Co‐immunoprecipitation of HEK cell lysates expressing PrPC and Myc‐mGluR5 pretreated with either vehicle, 6D11, AZ59, or control IgG before Aβo treatment. Membrane proteins were extracted with RIPA buffer and immunoprecipated with either α‐PrPC or α‐Myc. (C) Quantification of PrPC signal in (B) of α‐Myc immunoprecipitate. Data are mean ± SEM, n = 3 replicates per sample. (D) Quantification of Myc signal in (B) of α‐PrPC immunoprecipitate. Data are mean ± SEM, n = 3 replicates per sample.
Figure 3
Figure 3
AZ59 penetrates the blood‐brain barrier at nanomolar concentrations. (A) Standard curves used to determine concentration of samples. 384‐well plates were coated with PrPC(23‐230) to capture AZ59 recovered from TBS and RIPA lysates from the cortex of treated mice. (B) AZ59 was added to total brain homogenate at a final concentration of 20 nmol/L and incubated overnight at 4C. TBS and RIPA fractions were collected and compared to a standard curve to determine the final concentration in each fraction. (C–D) AZ59 recovered from TBS (C) and RIPA (D) lysate from cortex of mice treated with the indicated mg/kg doses of AZ59 for either 5 or 6 weeks, and sacrificed 7 days after the last dose. Data are mean ± SEM, n = 5–6 per group, all samples were run in triplicate. (E) AZ59 recovered from serum of treated mice. Data are mean ± SEM, n = 7–10 per group, all samples were run in triplicate. (F) Table summarizing results in (C–E). Total brain concentration is the sum of TBS and RIPA fraction concentrations. Data are mean ± standard deviation. N/A, not assayed.
Figure 4
Figure 4
AZ59 reverses established learning and memory deficits in APP/PS1 mice. (A) Timeline of treatment and testing. Mice began treatment at 12–13 months, received five weekly doses via i.p. injection (arrows), and began behavior after 3 weeks of treatment. Tissue was collected 6 weeks after treatment began. (B) Prior to treatment, 12‐13‐month‐old WT and APP/PS1 completed the MWM to establish their baseline deficit. Data are mean ± SEM, n = 24 for WT and n = 42 for APP/PS1 mice. Performance was analyzed by two‐way analysis of variance with RM‐ANOVA over the last 12 trials (three blocks) and showed a significant effect of genotype (****,P < 0.0001). (C) 24 h after the learning trials, WT and APP/PS1 completed a probe trial. Time spent in the quadrant where the platform once was measured. Data are mean ± SEM, n = 24 for WT and n = 42 for APP/PS1 mice. Performance was analyzed by two‐tailed t test (***P < 0.001). (D) Mice were randomized into five groups receiving either 100 mg/kg of control IgG, 20 mg/kg AZ59, or 100 mg/kg AZ59 once weekly via i.p. injection. After three doses, they repeated the MWM twice with both a forward and reverse swim training set to new quadrants. The control IgG‐treated APP/PS1 group differed significantly from all other groups by one‐way RM‐ANOVA over the last 12 trials of the reverse swim with Tukey's post hoc multiple comparisons test (**P < 0.01; ****P < 0.0001). n = 9–16 per group, data are mean ± SEM. (E) 24 h after the reverse swim the mice completed a probe trial. WT mice spent significantly more time in the target quadrant than control APP/PS1 mice. APP/PS1 mice receiving AZ59 had intermediate performance, not differing significantly from either the WT or the control IgG APP/PS1 groups. n = 9–16 per group, data are mean ± SEM (***,P < 0.001), one‐way ANOVA with Dunnett's comparison to APP/PS1 control IgG. (F) After 3 weeks of treatment, mice completed the NOR test. APP/PS1 mice receiving AZ59 and WT mice preferred to interact with the novel object (****,P < 0.0001), while APP/PS1 mice receiving control IgG did not (P > 0.05). N, novel object; F, familiar object. Analysis by two‐way ANOVA with Sidak's multiple comparisons test. n = 10–16 per group, data are mean ± SEM. The dashed line indicates an equal amount of time spent with either object.
Figure 5
Figure 5
AZ59 reversal of learning and memory deficits in APP/PS1 mice is dose‐dependent and persists after washout. (A) Timeline of treatment and testing. WT and APP/PS1 mice (10–11 months old) were randomized into five groups receiving 20 mg/kg of control Ig, 0.8 mg/kg AZ59, 4 mg/kg AZ59 or 20 mg/kg AZ59 once weekly via i.p. injection. (B) After 5 weeks of treatment, mice completed the MWM twice with a forward and reverse set of 24 swims. The control IgG treated APP/PS1 group differed significantly from all other groups by one‐way RM‐ANOVA over the last twelve trials of the reverse swim with Tukey's post hoc multiple comparisons test (****,P < 0.0001). APP/PS1 mice receiving the two highest doses of AZ59 (4 mg/kg and 20 mg/kg) did not differ significantly from WT mice (P > 0.05), but those receiving the lowest dose (0.8 mg/kg) were slower than WT (*,P < 0.05). n = 18–26 per group. After 7 weeks of treatment, the mice entered a one‐month washout period. They then completed the MWM with the platform moved to a new quadrant. The control IgG treated APP/PS1 group differed significantly from all other groups except the 0.8 mg/kg group (P > 0.05) by one‐way RM‐ANOVA over the last twelve trials of the washout swim with Tukey's post hoc multiple comparisons test (*,P < 0.05; **, P < 0.01; ****, P < 0.0001). APP/PS1 mice receiving the two highest doses of AZ59 (4 mg/kg and 20 mg/kg) did not differ significantly from WT mice (P > 0.05), but those receiving the lowest dose (0.8 mg/kg) were slower than WT (*,P < 0.05). n = 10–15 per group. All data are mean ± SEM. (C) 24 h after the reverse and washout swims the mice completed a probe trial. WT mice spent significantly more time in the target quadrant than control APP/PS1 mice. APP/PS1 mice receiving 20 mg/kg AZ59 showed a trend to perform better than those receiving control IgG, but the difference was not significant (P = 0.069). (****,P < 0.0001), n = 18–26 per group. For the washout probe trial, APP/PS1 mice receiving 20 mg/kg AZ59 and WT mice spent significantly more time in the target quadrant than did control APP/PS1 mice (*,P < 0.05; **, P < 0.01). n = 10–15 per group. All data are mean ± SEM, one‐way ANOVA with Dunnett's comparison to APP/PS1 control IgG. (D) Meta‐analysis of the final block of swims each mouse receiving WT control IgG, APP/PS1 control IgG, or APP/PS1 20 mg/kg AZ59 performed. WT and APP/PS1 mice receiving 20 mg/kg AZ59 performed significantly better by one‐way RM‐ANOVA over the last twelve trials with Tukey's post hoc multiple comparisons test (****, P < 0.0001). WT mice also performed significantly better than APP/PS1 mice receiving 20 mg/kg AZ59 (**,P < 0.01). n = 32–39 per group, all data are mean ± SEM. (E) Meta‐analysis of the final probe trial for each mouse receiving WT control IgG, APP/PS1 control IgG, or APP/PS1 20 mg/kg AZ59 was performed. WT and APP/PS1 mice receiving 20 mg/kg AZ59 spent significantly more time in the target quadrant than APP/PS1 mice receiving control IgG (***,P < 0.001; ****, P < 0.0001). WT mice performed significantly better than APP/PS1 mice receiving 20 mg/kg AZ59 (*,P < 0.05). One‐way ANOVA with Tukey's post hoc multiple comparisons test, n = 32–39 per group, all data are mean ± SEM. (F) After 5 weeks of treatment, mice completed the NOR test. APP/PS1 mice receiving AZ59 and WT mice preferred to interact with the novel object (*,P < 0.05; ****, P < 0.0001), while APP/PS1 mice receiving control IgG did not (P > 0.05). N, novel object; F, familiar object. Analysis by two‐way ANOVA with Sidak's multiple comparisons test. n = 18–26 per group, data are mean ± SEM. The dashed line indicates an equal amount of time spent with either object. (G) After washout, APP/PS1 mice receiving 20 mg/kg AZ59 and WT mice preferred to interact with the novel object (**,P < 0.01; ****, P < 0.0001), while APP/PS1 mice receiving control IgG or 4 or 0.8 mg/kg AZ59 did not (P > 0.05). N, novel object; F, familiar object. Analysis by two‐way ANOVA with Sidak's multiple comparisons test. n = 10–15 per group, data are mean ± SEM. The dashed line indicates an even amount of time spent with either object.
Figure 6
Figure 6
AZ59 does not alter glial activation or Aβ load. (A) Representative images of immunofluorescent staining for Iba1 (red) and CD68 (green) from the hippocampus of 14‐month‐old WT and APP/PS1 after 5 weeks of treatment. Scale bar = 60 μm. (B–C) Quantification of Iba1 (B) and CD68 (C) immunoreacted area. (*,P < 0.05; **, P < 0.01) n = 12–13 mice per group, data are mean ± SEM, one‐way ANOVA with Dunnett's comparison to APP/PS1 control IgG. (D) Representative images of anti‐GFAP immunostaining taken in the hippocampus of 14‐month‐old WT and APP/PS1 after 5 weeks of treatment. Scale bar = 60 μm. (E) Quantification of GFAP immunoreacted area. (**, P < 0.01) n = 12–13 mice per group, data are mean ± SEM, one‐way ANOVA with Dunnett's comparison to APP/PS1 control IgG. (F) Representative images of ThioS staining in the hippocampus of 14‐month‐old WT and APP/PS1 after 5 weeks of treatment. Scale bar = 200 μm. (G) Quantification of ThioS plaque area. No significance between the groups (P > 0.05) n = 12–13 mice per group, data are mean ± SEM, one‐way ANOVA with Dunnett's comparison to APP/PS1 control IgG. (H) Aβo from TBS homogenate of APP/PS1 mouse cortex captured by PrPC(23‐230) on a 384‐well plate. No significance between the groups (P > 0.05) n = 6 mice per group, data are mean ± SEM, one‐way ANOVA with Tukey's multiple comparison's test.
Figure 7
Figure 7
AZ59 reduces PrPC level and reverses aberrant eEF2 and JNK signaling in APP/PS1 mice. (A) Representative immunoblots of synaptosomal PrPC, PSD‐95 and β‐Actin from brains of 14‐16‐month APP/PS1 mice after 1 week of antibody treatment at 100 mg/kg. (B) Quantification of (A). One week (two doses) of treatment at 100 mg/kg significantly reduced levels of synaptic PrP relative to PSD‐95 (*,P < 0.05). Analysis by two‐tailed t‐test. n = 13 mice per group, data are mean ± SEM. (C) Representative western blots of TBS insoluble, Triton X‐100 soluble total, and phospho‐eEF2 (T56) from hippocampi of 14‐month wild type and APP/PS1 mice after 5 weeks of treatment. (D) Quantification of C. There was a significant increase in the level of Triton X‐100 soluble phospho‐eEF2 (T56) normalized to total eEF2 in hippocampi of 14‐month APP/PS1 mice treated with IgG control compared to wild type controls (*,P < 0.05). There was no significant difference in phospho‐eEF2 (T56) between 14‐month wild type controls and AZ59 treated APP/PS1 mice. Analysis by one‐way ANOVA with Dunnett's multiple comparisons test. n = 7–24 mice per group, data are mean ± SEM. (E) Representative western blots of TBS insoluble, Triton X‐100 soluble total, and phospho‐JNK (T183/Y185) from hippocampi of 14‐month wild type and APP/PS1 mice after 5 weeks of antibody treatment. (F) Quantification of (E). There was a significant increase in the level of Triton X‐100 soluble phospho‐JNK (T183/Y185) normalized to total JNK of the larger JNK isoform (upper band) in hippocampi of 14‐month APP/PS1 mice treated with IgG control compared to wild type controls (**,P < 0.01). There was no significant difference in phospho‐JNK (T183/Y185) of this isoform between wild type controls and APP/PS1 mice treated at 20 mg/kg. There was a significant increase in the level of phospho‐JNK (T183/Y185) normalized to total JNK of the smaller JNK isoform (lower band) in aged APP/PS1 mice treated with IgG control compared to wild type controls (***,P < 0.001). There was no significant difference in phospho‐JNK (T183/Y185) of this isoform between wild type controls and APP/PS1 animals treated with AZ59 at 20 mg/kg. Analysis by one‐way ANOVA with Dunnett's multiple comparisons test. n = 7–24 mice per group, data are mean ± SEM.
Figure 8
Figure 8
AZ59 reversal of synaptic deficits in APP/PS1 is dose‐dependent and persists after washout. (A–B) Representative images of PSD‐95 (A) and SV2A (B) taken in the dentate gyrus of 14‐month‐old WT and APP/PS1 mice after 5 weeks of treatment. Scale bar = 20 μm. (C–F) Quantification of PSD‐95 immunoreactive area in the dentate gyrus of treated mice. (C) 14‐month‐old mice after 5 weeks of treatment. (D) 12‐month‐old mice after 7 weeks of treatment. (E) 13‐month‐old mice after 7 weeks of treatment and a one‐month washout. (*, P < 0.05; **, P < 0.01; ***, P < 0.001) n = 6–13 per group. (F) Meta‐analysis of all PSD‐95 data for the WT control IgG, APP/PS1 control IgG, and APP/PS1 20 mg/kg AZ59. (****, P < 0.0001) n = 31–35 mice. All data are mean ± SEM, one‐way ANOVA with Dunnett's comparison to APP/PS1 control IgG. (G–J) Quantification of SV2A immunoreactivity in the dentate gyrus of treated mice. (C) 14‐month‐old mice after 5 weeks of treatment. (D) 12‐month‐old mice after 7 weeks of treatment. (E) 13‐month‐old mice after 7 weeks of treatment and a one‐month washout. (*, P < 0.05; **, P < 0.01; ****, P < 0.0001) n = 6–13 per group. (J) Meta‐analysis of all SV2A data for the WT control IgG, APP/PS1 control IgG, and APP/PS1 20 mg/kg AZ59. (***, P < 0.001; ****, P < 0.0001) n = 31–35 mice. All data are mean ± SEM, one‐way ANOVA with Dunnett's comparison to APP/PS1 control IgG.

References

    1. Citron M, Westaway D, Xia W, et al. Mutant presenilins of Alzheimer's disease increase production of 42‐residue amyloid beta‐protein in both transfected cells and transgenic mice. Nat Med 1997;3:67–72. - PubMed
    1. Cleary JP, Walsh DM, Hofmeister JJ, et al. Natural oligomers of the amyloid‐beta protein specifically disrupt cognitive function. Nat Neurosci 2005;8:79–84. - PubMed
    1. Hardy J, Selkoe DJ. The amyloid hypothesis of Alzheimer's disease: progress and problems on the road to therapeutics. Science 2002;297:353–356. - PubMed
    1. Kostylev MA, Kaufman AC, Nygaard HB, et al. Prion‐protein‐interacting Amyloid‐beta oligomers of high molecular weight are tightly correlated with memory impairment in multiple Alzheimer mouse models. J Biol Chem 2015;290(28):17415–17438. - PMC - PubMed
    1. Giacobini E, Gold G. Alzheimer disease therapy–moving from amyloid‐beta to tau. Nat Rev Neurol 2013;9:677–686. - PubMed

Publication types

MeSH terms