

Opportunistic Osteoporosis Screening at Routine Abdominal and Thoracic CT: Normative L1 Trabecular Attenuation Values in More than 20 000 Adults
- PMID: 30912719
- PMCID: PMC6492986
- DOI: 10.1148/radiol.2019181648
Opportunistic Osteoporosis Screening at Routine Abdominal and Thoracic CT: Normative L1 Trabecular Attenuation Values in More than 20 000 Adults
Abstract
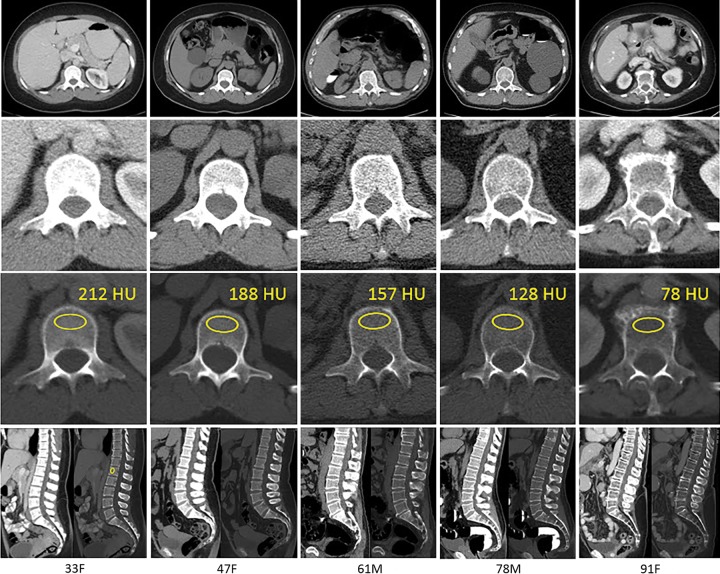
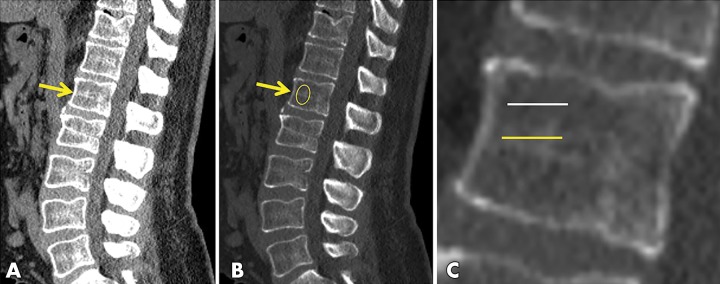
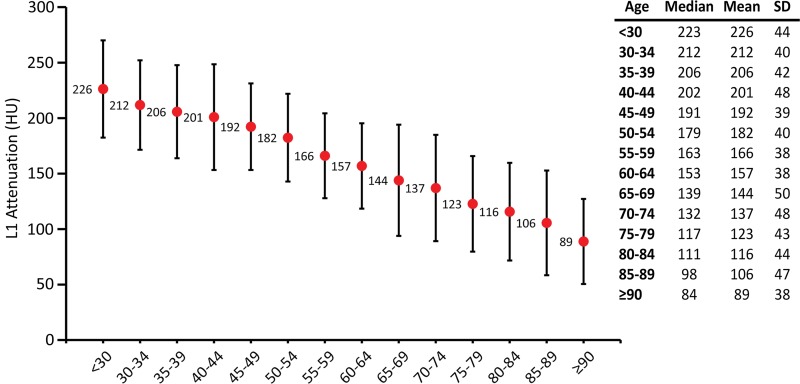
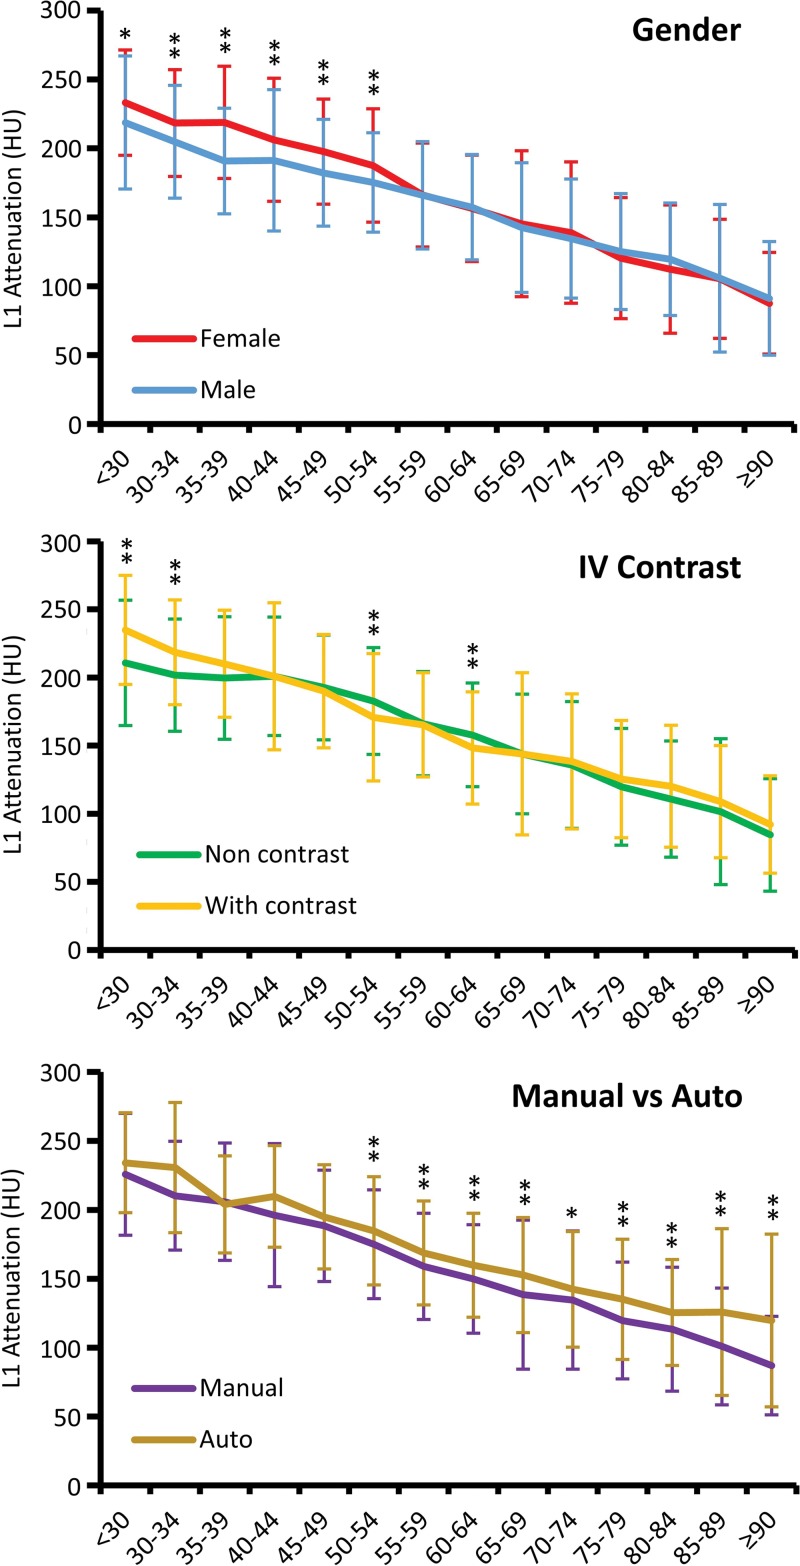
Background Abdominal and thoracic CT provide a valuable opportunity for osteoporosis screening regardless of the clinical indication for imaging. Purpose To establish reference normative ranges for first lumbar vertebra (L1) trabecular attenuation values across all adult ages to measure bone mineral density (BMD) at routine CT. Materials and Methods Reference data were constructed from 20 374 abdominal and/or thoracic CT examinations performed at 120 kV. Data were derived from adults (mean age, 60 years ± 12 [standard deviation]; 56.1% [11 428 of 20 374] women). CT examinations were performed with (n = 4263) or without (n = 16 111) intravenous contrast agent administration for a variety of unrelated clinical indications between 2000 and 2018. L1 Hounsfield unit measurement was obtained either with a customized automated tool (n = 11 270) or manually by individual readers (n = 9104). The effects of patient age, sex, contrast agent, and manual region-of-interest versus fully automated L1 Hounsfield unit measurement were assessed using multivariable logistic regression analysis. Results Mean L1 attenuation decreased linearly with age at a rate of 2.5 HU per year, averaging 226 HU ± 44 for patients younger than 30 years and 89 HU ± 38 for patients 90 years or older. Women had a higher mean L1 attenuation compared with men (P < .008) until menopause, after which both groups had similar values. Administration of intravenous contrast agent resulted in negligible differences in mean L1 attenuation values except in patients younger than 40 years. The fully automated method resulted in measurements that were average 21 HU higher compared with manual measurement (P < .004); at intrapatient subanalysis, this difference was related to the level of transverse measurement used (midvertebra vs off-midline level). Conclusion Normative ranges of L1 vertebra trabecular attenuation were established across all adult ages, and these can serve as a quick reference at routine CT to identify adults with low bone mineral density who are at risk for osteoporosis. © RSNA, 2019 Online supplemental material is available for this article. See also the editorial by Smith in this issue.
Figures
Comment in
-
Screening of Bone Density at CT: An Overlooked Opportunity.Radiology. 2019 May;291(2):368-369. doi: 10.1148/radiol.2019190434. Epub 2019 Mar 26. Radiology. 2019. PMID: 30917293 No abstract available.
References
-
- Burge R, Dawson-Hughes B, Solomon DH, Wong JB, King A, Tosteson A. Incidence and economic burden of osteoporosis-related fractures in the United States, 2005-2025. J Bone Miner Res 2007;22(3):465–475. - PubMed
-
- Black DM, Rosen CJ. Postmenopausal osteoporosis. N Engl J Med 2016;374(21): 2096–2097. - PubMed
-
- Khosla S, Shane E. A crisis in the treatment of osteoporosis. J Bone Miner Res 2016;31(8):1485–1487. - PubMed
-
- Miller PD. Underdiagnosis and undertreatment of osteoporosis: the battle to be won. J Clin Endocrinol Metab 2016;101(3):852–859. - PubMed
Publication types
MeSH terms
Substances
LinkOut - more resources
Full Text Sources
Other Literature Sources
Medical
