. 2019 Jul;31(7):1002-1017.
doi: 10.1162/jocn_a_01399. Epub 2019 Mar 26.

Joint Encoding of Auditory Timing and Location in Visual Cortex

Affiliations

Joint Encoding of Auditory Timing and Location in Visual Cortex

John Plass et al. J Cogn Neurosci. 2019 Jul.

Abstract

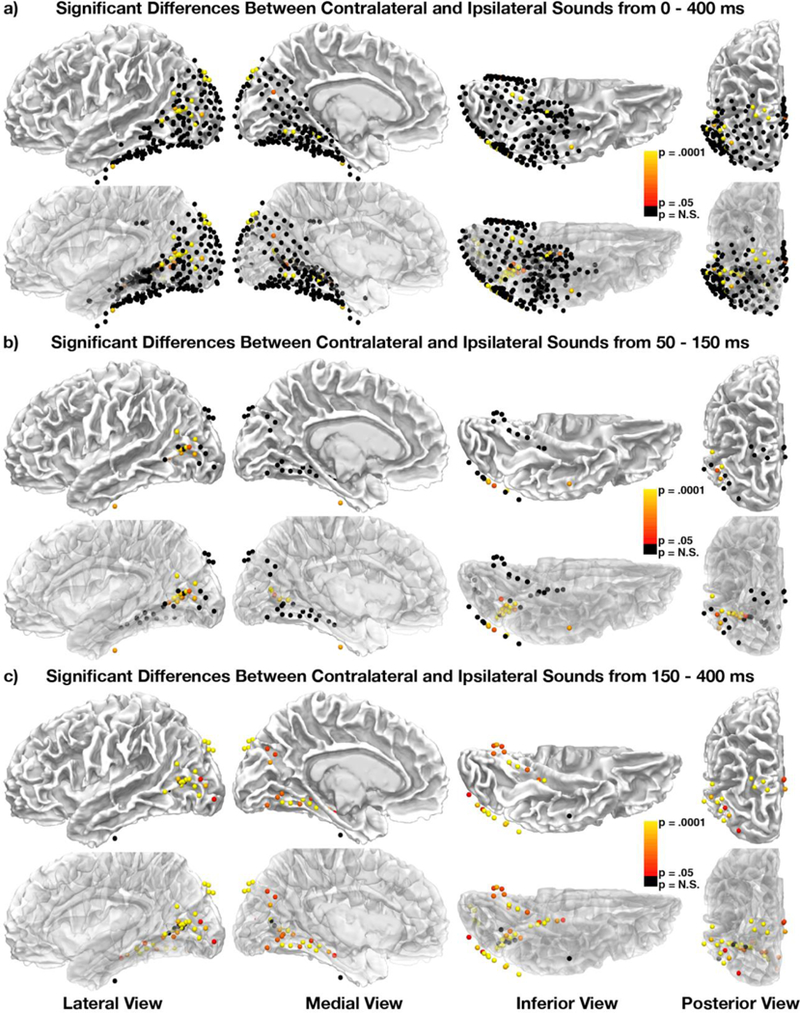
Co-occurring sounds can facilitate perception of spatially and temporally correspondent visual events. Separate lines of research have identified two putatively distinct neural mechanisms underlying two types of crossmodal facilitations: Whereas crossmodal phase resetting is thought to underlie enhancements based on temporal correspondences, lateralized occipital evoked potentials (ERPs) are thought to reflect enhancements based on spatial correspondences. Here, we sought to clarify the relationship between these two effects to assess whether they reflect two distinct mechanisms or, rather, two facets of the same underlying process. To identify the neural generators of each effect, we examined crossmodal responses to lateralized sounds in visually responsive cortex of 22 patients using electrocorticographic recordings. Auditory-driven phase reset and ERP responses in visual cortex displayed similar topography, revealing significant activity in pericalcarine, inferior occipital-temporal, and posterior parietal cortex, with maximal activity in lateral occipitotemporal cortex (potentially V5/hMT+). Laterality effects showed similar but less widespread topography. To test whether lateralized and nonlateralized components of crossmodal ERPs emerged from common or distinct neural generators, we compared responses throughout visual cortex. Visual electrodes responded to both contralateral and ipsilateral sounds with a contralateral bias, suggesting that previously observed laterality effects do not emerge from a distinct neural generator but rather reflect laterality-biased responses in the same neural populations that produce phase-resetting responses. These results suggest that crossmodal phase reset and ERP responses previously found to reflect spatial and temporal facilitation in visual cortex may reflect the same underlying mechanism. We propose a new unified model to account for these and previous results.


Figures

Figure 1.
Figure 1.
(a) Intracranial electrodes from 22 patients, displayed on an average brain (all electrodes projected into the left hemisphere). Each black or colored circle reflects a single electrode contact included in analyses, localized to visual areas (313 electrodes included in total). Electrodes were restricted to those located in occipital, parietal, or inferior/posterior temporal areas (excluding the superior temporal gyrus) and showing a significant event-related potential (ERP) to visual stimuli beginning at less than 200 ms. Color-coded electrodes correspond to data in panel b and Figures 4 and 5. (b) ERP responses from representative electrodes evoked during a visual task. Electrode numbers are located in the top left of each panel and correspond to the same numbers in Figures 4 and 5. Visual stimulus onset is at 0 seconds (vertical dotted line). Shaded error-bars reflect 95% confidence intervals.
Figure 2.
Figure 2.
Colored electrodes reflect significant (multiple comparison corrected for time-polnts and electrodes) activity according to either (a) inter-trial phase coherence (ITPC) or (b) event-related potential (ERP) analyses. Sounds activate visual cortex broadly and in a similarly distributed manner across both analyses, suggesting ERP and ITPC measures of phase-reset reflect similar mechanisms. The second row of images in each section reflects the same data on partially transparent brains to show statistics from electrodes not visible at the surface of the brain. The third row shows data from the individual electrodes shown in Figure 1 b.
Figure 3.
Figure 3.
Colored electrodes reflect significant (multiple comparison corrected for time-points and electrodes) differences between contralateral and ipsilateral sounds from either (a) 0–400 ms, (b) 50–150 ms, or (c) 150–400 ms. (b-c) Black electrodes reflect non-significant differences in one of the two time-peri- ods. The second row of images in each section reflects the same data on partially transparent brains to show statistics from electrodes not visible at the surface of the brain.
Figure 4.
Figure 4.
ERPs at visual electrodes showing significant differences between contralateral (red) and ipsilat- eral (blue) sounds. Electrode numbers are located in the top left of each panel. Sound onset is at 0 seconds (vertical dotted line). Shaded color-bars reflect 95% confidence intervals. Black bars at bottom of plots show time-points at which the two conditions significantly differered from one another (corrected for multiple comparisons). Asterisks reflect significant one-sample t-tests (corrected for multiple comparisons) for either contralateral (red) or ipsilateral (blue) sounds.
Figure 5.
Figure 5.
Locations of electrodes (red) corresponding to ERPs shown in Figure 4, highlighting areas at which significant differences between ipsilateral and contralateral ERPs were observed.
Figure 6.
Figure 6.
Electrodes showing significant ERPs during contralateral sounds (blue), ipsilateral sounds (orange), or both (purple). A majority of electrodes were significant in both analyses suggesting similar neural mechanisms.
Figure 7.
Figure 7.
(a) Electrodes present in the 4 participants with the greatest number of visual electrodes, with distinct colors for each patient, (b) Correlations between ERP effect sizes (Cohen’s D) for contralateral and ipsilateral sounds, evoked at visual selective electrodes. Data show strong correlations across all 4 participants suggesting similar mechanisms drive visual activity in response to contralateral and ipsilateral sounds, (c) Correlations between contralateral and ipsilateral effect sizes, calculated at each millisecond following stimulus onset. Black boxes denote significant time-points (corrected for multiple comparisons). Contralateral and ipsilateral effects were strongly correlated across both early and late time-periods.

References

    1. Alho K, Medvedev SV, Pakhomov SV, Roudas MS, Tervaniemi M, Reinikainen K, … Näätänen R (1999). Selective tuning of the left and right auditory cortices during spatially directed attention. Cognitive Brain Research, 7(3), 335–341. - PubMed
    1. Bair W, & O’keefe LP (1998). The influence of fixational eye movements on the response of neurons in area MT of the macaque. Visual Neuroscience, 15(4), 779–786. - PubMed
    1. Banerjee S, Snyder AC, Molholm S, & Foxe JJ (2011). Oscillatory alpha-band mechanisms and the deployment of spatial attention to anticipated auditory and visual target locations: supramodal or sensory-specific control mechanisms? Journal of Neuroscience, 31(27), 9923–9932. 10.1523/JNEUROSCI.4660-10.2011/ - DOI - PMC - PubMed
    1. Bradley A, Yao J, Dewald J, & Richter C-P (2016). Evaluation of Electroencephalography Source Localization Algorithms with Multiple Cortical Sources. PLOS ONE, 11(1), e0147266 10.1371/journal.pone.0147266 - DOI - PMC - PubMed
    1. Brainard DH (1997). The Psychophysics Toolbox. Spatial Vision, 10(4), 433–436. - PubMed

Publication types