. 2019 Mar 26;129(6):2357-2373.
doi: 10.1172/JCI124218.

Post-transplantation cyclophosphamide prevents graft-versus-host disease by inducing alloreactive T cell dysfunction and suppression

Affiliations

Post-transplantation cyclophosphamide prevents graft-versus-host disease by inducing alloreactive T cell dysfunction and suppression

Lucas P Wachsmuth et al. J Clin Invest. .

Abstract

Post-transplantation cyclophosphamide (PTCy) recently has had a marked impact on human allogeneic hematopoietic cell transplantation (HCT). Yet, our understanding of how PTCy prevents graft-versus-host disease (GVHD) largely has been extrapolated from major histocompatibility complex (MHC)-matched murine skin allografting models that were highly contextual in their efficacy. Herein, we developed a T-cell-replete, MHC-haploidentical, murine HCT model (B6C3F1→B6D2F1) to test the putative underlying mechanisms: alloreactive T-cell elimination, alloreactive T-cell intrathymic clonal deletion, and suppressor T-cell induction. In this model and confirmed in four others, PTCy did not eliminate alloreactive T cells identified using either specific Vβs or the 2C or 4C T-cell receptors. Furthermore, the thymus was not necessary for PTCy's efficacy. Rather, PTCy induced alloreactive T-cell functional impairment which was supported by highly active suppressive mechanisms established within one day after PTCy that were sufficient to prevent new donor T cells from causing GVHD. These suppressive mechanisms included the rapid, preferential recovery of CD4+CD25+Foxp3+ regulatory T cells, including those that were alloantigen-specific, which served an increasingly critical function over time. Our results prompt a paradigm-shift in our mechanistic understanding of PTCy. These results have direct clinical implications for understanding tolerance induction and for rationally developing novel strategies to improve patient outcomes.

Keywords: Bone marrow transplantation; Immunology; T cells; Tolerance; Transplantation.


Conflict of interest statement

Conflict of interest: The authors have declared that no conflict of interest exists.

Figures

Figure 1
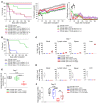
Figure 1. In a T cell–replete, MHC-haploidentical, murine HCT model (B6C3F1→B6D2F1), optimally dosed PTCy prevents severe GVHD.
On day 0, 10- to 12-week-old recipient female B6D2F1 mice were irradiated (10.5 Gy) and transplanted with 10 × 106 TCD BM cells ± 40 × 106 splenocytes (splen) from 10- to 12-week-old female B6C3F1 donors. PBS vehicle or PTCy was administered on days +3 and +4. (A) PTCy doses of 10–50 mg/kg/d prevented lethality and resulted in steadily increasing weights and normalization of clinical scores after days +90–100. (B) PTCy doses of 1 or 5 mg/kg/d were ineffective in preventing fatal GVHD. (C and D) Mice receiving T cell–replete grafts with or without PTCy became full donor T cell chimeras by day (C) +7 to (D) +21. (E and F) Mice treated with the optimal dose of PTCy (25 mg/kg) in this model had only mild histopathologic evidence of GVHD at either day (E) +7 or (F) +21. Combined results from (A, B, DF) 2 or (C) 3 independent experiments are shown. n = 10/group for A and B; n = 6/group for C and E; and n = 8/group for D and F except for the 100 mg/kg PTCy groups in D (n = 5) and F (n = 7). ***P ≤ 0.001; ****P ≤ 0.0001, 1-way ANOVA followed by the Holm-Šidák post hoc test.
Figure 2
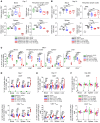
Figure 2. Optimally dosed PTCy neither induces pan–T cell depletion nor eliminates alloreactive T cells, but does reduce CD4+ T cell proliferation.
Mice were transplanted as in Figure 1 and assessed at day +7, +21, or +200. All groups were allogeneic (Allo, B6C3F1→B6D2F1) unless specifically labeled as syngeneic (B6D2F1→B6D2F1). (A and B) T cell numbers in different tissue compartments at day (A) +7 or (B) +21. (C) High global T cell proliferation (Ki-67+) was observed at day +7. CD4+ T cell proliferation was reduced with increasing doses of PTCy, while CD8+ T cells continued to proliferate robustly despite treatment with 25 mg/kg PTCy. Only after 100 mg/kg PTCy was CD8+ T cell proliferation significantly reduced. (DF) Regardless of PTCy treatment or dose, alloreactive Vβ6+ T cells persisted at levels similar to those seen in donors (dotted blue line; median values from Supplemental Figure 7: CD8+, 11.9%; CD4+CD25Foxp3 conventional T cells [CD4+ Tcons], 10.5%) and even exceeded donor levels in the spleen and liver at day +7 after 100 mg/kg PTCy. These effects contrast with those in mice treated with TCD BM without PTCy in which Vβ6+ T cells were deleted over time. Combined results from (A, C, D) 3 (n = 6/group) or (B, E) 2 (n = 8/group except 100 mg/kg PTCy [n = 5]) independent experiments are shown. F shows data from all mice from Figure 1A surviving to day +200. *P ≤ 0.05; **P ≤ 0.01; ***P ≤ 0.001; ****P ≤ 0.0001, 1-way ANOVA followed by the Holm-Šidák post hoc test using the vehicle-treated splenocyte group as the control. LN, peripheral lymph nodes.
Figure 3
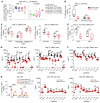
Figure 3. Alloreactive 2C TCR+ CD8+ T cells proliferate and preferentially expand despite PTCy, while nonalloreactive 2C TCR+ CD8+ T cells remain phenotypically naive, minimally proliferative, and consequently contract.
(AC) Splenocytes from 2C TCR+ B6C3F1 transgenic mice were admixed with WT B6C3F1 splenocytes to manufacture grafts in which approximately 8% (acceptable range 7.2%–8.8%) of infused CD8+ T cells were 2C TCR+ (Vβ8.1/8.2+1B2+) and then used as donor splenocytes to transplant mice as shown in Figure 1. (A) GVHD remained universally severe and fatal in vehicle-treated mice, while PTCy remained effective. (B) Left: high-level proliferation (Ki-67+) of 2C TCR+ T cells was observed in vehicle-treated mice at days +3 and +7. This proliferation was not reduced by 25 mg/kg PTCy on days +3 and +4. Right: 2C TCR+ T cells expanded from the 8% (dotted blue line) percentage in the allograft to dominate the T cell repertoire at day +7. This relative expansion was not blocked by PTCy on days +3 and +4. (C) 2C TCR+ T cells (left) persisted and (right) remained proliferative at day +200. The proliferation data shown are for the liver. (DF) An admixed graft approach identical to that used in AC was used, except that the model was B6→B6C3F1. 2C TCR+ T cells, nonalloreactive in this model, (D) proliferated at low levels, in contrast with alloreactive Vβ3+ and Vβ5+ T cells, (E) maintained a naive phenotype, and (F) consequently contracted by day +7 from the 8% (dotted blue line) percentage in the allograft. Combined results from 2 independent experiments are shown. n = 8/group. *P ≤ 0.05; **P ≤ 0.01; ****P ≤ 0.0001, unpaired t test with Welch’s correction for the mice treated with or without PTCy assessed on day +7.
Figure 4
Figure 4. Alloreactive 4C TCR+ CD4+ T cells persist after PTCy.
Splenocytes from 4C TCR+ B6C3F1 (CD45.1+CD45.2+) transgenic mice were admixed with WT B6C3F1 (CD45.1CD45.2+) splenocytes to manufacture grafts in which approximately 8% (acceptable range 7.2%–8.8%) of infused CD4+ T cells were 4C TCR+ (Vβ13+CD45.1+). These splenocytes were then used as donor splenocytes to transplant mice as shown in Figure 1. (A) At day +7, 25 mg/kg/d PTCy on days +3 and +4 had significantly reduced the proliferation (Ki-67+) of 4C TCR+ CD4+CD25Foxp3 T cells in the blood and liver, which was analogous to its effect on Vβ6+ CD4+ T cells shown in Figure 2C. (B) Nevertheless, 4C TCR+ CD4+CD25Foxp3 T cells persisted at day +7 at similar or even higher percentages compared with levels observed in vehicle-treated mice. Combined results from 2 independent experiments are shown using n = 8/group for each of the vehicle-treated and PTCy-treated groups. n = 6 for mice assessed on day +3. *P ≤ 0.05; ****P ≤ 0.0001, unpaired t test with Welch’s correction for the mice treated with or without PTCy assessed on day +7. NE indicates that all samples in that subset were not evaluable due to the parent populations all being less than 100 cells.
Figure 5
Figure 5. The thymus is dispensable for the efficacy of PTCy in preventing GVHD.
(A) Thymectomized recipients were used in the B6C3F1→B6D2F1 model. PTCy remained effective. Combined results of 2 independent experiments are shown. n = 5 mice/group/experiment. (B) Data from nonthymectomized recipients (10 experiments, n = 49) are overlaid on results from A (n = 10); the outcomes were nearly identical. Survival was compared using the exact log-rank test. *P < 0.05 on point-wise comparison using Wilcoxon’s rank sum test.
Figure 6
Figure 6. PTCy-treated alloreactive T cells become functionally impaired, but not anergic, in response to alloantigen.
Transplantation was performed as in Figure 1. PTCy was 25 mg/kg/d on days +3 and +4 where not otherwise specified. (A) High-level proliferation (Ki-67+) of liver-infiltrating alloreactive (Vβ6+) CD4+CD25Foxp3 donor (H2kk+) conventional T cells at days +21 and +200. (BF) At day +21, liver-infiltrating cells were isolated and restimulated (stim) in vitro with irradiated (30 Gy) donor-parental (C3H) or host-parental (DBA/2) splenocytes at 2 × 10⁵ each of donors and stimulators per well. (B) Donor (H2kk+H2kb+) T cells from PTCy-treated mice had low proliferation to C3H at 5 days. (C) Proliferation was robust to alloantigen (DBA/2), although CD8+ T cell proliferation was reduced. (D) Cytokine production at 24 hours to alloantigen by PTCy-treated cells was markedly lower. (E and F) Procedures similar to those shown in BD were followed, except responder T cells were flow cytometrically purified including removing CD4+CD25+ T cells (Tregs) prior to coculture. Similarly impaired (E) proliferation and (F) cytokine production by PTCy-treated T cells were seen. (G) The procedures in BD were repeated at day +150. PTCy-treated T cells continued to proliferate and produce IFN-γ and IL-2 in response to alloantigen but not self-antigen; these differences were not due to disparities in the CD4+CD25+Foxp3+ T cell content of the restimulated cells (P = 0.21; not shown). Combined results from 2 independent experiments are shown for all parts. n = 8 mice/group for all parts except the 100 mg/kg PTCy group shown in the left panel in A (n = 5), the right panel in A (which shows all mice from Figure 1A surviving to day 200), EF (n = 5-6/group), and the 25 mg/kg PTCy groups in G (n = 7). *P ≤ 0.05; **P ≤ 0.01; ***P ≤ 0.001; ****P ≤ 0.0001, unpaired t test with Welch’s correction. ND, not detectable. Statistical testing of cytokines was adjusted for multiple comparisons by the Holm-Šidák method.
Figure 7
Figure 7. PTCy-treated alloreactive T cells have impaired intrinsic ability to induce GVHD on serial transplant.
Irradiated B6D2F1 recipient mice were transplanted with 40 × 106 2C TCR+ admixed B6C3F1 splenocytes and 10 × 106 WT TCD BM cells as described in Figure 3 (8% of CD8+ T cells were 2C TCR+) or with 40 × 106 splenocytes and 10 × 106 TCD BM from 2C TCR+ B6C3F1 donors. Mice received either vehicle or 25 mg/kg/d PTCy on days +3 and +4. On day +5, splenocytes from these mice were flow cytometrically sorted to isolate viable 2C TCR+ T cells (LIVE/DEADCD8+Vβ8.1/8.2+1B2+). 0.5 × 10⁶ 2C TCR+ T cells from mice that had received 2C/WT admixed grafts or 1 × 10⁶ 2C TCR+ T cells from mice that had received only 2C splenocytes were combined with 5 × 10⁶ 2C TCD BM cells (BM from new 2C donors that was flow cytometrically depleted of Thy1.2+ cells). These grafts then were transplanted into new, irradiated (10.5 Gy), thymectomized, B6D2F1 recipients. These recipients did not receive any posttransplant treatment (i.e., no PTCy or vehicle on days +3/+4). Combined results from mice receiving 2C TCR+ T cells from 2C only grafts (n = 5 vehicle treated, n = 5 PTCy treated) or from 2C/WT admixed grafts (n = 5 vehicle treated, n = 4 PTCy treated) are shown as are data for 5 mice receiving TCD BM only. Results of each individual experiment are shown in Supplemental Figure 15. (A) Although the GVHD induced was not fatal for either treatment group, mice receiving PTCy-treated cells had superior weights and clinical scores compared with mice receiving vehicle-treated cells. AUC values were compared using Wilcoxon’s rank sum test. (B) These differences were seen even though similar numbers of 2C TCR+ T cells persisted in the liver at day +150 in mice receiving vehicle-treated or PTCy-treated cells.
Figure 8
Figure 8. CD4+CD25+Foxp3+ Tregs, including alloantigen-specific Tregs, preferentially expand after optimally dosed PTCy.
Mice were transplanted as in Figure 2. For C, allografts were made using Foxp3-DTR-GFP–expressing B6C3F1 male donor mice. (A) At day +7 in the B6C3F1→B6D2F1 HCT model, Treg percentages were stable to slightly decreased after PTCy treatment. (B) However, at day +21, mice treated with 25 mg/kg PTCy had significantly higher percentages of CD4+CD25+Foxp3+ Tregs in all tissue compartments. This increase was blunted after 100 mg/kg PTCy, a dose associated with worse GVHD histopathologically. (C) At day +21, CD25+Foxp3(GFP)+ CD4+ T cells pooled from the liver, blood, peripheral lymph nodes, and spleens of mice (n = 3) treated with 25 mg/kg/d PTCy on days +3 and +4 were largely demethylated within the TSDR of the Foxp3 gene, suggesting that the CD4+CD25+Foxp3+ T cell population expanded after PTCy was primarily composed of natural Tregs. In contrast, CD25Foxp3(GFP) CD4+ T cells at day +21 from these same mice were nearly all methylated. The numbers indicate the CpG site location relative to the transcriptional start site. (DE) The percentages of alloantigen-specific (Vβ6+) Tregs in the liver increased after PTCy at both days (D) +7 and (E) +21. Of note, all samples in the day +7 100 mg/kg PTCy group had Treg numbers of less than 100 cells and would therefore normally be excluded, but are included here for illustrative purposes. Combined results from (A, D) 3 (n = 6/group) or (B, E) 2 (n = 8/group except 100 mg/kg PTCy; n = 5) independent experiments are shown. *P ≤ 0.05; **P ≤ 0.01; ***P ≤ 0.001; ****P ≤ 0.0001, 1-way ANOVA with Holm-Šidák post hoc test using the allogeneic (Allo) TCD BM and splenocyte, vehicle group (labeled Allo, vehicle for A, D and BM, splen, vehicle for B, E) as control.
Figure 9
Figure 9. Foxp3+ depletion induces severe and fatal GVHD, particularly at later posttransplant time points.
DT treatment of thymectomized B6D2F1 mice transplanted with Foxp3-DTR–expressing B6C3F1 grafts from 9- to 13-week-old male donors beginning (A) immediately after transplant (days 0, +1, +6, +7), (B) at day +30 (days +30, +31, +36, +37) or day +60 (days +60, +61, +66, +67), or (C) at day +150 (days +150, +151, +156, +157) induced severe and frequently fatal GVHD. Survival was compared using the exact log-rank test. AUCs were compared using Wilcoxon’s rank sum test. P values for B reflect comparisons of vehicle with DT day +30 (over days +30 to +150) or day +60 (over days +60 to +150), respectively. Weights and clinical scores in C were compared between the 2 DTR groups over days +150 to +250. Combined results from (AB) 2 or (C) 4 independent experiments are shown. n = 10–16/group for A; n = 9–10/DTR group and n = 8/WT group for B; and n = 15, 9, and 12/group for the WT, DTR/vehicle, and DTR/DT groups, respectively, for C.
Figure 10
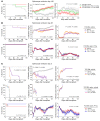
Figure 10. PTCy rapidly induces suppressive mechanisms that prevent new splenocytes not exposed to PTCy from causing GVHD.
Recipient B6D2F1 mice were transplanted as in Figure 1 and received vehicle or PTCy on days +3 and +4. On day (A) +126, (B) +28, or (C) +5, all groups were reinfused with vehicle or with 40 × 106 or 120 × 106 splenocytes from new 10- to 12-week-old B6C3F1 donor mice. A shows the original treatments for each group, and all were reinfused with 120 × 106 splenocytes. Survival was compared using the exact log-rank test. Weight and clinical score AUCs were compared using Wilcoxon’s rank sum test. AUC comparisons for B are over days +28 to +130, as the groups were identically treated prior to that time point. All other AUCs are over the entire evaluation period. P values show comparisons between the first and second groups (shown first) and the first and third groups (shown second).

Comment in

References

    1. Gragert L, et al. HLA match likelihoods for hematopoietic stem-cell grafts in the U.S. registry. N Engl J Med. 2014;371(4):339–348. doi: 10.1056/NEJMsa1311707. - DOI - PMC - PubMed
    1. Kanakry CG, Fuchs EJ, Luznik L. Modern approaches to HLA-haploidentical blood or marrow transplantation. Nat Rev Clin Oncol. 2016;13(1):10–24. doi: 10.1038/nrclinonc.2015.128. - DOI - PMC - PubMed
    1. Szydlo R, et al. Results of allogeneic bone marrow transplants for leukemia using donors other than HLA-identical siblings. J Clin Oncol. 1997;15(5):1767–1777. doi: 10.1200/JCO.1997.15.5.1767. - DOI - PubMed
    1. Kanakry CG, et al. Low immunosuppressive burden after HLA-matched related or unrelated BMT using posttransplantation cyclophosphamide. Blood. 2017;129(10):1389–1393. doi: 10.1182/blood-2016-09-737825. - DOI - PMC - PubMed
    1. McCurdy SR, et al. Grade II acute graft-versus-host disease and higher nucleated cell graft dose improve progression-free survival after HLA-haploidentical transplant with post-transplant cyclophosphamide. Biol Blood Marrow Transplant. 2018;24(2):343–352. doi: 10.1016/j.bbmt.2017.10.023. - DOI - PMC - PubMed

Publication types

MeSH terms

Substances