

SUMOylation promotes protective responses to DNA-protein crosslinks
- PMID: 30914427
- PMCID: PMC6463212
- DOI: 10.15252/embj.2019101496
SUMOylation promotes protective responses to DNA-protein crosslinks
Abstract
DNA-protein crosslinks (DPCs) are highly cytotoxic lesions that obstruct essential DNA transactions and whose resolution is critical for cell and organismal fitness. However, the mechanisms by which cells respond to and overcome DPCs remain incompletely understood. Recent studies unveiled a dedicated DPC repair pathway in higher eukaryotes involving the SprT-type metalloprotease SPRTN/DVC1, which proteolytically processes DPCs during DNA replication in a ubiquitin-regulated manner. Here, we show that chemically induced and defined enzymatic DPCs trigger potent chromatin SUMOylation responses targeting the crosslinked proteins and associated factors. Consequently, inhibiting SUMOylation compromises DPC clearance and cellular fitness. We demonstrate that ACRC/GCNA family SprT proteases interact with SUMO and establish important physiological roles of Caenorhabditis elegans GCNA-1 and SUMOylation in promoting germ cell and embryonic survival upon DPC formation. Our findings provide first global insights into signaling responses to DPCs and reveal an evolutionarily conserved function of SUMOylation in facilitating responses to these lesions in metazoans that may complement replication-coupled DPC resolution processes.
Keywords: SUMO; DNA repair; DNA‐protein crosslinks; post‐translational modifications; proteomics.
© 2019 The Authors. Published under the terms of the CC BY NC ND 4.0 license.
Conflict of interest statement
The authors declare that they have no conflict of interest.
Figures
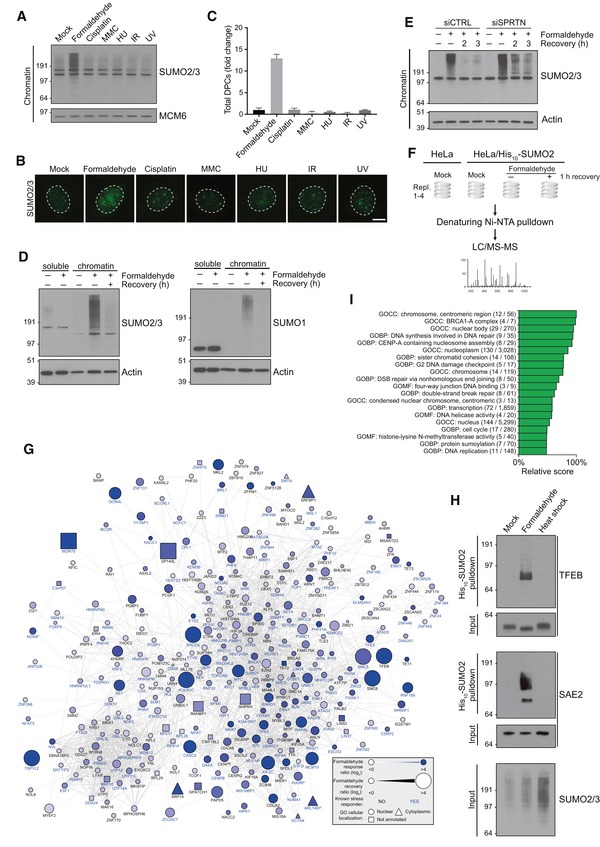
Chromatin‐enriched fractions of HeLa cells exposed to the indicated genotoxic agents for 1 h were subjected to immunoblot analysis using SUMO2/3 antibody.
As in (A), except that cells were preextracted in 0.2% Triton X‐100, fixed, and immunostained with SUMO2/3 antibody. Representative images are shown. Scale bar, 5 μm.
Relative DPC levels in cells treated as in (A) were quantified using a KCl/SDS precipitation assay (mean ± SD; n = 3 independent experiments).
HeLa cells were treated with formaldehyde for 1 h, and where indicated, propagated for an additional h in the absence of formaldehyde (recovery). Cells were then fractionated into soluble and chromatin‐enriched fractions and immunoblotted with SUMO2/3 and SUMO1 antibodies.
As in (D), but using HeLa cells transfected with non‐targeting control (CTRL) or SPRTN siRNAs.
Experimental set‐up for global proteomic analysis of formaldehyde‐induced SUMOylation changes.
Mass spectrometry‐based analysis of formaldehyde‐induced SUMOylation changes. His10‐SUMO2 conjugates from HeLa/His10‐SUMO2 cells subjected or not to formaldehyde as shown in (F) were purified on Ni‐NTA under stringent conditions and analyzed by mass spectrometry. All proteins displaying significant upregulation of SUMOylation in response to formaldehyde treatment (Table EV1) were subjected to network analysis using the STRING database, at the default interaction confidence setting of 0.4. Proteins not connected to the network were omitted.
SUMO2 conjugates from HeLa/His10‐SUMO2 cells subjected or not to formaldehyde or heat stress for 1 h were purified as in (G) and immunoblotted with indicated antibodies.
SUMO target proteins displaying at least 2.5‐fold upregulation of SUMOylation after formaldehyde treatment were mapped to the human proteome, which was annotated with Gene Ontology (GO) terms. Enrichment analysis was performed to find terms significantly enriched for formaldehyde‐induced SUMOylated proteins, using Fisher exact testing with multiple‐hypothesis correction to achieve a final q‐value of < 0.02. A relative score was derived from a combination of the enrichment ratio and the q‐value. A full list of all enriched terms is available (Table EV2). GOBP, GO biological processes; GOCC, GO cellular compartments; GOMF, GO molecular functions.
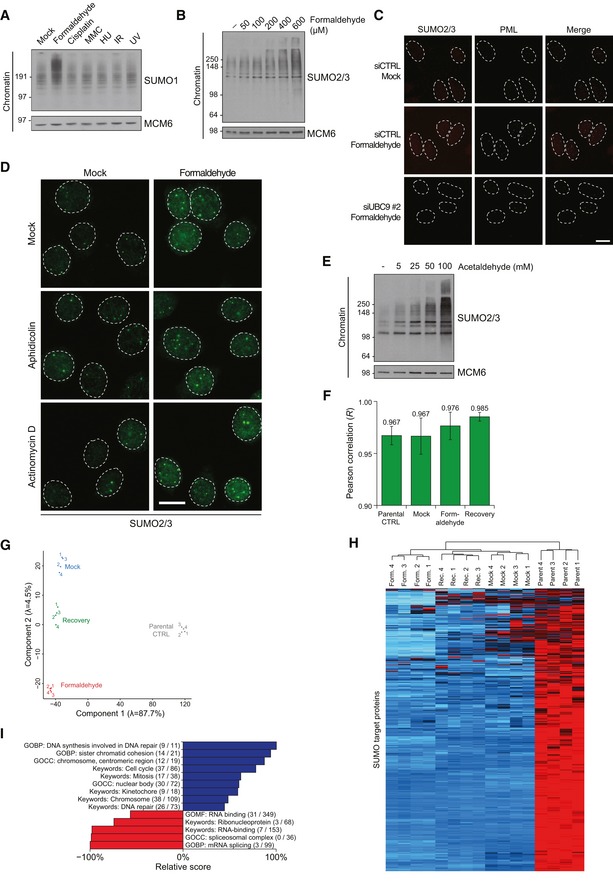
Chromatin‐enriched fractions of HeLa cells exposed to the indicated genotoxic agents for 1 h were subjected to immunoblot analysis using antibodies to SUMO1 and MCM6 (loading control).
Chromatin‐enriched fractions of HeLa cells exposed to the indicated doses of formaldehyde for 1 h were subjected to immunoblot analysis using SUMO2/3 and MCM6 antibodies.
HeLa cells transfected with non‐targeting control (CTRL) or UBC9 siRNAs were left untreated or exposed to formaldehyde, preextracted and fixed 1 h later, and co‐immunostained with SUMO2/3 and PML antibodies. Representative images are shown. Scale bar, 10 μm.
HeLa cells incubated in the presence of aphidicolin or actinomycin D to inhibit DNA replication or transcription, respectively, were left untreated or exposed to formaldehyde for 1 h. Cells were then preextracted, fixed, and immunostained with SUMO2/3 antibody. Representative images are shown. Scale bar, 10 μm.
Chromatin‐enriched fractions of U2OS cells exposed to the indicated doses of acetaldehyde for 1 h were subjected to immunoblot analysis using antibodies to SUMO2/3 and MCM6 (loading control).
Average Pearson correlation between same‐condition experimental replicates for global proteomic analysis of formaldehyde‐induced SUMOylation changes (Fig 1F), derived from scatter plot analysis of log2‐transformed intensity values. Error bars indicate standard deviation.
Principal component analysis (PCA) of all experimental replicates for global proteomic analysis of formaldehyde‐induced SUMOylation changes (Fig 1F), visualizing the degree of overall variability between all experiments. Eigenvalues are displayed on the axes.
Unsupervised hierarchical clustering analysis of Z‐scored log2‐transformed intensity values corresponding to all identified SUMO target proteins (Fig 1F; Table EV1), highlighting clusters of proteins dynamically SUMOylated in response to specific treatments. Red: < 1 standard deviations (SD); black: 0 SD; blue: 1 SD; cyan: > 2 SD.
SUMO target proteins displaying at least 2.5‐fold upregulation of SUMOylation after formaldehyde treatment were mapped to all SUMOylated proteins identified (Fig 1F; Table EV1), which were annotated with Gene Ontology (GO) terms. Enrichment analysis was performed to find terms significantly enriched (blue) or depleted (red) for formaldehyde‐induced SUMOylated proteins, using Fisher exact testing with multiple‐hypothesis correction to achieve a final q‐value of < 0.02. A relative score was derived from a combination of the enrichment ratio and the q‐value. Selected GO terms are shown. See also Table EV2. GOBP, GO biological processes; GOCC, GO cellular compartments; GOMF, GO molecular functions.
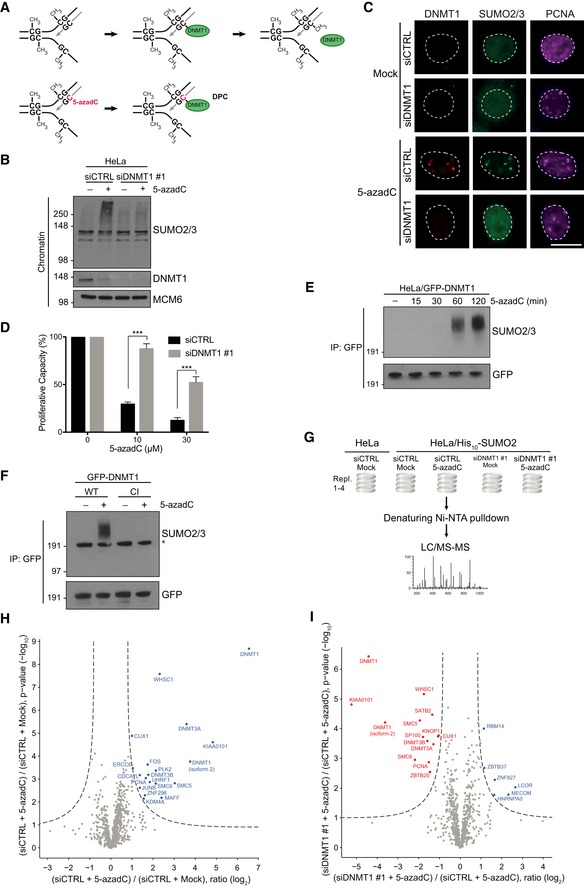
Principle of 5‐azadC‐induced DNMT1 DPC formation. See main text for details.
HeLa cells were transfected with non‐targeting control (CTRL) or DNMT1 siRNAs, exposed or not to 5‐azadC, and collected 2 h later. Chromatin‐enriched fractions were immunoblotted with antibodies to SUMO2/3, DNMT1, and MCM6 (loading control).
Representative images of HeLa cells that were treated as in (B) and co‐immunostained with antibodies to DNMT1, SUMO2/3, and PCNA. Scale bar, 10 μm.
Proliferative capacity of HeLa/GFP‐DNMT1 cells transfected with indicated siRNAs and exposed to the indicated 5‐azadC doses for 2 h was assayed by measuring cell proliferation with the SRB assay (mean ± SEM; n = 3 independent experiments; ***P < 0.001, Student's t‐test).
Extracts of HeLa/GFP‐DNMT1 cells treated with 5‐azadC for the indicated times were subjected to GFP immunoprecipitation (IP) under denaturing conditions followed by immunoblotting with SUMO2/3 and GFP antibodies.
HeLa cells were subjected to consecutive rounds of transfection with DNMT1 siRNA targeting the UTR and expression plasmid encoding WT or catalytically inactive (CI) GFP‐DNMT1. Cells were then left untreated or incubated with 5‐azadC for 2 h, and SUMOylation of GFP‐DNMT1 was analyzed as in (E). Asterisk denotes unmodified GFP‐DNMT1 recognized by the SUMO2/3 antibody due to weak cross‐reactivity.
Experimental set‐up for global proteomic analysis of 5‐azadC‐induced SUMOylation changes.
Mass spectrometry analysis of 5‐azadC‐induced SUMOylation changes. His10‐SUMO2 conjugates from HeLa/His10‐SUMO2 cells subjected or not to 5‐azadC as shown in (G) were purified on Ni‐NTA under stringent conditions and analyzed by mass spectrometry. Proteins displaying significantly altered SUMOylation in response to 5‐azadC treatment relative to the control condition were visualized through two‐sample t‐testing using permutation‐based FDR to achieve q‐values of < 0.05 (Table EV3).
As in (H), except that SUMO target proteins displaying altered SUMOylation upon DNMT1 knockdown are shown. Both control (CTRL) and DNMT1 siRNA‐transfected cells were treated with 5‐azadC.

Chromatin‐enriched fractions of HeLa cells transfected with non‐targeting control (CTRL) or DNMT1 siRNAs and treated with formaldehyde, 5‐azadC, and the DNA replication inhibitor aphidicolin as indicated for 1 h were immunoblotted with SUMO2/3, DNMT1, and MCM6 antibodies.
Average Pearson correlation between same‐condition experimental replicates for global proteomic analysis of 5‐azadC‐induced SUMOylation changes (Fig 2G), derived from scatter plot analysis of log2‐transformed intensity values. Error bars indicate standard deviation.
HeLa cells stably expressing GFP‐DNMT1 were transfected with indicated siRNAs, treated with 5‐azadC for 2 h, and then preextracted in stringent preextraction buffer and fixed at the indicated time points. Representative images are shown. Scale bar, 20 μm. See also Fig 3B.
HeLa cells stably expressing GFP‐DNMT1 were transfected with indicated siRNAs, treated with 5‐azadC for 2 h, and then preextracted in stringent preextraction buffer and fixed at the indicated time points. Mean GFP signal was determined by quantitative image analysis (> 1,000 cells analyzed per condition). Data from a representative experiment are shown.
Immunoblot analysis of U2OS cells transfected with non‐targeting control (CTRL), SPRTN, or ZNF451 siRNAs, using antibodies to SPRTN, ZNF451, and actin (loading control).
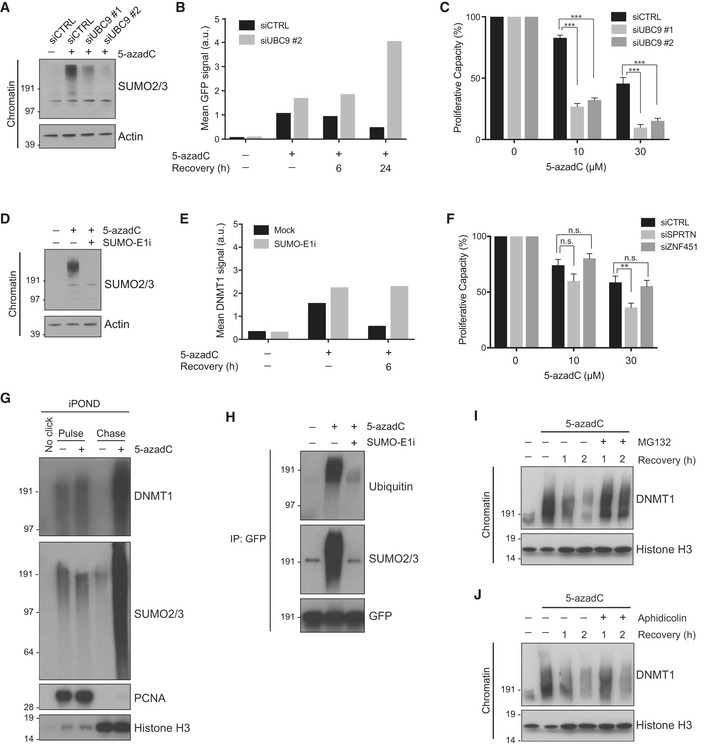
Chromatin‐enriched fractions of HeLa cells transfected with indicated siRNAs and subsequently exposed or not to 5‐azadC for 2 h were analyzed by immunoblotting with SUMO2/3 and actin antibodies.
HeLa cells stably expressing GFP‐DNMT1 and transfected with indicated siRNAs were left untreated or exposed to 5‐azadC for 2 h. Cells were then preextracted in stringent preextraction buffer and fixed at the indicated time points after 5‐azadC removal. Mean detergent‐resistant GFP signal was determined by quantitative image analysis (> 6,000 cells analyzed per condition). Data from a representative experiment are shown. Representative images are shown in Fig EV2C.
Proliferative capacity of HeLa/GFP‐DNMT1 cells transfected with control or UBC9 siRNAs and exposed to the indicated 5‐azadC doses for 2 h was assayed by measuring cell proliferation with the SRB assay (mean ± SEM; n = 3 independent experiments; ***P < 0.001, Student's t‐test).
As in (B), except that untransfected HeLa cells were exposed or not to 5‐azadC in the presence or absence of a small molecule SUMO E1 enzyme inhibitor (SUMO‐E1i).
HeLa cells treated with 5‐azadC for 2 h in the presence or absence of SUMO‐E1i were preextracted in stringent preextraction buffer, fixed at the indicated time points after 5‐azadC removal and immunostained with DNMT1 antibody. Mean detergent‐resistant DNMT1 signal was determined by quantitative image analysis (> 6,000 cells analyzed per condition). Data from a representative experiment are shown.
Proliferative capacity of HeLa cells transfected with SPRTN or ZNF451 siRNAs and exposed to indicated 5‐azadC doses for 2 h was assayed as in (C) (mean ± SEM; n = 3 independent experiments; **P < 0.01, n.s. not significant, Student's t‐test).
iPOND analysis of 5‐azadC‐induced DNMT1 trapping and SUMOylation. HeLa cells were mock‐treated or preincubated with 5‐azadC for 5 min before addition of EdU for 10 min. Cells were then washed and incubated with thymidine for 0 (pulse) or 60 min (chase) before performing iPOND.
HeLa cells stably expressing GFP‐DNMT1 were preincubated or not with SUMO‐E1i for 30 min, and where indicated, 5‐azadC was added to the medium for an additional 60 min. Cells were then processed for GFP immunoprecipitation (IP) followed by immunoblotting for the indicated proteins.
Immunoblot analysis of chromatin‐enriched fractions of HeLa cells that were synchronized in early S phase by release from double thymidine block, pulse‐labeled with 5‐azadC for 30 min, and grown in the presence or absence of proteasome inhibitor (MG132) for the indicated times.
As in (I), except that cells were treated or not with aphidicolin following pulse‐labeling with 5‐azadC.

Domain structure of the human SprT proteases SPRTN and ACRC, showing location of SprT protease domains and additional motifs, including a ubiquitin‐binding UBZ domain in SPRTN and an N‐terminal cluster of SIMs (sequence highlighted) in ACRC. Alanine substitutions introduced to disrupt the functionality of the ACRC SIMs (SIM*) are indicated.
Representative images of U2OS cells stably expressing GFP‐SPRTN or GFP‐ACRC that were transfected with control (CTRL) or UBC9 siRNAs, exposed to formaldehyde in the presence or absence of ubiquitin E1 enzyme (UBA1) inhibitor TAK‐243 (Ub‐E1i) as indicated and fixed one h later. Scale bar, 10 μm.
Quantification of data in (B), showing proportion of U2OS/GFP‐SPRTN cells displaying nuclear GFP‐SPRTN foci (mean ± SEM; at least 100 cells quantified per condition per experiment; n = 3 independent experiments).
As in (C), but showing proportion of U2OS/GFP‐ACRC cells displaying nuclear GFP‐ACRC foci (mean ± SEM; at least 100 cells quantified per condition per experiment; n = 3 independent experiments).
U2OS cells expressing GFP‐ACRC were exposed to the indicated genotoxic agents (formaldehyde: 600 μM, 1 h; UV: 20 J/m2, 6‐h recovery; hydroxyurea (HU): 2 mM, 24 h; mitomycin C (MMC): 40 ng/ml, 24 h), preextracted and fixed, and analyzed by microscopy. Representative images are shown. Scale bar, 10 μm.
HeLa cells transfected with plasmids encoding GFP alone or indicated GFP‐ACRC alleles were subjected to GFP IP under denaturing conditions. Beads were incubated with recombinant polySUMO22–8 chains, washed extensively, and processed for immunoblotting with SUMO2/3 and GFP antibodies.
Representative images of U2OS cells expressing indicated GFP‐ACRC alleles that were treated with 5‐azadC in the presence or absence of SUMO inhibitor (SUMO‐E1i), fixed 2 h later, and immunostained with DNMT1 antibody. Scale bar, 10 μm.
Quantification of data in (G), showing proportion of cells displaying GFP‐ACRC co‐localization with DNMT1 foci (mean ± SEM; at least 100 cells quantified per condition per experiment; n = 3 independent experiments).

U2OS cells expressing GFP‐ACRC were exposed or not to formaldehyde, fixed 1 h later, and immunostained with SUMO2/3 antibody. Representative images are shown. Scale bar, 10 μm.
HeLa cells transfected with plasmids encoding GFP alone or indicated GFP‐ACRC alleles were subjected to GFP IP under denaturing conditions. Beads were incubated with recombinant polySUMO23–8 chains, washed extensively, and processed for immunoblotting with SUMO2/3 and GFP antibodies.
Representative images of U2OS cells stably expressing GFP‐ACRC SIM* that were treated or not with formaldehyde and fixed 1 h later. Scale bar, 10 μm.
Quantification of data in (C), showing proportion of cells displaying nuclear GFP‐ACRC SIM* foci (mean ± SEM; at least 60 cells quantified per condition per experiment; n = 3 independent experiments).
Proliferative capacity of stable U2OS/GFP‐ACRC cell lines induced or not with doxycycline (DOX) for 2 h to express the transgenes was assayed by measuring cell proliferation with the SRB assay (mean ± SEM; n = 3 independent experiments).
U2OS/GFP‐ACRC WT cells induced or not with doxycycline (DOX) to express GFP‐ACRC were left untreated or exposed to 5‐azadC for 2 h. Cells were then preextracted in stringent preextraction buffer and fixed at the indicated time points after 5‐azadC removal, and subsequently immunostained with DNMT1 antibody. Mean detergent‐resistant DNMT1 signal was determined by quantitative image analysis (> 6,000 cells analyzed per condition). Data from a representative experiment are shown.

Domain structure of human ACRC and its C. elegans ortholog GCNA‐1. The GCNA‐1 deletion (del) introduces a frameshift at E364, giving rise to a truncated protein containing an aberrant 22‐residue C‐terminal addition.
HeLa cells transfected with plasmids encoding GFP alone, GFP‐ACRC, or GFP‐tagged C. elegans GCNA‐1 were subjected to GFP IP under denaturing conditions. Beads were incubated with recombinant polySUMO23–8 chains, washed extensively, and processed for immunoblotting with SUMO2/3 and GFP antibodies.
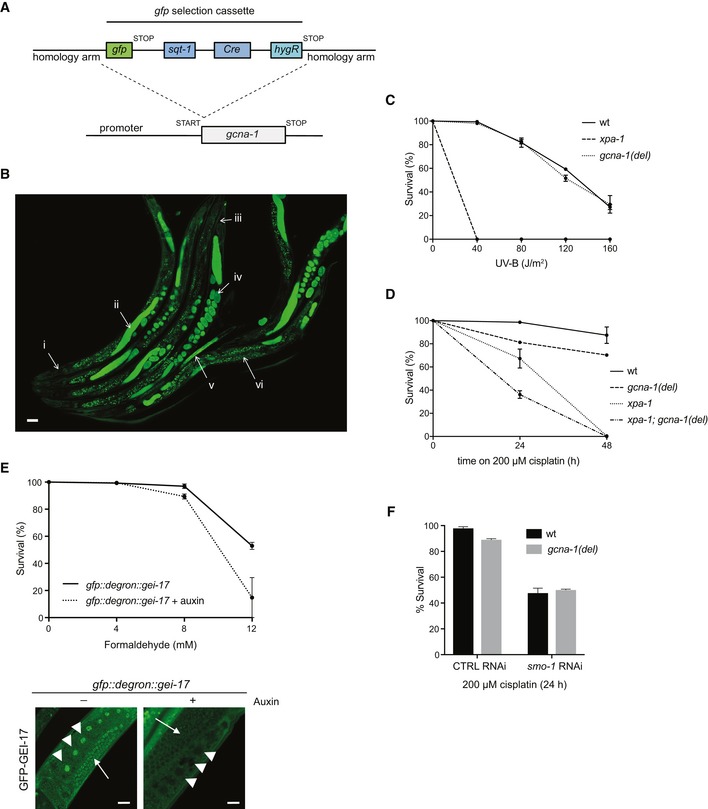
Schematic representation of the C. elegans gcna‐1 locus, depicting mutants generated. Loss of function gcna‐1 allele (emcSi31) was created by knock‐in of a gfp selection cassette (GFP‐SEC) in the start codon (see Fig EV4A). gcna‐1 deletion (emc52), leading to a frameshift and premature stop codon in the coding sequence, and E364Q point mutant (emc53) alleles were generated by CRISPR/Cas9 targeting of exon 6.
GFP expression driven by the gcna‐1 promoter was observed in germ cells, proliferating embryos, and young larvae but not in post‐mitotic tissues in the head (see also Fig EV4B). Scale bars, 50 μm.
Formaldehyde survival of wild type (wt), dvc‐1, gcna‐1 loss of function (lof), and gcna‐1; dvc‐1 double mutant C. elegans (mean ± SEM; n = 4 independent experiments).
Cisplatin survival of wild type, dvc‐1, gcna‐1, and gcna‐1; dvc‐1 double mutant C. elegans (mean ± SEM; n = 3 independent experiments).
Formaldehyde survival of gcna‐1 deletion (del) and E364Q mutant C. elegans (mean ± SEM; n = 2 independent experiments).
Formaldehyde survival of C. elegans grown on L4440 control (CTRL) or smo‐1 RNAi bacteria (mean ± SEM; n = 2 independent experiments).
Formaldehyde survival of C. elegans grown on L4440 control (CTRL) or gei‐17 RNAi bacteria (mean ± SEM; n = 2 independent experiments).
Formaldehyde survival of wild type and gcna‐1 deletion (del) mutant C. elegans grown on L4440 control (CTRL) or smo‐1 RNAi bacteria (mean ± SEM; n = 2 independent experiments).
Schematic showing the strategy for gfp selection cassette knock‐in in the start codon of C. elegans gcna‐1, simultaneously generating a transcriptional gfp reporter and gcna‐1 loss of function allele, which can be selected for by the visible “roller” phenotype produced by sqt‐1 and hygromycin resistance by hygR.
GFP positivity in the gcna‐1 loss of function strain emcSi31 (Fig 4C) demarcates GCNA‐1 expression patterns in C. elegans (i. head: no expression; ii. GFP expression in meiotic germ cells; iii. tail: no expression; iv. GFP expression in embryos; v. GFP expression in young larvae; vi. speckles in the intestine: background fluorescence). A representative image depicting multiple animals is shown. Scale bar, 50 μm.
UV survival of wild type (wt), gcna‐1 deletion (del), and xpa‐1 deletion C. elegans (mean ± SEM; n = 2 independent experiments).
Cisplatin survival of wild type (wt), gcna‐1 deletion (del), xpa‐1 deletion, and xpa‐1; gcna‐1 double mutant C. elegans (mean ± SEM; n = 2 independent experiments).
Upper panel: formaldehyde survival of gei‐17 knock‐in animals expressing GFP‐ and auxin‐responsive degron‐tagged GEI‐17 grown in the absence or presence of auxin for 24 h to induce GEI‐17 depletion (mean ± SEM; n = 2 independent experiments). Lower panel: representative images showing loss of GFP fluorescence in germ cells (arrowheads: oocytes; arrows: meiotic cells) of animals grown in the presence of auxin, demonstrating efficient auxin‐dependent depletion of GFP::degron‐tagged GEI‐17. Scale bar, 20 μm.
Cisplatin survival of wild type and gcna‐1 deletion (del) mutant C. elegans grown on L4440 control (CTRL) or smo‐1 RNAi bacteria (mean ± SEM; n = 2 independent experiments). Due to the toxicity of smo‐1 RNAi, survival following cisplatin exposure for more than 24 h could not be assessed.
References
-
- Barker S, Weinfeld M, Murray D (2005) DNA‐protein crosslinks: their induction, repair, and biological consequences. Mutat Res 589: 111–135 - PubMed
-
- Carmell MA, Dokshin GA, Skaletsky H, Hu YC, van Wolfswinkel JC, Igarashi KJ, Bellott DW, Nefedov M, Reddien PW, Enders GC, Uversky VN, Mello CC, Page DC (2016) A widely employed germ cell marker is an ancient disordered protein with reproductive functions in diverse eukaryotes. Elife 5: e19993 - PMC - PubMed
Publication types
MeSH terms
Substances
LinkOut - more resources
Full Text Sources
Other Literature Sources
Molecular Biology Databases
