. 2019 May 10;294(19):7864-7877.
doi: 10.1074/jbc.RA118.006166. Epub 2019 Mar 26.

4-Methylumbelliferyl glucuronide contributes to hyaluronan synthesis inhibition

Affiliations

4-Methylumbelliferyl glucuronide contributes to hyaluronan synthesis inhibition

Nadine Nagy et al. J Biol Chem. .

Abstract

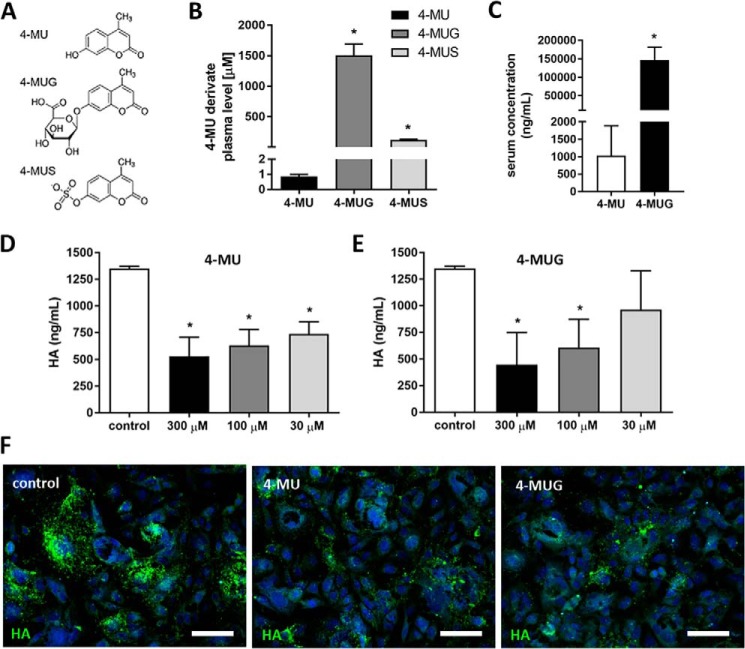
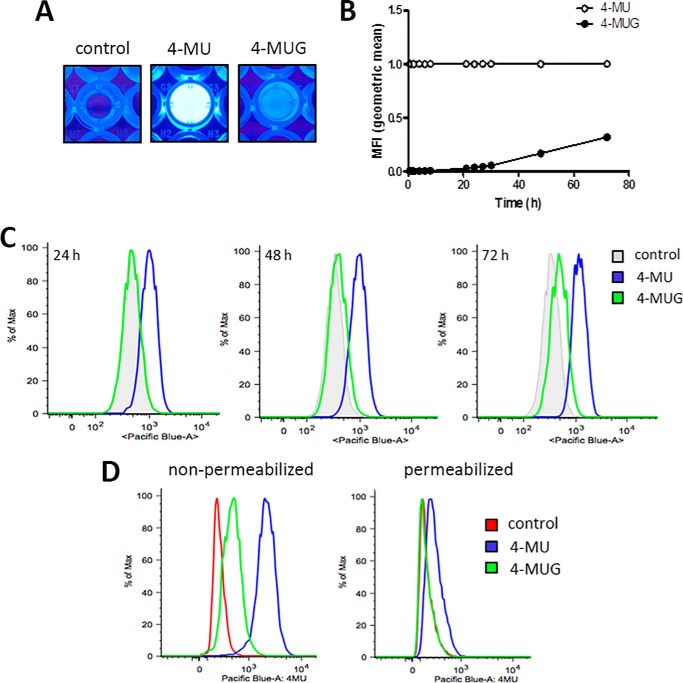
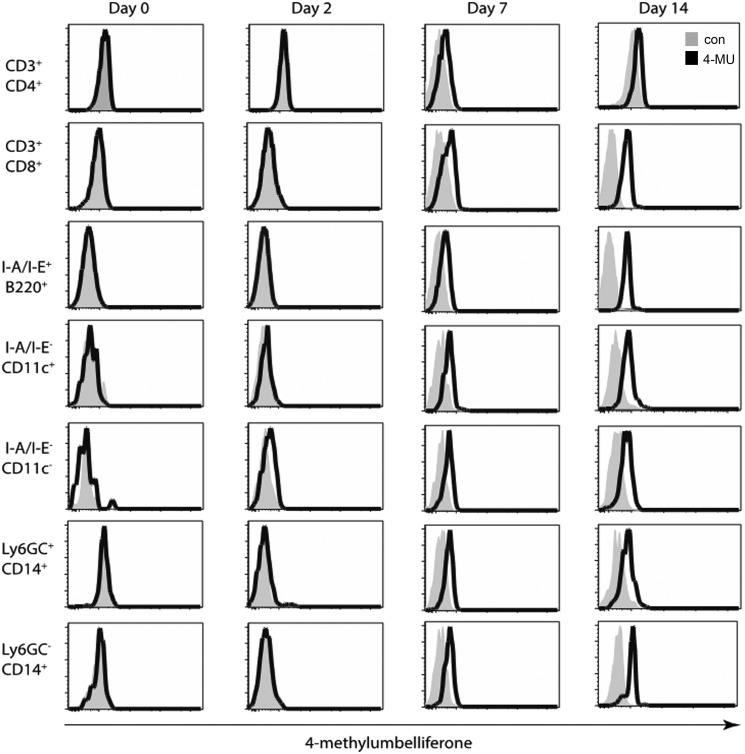
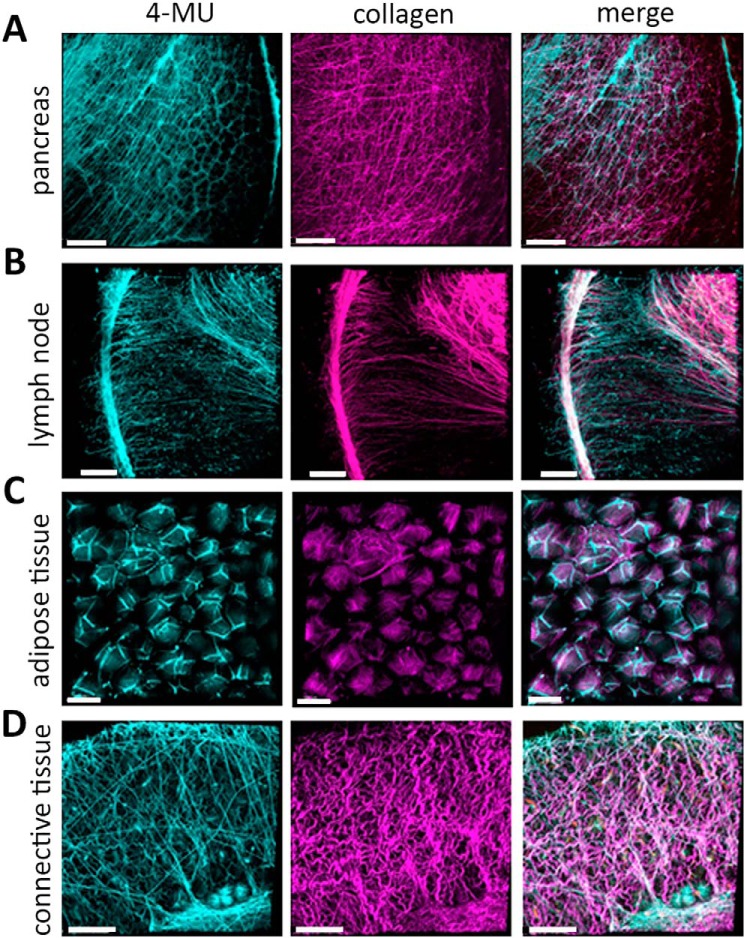
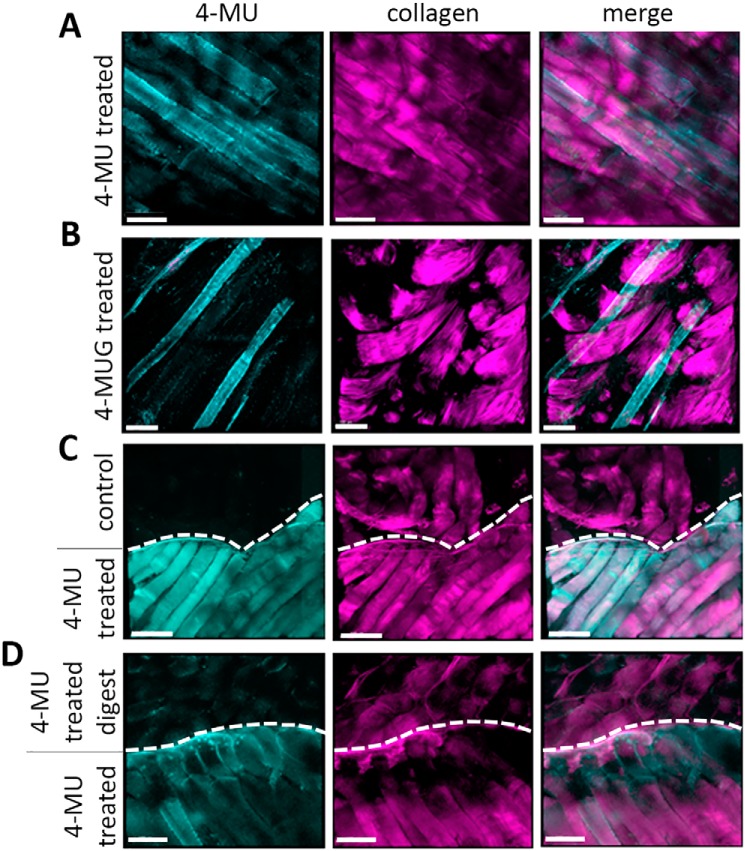
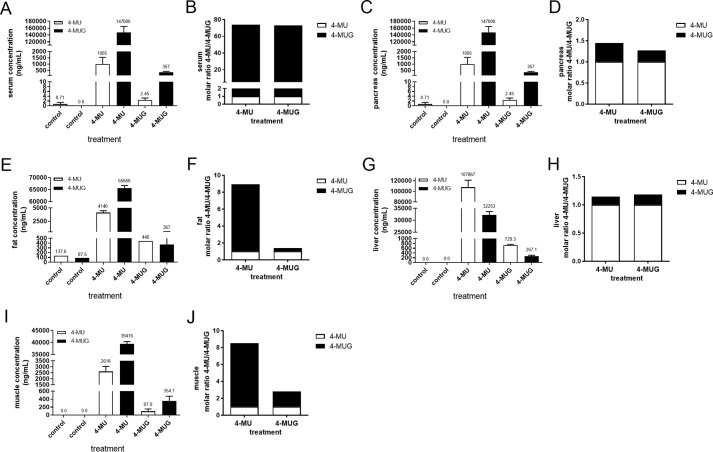
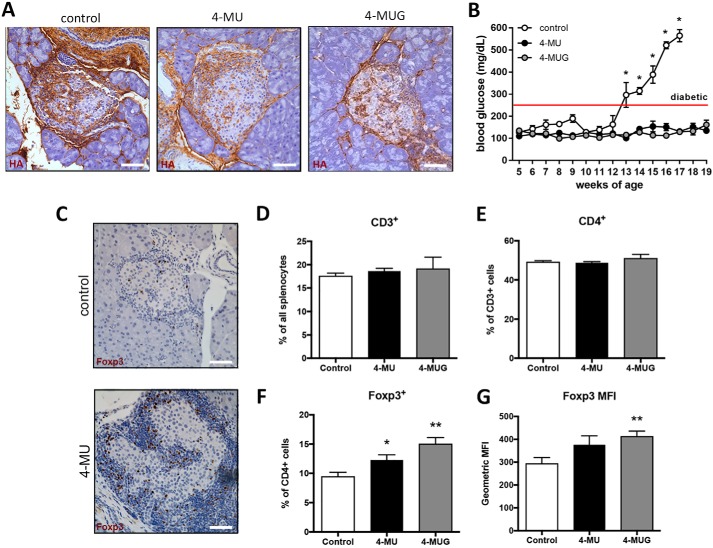
4-Methylumbelliferone (4-MU) inhibits hyaluronan (HA) synthesis and is an approved drug used for managing biliary spasm. However, rapid and efficient glucuronidation is thought to limit its utility for systemically inhibiting HA synthesis. In particular, 4-MU in mice has a short half-life, causing most of the drug to be present as the metabolite 4-methylumbelliferyl glucuronide (4-MUG), which makes it remarkable that 4-MU is effective at all. We report here that 4-MUG contributes to HA synthesis inhibition. We observed that oral administration of 4-MUG to mice inhibits HA synthesis, promotes FoxP3+ regulatory T-cell expansion, and prevents autoimmune diabetes. Mice fed either 4-MUG or 4-MU had equivalent 4-MU:4-MUG ratios in serum, liver, and pancreas, indicating that 4-MU and 4-MUG reach an equilibrium in these tissues. LC-tandem MS experiments revealed that 4-MUG is hydrolyzed to 4-MU in serum, thereby greatly increasing the effective bioavailability of 4-MU. Moreover, using intravital 2-photon microscopy, we found that 4-MUG (a nonfluorescent molecule) undergoes conversion into 4-MU (a fluorescent molecule) and that 4-MU is extensively tissue bound in the liver, fat, muscle, and pancreas of treated mice. 4-MUG also suppressed HA synthesis independently of its conversion into 4-MU and without depletion of the HA precursor UDP-glucuronic acid (GlcUA). Together, these results indicate that 4-MUG both directly and indirectly inhibits HA synthesis and that the effective bioavailability of 4-MU is higher than previously thought. These findings greatly alter the experimental and therapeutic possibilities for HA synthesis inhibition.

Keywords: 2-photon imaging; 4-methylumbelliferone; 4-methylumbelliferyl glucuronide; N-acetylglucosamine (GlcNAc); autoimmune disease; diabetes; extracellular matrix; glycosaminoglycan; hyaluronan; immunology.


Conflict of interest statement

N.N., J. R., and P. L. B. are listed as inventors of the patents-pending (PCT/US2014/050770, S17-131US/BLSU-1-65422) filed by the Board of Trustees of the Leland Stanford Junior University. The content is solely the responsibility of the authors and does not necessarily represent the official views of the National Institutes of Health

Figures

Figure 1.
Figure 1.
4-MUG, a metabolite of 4-MU, inhibits HA synthesis. A, molecular structures for 4-MU and its primary metabolites, 4-MUG and 4-MUS. B, concentrations of 4-MU and its metabolites in plasma of animals fed 4-MU chow for 2 weeks, measured via HPLC. n = 3 animals per group. C, different concentrations of 4-MU and 4-MUG in the serum of mice fed 4-MU for 2 weeks measured via HPLC. n = 3 animals per group. D and E, HA production by B16F10 cells cultured for 48 h in (D) 4-MU or (E) 4-MUG. F, representative images of HA staining in B16F10 cells cultured in DMSO as control (left), 4-MU (middle), or 4-MUG (right). Scale bar = 50 μm. Data represent mean ± S.E.; *, p < 0.05 by unpaired t test or one way analysis of variance (ANOVA) with Bonferroni post test.
Figure 2.
Figure 2.
4-MUG is converted into 4-MU in vitro. A, fluorescence visualization in wells of a 96-well plate which was filled with 200 μl PBS and 10% FCS. In some wells 4-MU (middle) and 4-MUG (right) were added; control wells remained untreated (left). B, 4-MU and 4-MUG were separately added to DMEM and their fluorescent signal over time was measured as mean fluorescent intensity (MFI). Fluorescent values of 4-MUG were normalized to the 4-MU fluorescence. C, fluorescence of 4-MU and 4-MUG from B16F10 cells incubated for 24, 48, or 72 h with 4-MU and 4-MUG examined using flow cytometry. D, fluorescence of 4-MU and 4-MUG signal from 4-MU– and 4-MUG–treated B16F10 cells pre- and post-permeabilization was examined by flow cytometry.
Figure 3.
Figure 3.
4-MU is taken up by leukocytes in vivo. Mice were treated with 4-MU. Signal on different cell subsets in the blood was analyzed by flow cytometry, as measured in the Pacific Blue channel, before and 2, 7, and 14 days after start of treatment. Bold histograms depict signal in 4-MU treated mice, tinted histograms depict background Pacific Blue signal in untreated mice.
Figure 4.
Figure 4.
4-MU tissue binding can be visualized using 2-photon microscopy. A and B, representative images of mouse lymph nodes stained for H&E (A) and HA (B). C, capsules; GC, germinal centers; IFR, interfollicular regions. Scale bar = 150 μm. C and D, mice were treated with 4-MU and the tissue distribution could be detected and visualized in the lymph node. Representative images showing 4-MU signal in blue/green and collagen signal in purple. Scale bar = 100 μm. E and F, representative images of mouse lymph nodes from 4-MU treated (E) and untreated control (F) mice, showing signal from 4-MU, T-cells, and BMDCs. Scale bar = 100 μm.
Figure 5.
Figure 5.
4-MU fluorescence can be used to show tissue distribution via 2-photon imaging. Mice were treated with 4-MU and the tissue distribution could be detected and visualized in multiple organs. A–D, representative images showing 4-MU and collagen signals in pancreas (A), lymph node (B), adipose tissue (C), and connective tissue (D). In each of those tissues 4-MU has a specific distribution as shown at 810 nm wavelength (shown in light green). Collagen was visualized at 920 nm (shown in purple), the 4-MU and collagen channel were merged for better structural orientation in the tissue. Scale bar = 100 μm.
Figure 6.
Figure 6.
4-MUG fluorescence can be detected in tissues via 2-photon imaging. A and B, representative 2-photon images of muscle tissue from 4-MU–treated mice (A) and 4-MUG–treated mice (B) show a specific signal in the 4-MU channel at a wavelength of 810 nm. C, representative 2-photon images of muscle tissue from untreated control mice (upper part) and 4-MU treated mice (lower part). D, representative 2-photon images of muscle tissue from 4-MU treated mice, where the muscle tissue from one mouse (upper part) was hyaluronidase digested. Untreated muscle tissue from a 4-MU treated mouse (lower part) serves as control. Upper and lower parts are indicated via a dashed line drawn in the picture. In each of those tissues 4-MU has a specific distribution as shown at 810 nm wavelength. Collagen was visualized at 920 nm, the 4-MU and collagen channel were merged for better structural orientation in the tissue. Scale bar = 100 μm.
Figure 7.
Figure 7.
4-MU and 4-MUG concentrations in serum and organs from 4-MU and 4-MUG treated mice. A, C, E, G, and I, 4-MU and 4-MUG concentrations were analyzed in the serum (A), pancreas (C), fat (E), liver (G), and muscle (I) from untreated control mice and 4-MU– and 4-MUG–treated mice using LC-MS/MS. n = 3–5 mice per group. B, D, F, H, and J, calculated molar ratio of 4-MU and 4-MUG from serum (B), pancreas (D), fat (F), liver (H), and muscle (J) in the different treatment groups. Data represent mean ± S.E.
Figure 8.
Figure 8.
4-MU and 4-MUG treatment prevents progression in autoimmune diabetes and increases Treg numbers. A, representative HA staining of pancreatic tissue from untreated DORmO mice (control), DORmO mice fed 4-MU, and DORmO mice fed 4-MUG, at 12 weeks of age. B, blood glucose of untreated DORmO mice, and DORmO mice fed 4-MU and 4-MUG, beginning at 5 weeks of age, and maintained on 4-MU and 4-MUG for 15 weeks. n = 5–10 mice per group. Data represent mean ± S.E. C, representative FoxP3 staining (brown) of pancreatic islet tissue from untreated (control) and 4-MU treated DORmO mice. Original magnification, ×40. D–G, numbers of CD3+ cells, CD4+ among CD3+ cells, and Foxp3+ among CD3+/CD4+ cells, in splenocytes isolated from mice that were treated with 4-MU (0.5 mg i.p.) or 4-MUG (1 mg i.p.) daily for 14 days, as analyzed by flow cytometry. Scale bar = 20 μm. *, p < 0.05; **, p <0.01 by unpaired t test with Welch's correction. Data represent mean ± S.E.

References

    1. Fraser J. R., Laurent T. C., and Laurent U. B. (1997) Hyaluronan: Its nature, distribution, functions and turnover. J. Intern. Med. 242, 27–33 10.1046/j.1365-2796.1997.00170.x - DOI - PubMed
    1. Jiang D., Liang J., and Noble P. W. (2011) Hyaluronan as an immune regulator in human diseases. Physiol. Rev. 91, 221–264 10.1152/physrev.00052.2009 - DOI - PMC - PubMed
    1. Termeer C., Sleeman J. P., and Simon J. C. (2003) Hyaluronan—magic glue for the regulation of the immune response? Trends Immunol. 24, 112–114 10.1016/S1471-4906(03)00029-2 - DOI - PubMed
    1. Weigel P. H., and DeAngelis P. L. (2007) Hyaluronan synthases: A decade-plus of novel glycotransferases. J. Biol. Chem. 282, 36777–36781 10.1074/jbc.R700036200 - DOI - PubMed
    1. Termeer C., Benedix F., Sleeman J., Fieber C., Voith U., Ahrens T., Miyake K., Freudenberg M., Galanos C., and Simon J. C. (2002) Oligosaccharides of hyaluronan activate dendritic cells via toll-like receptor 4. J. Exp. Med. 195, 99–111 10.1084/jem.20001858 - DOI - PMC - PubMed

Publication types

MeSH terms