. 2019 Mar 26;10(1):1018.
doi: 10.1038/s41467-019-08974-9.

Widespread losses of pollinating insects in Britain

Affiliations

Widespread losses of pollinating insects in Britain

Gary D Powney et al. Nat Commun. .

Abstract

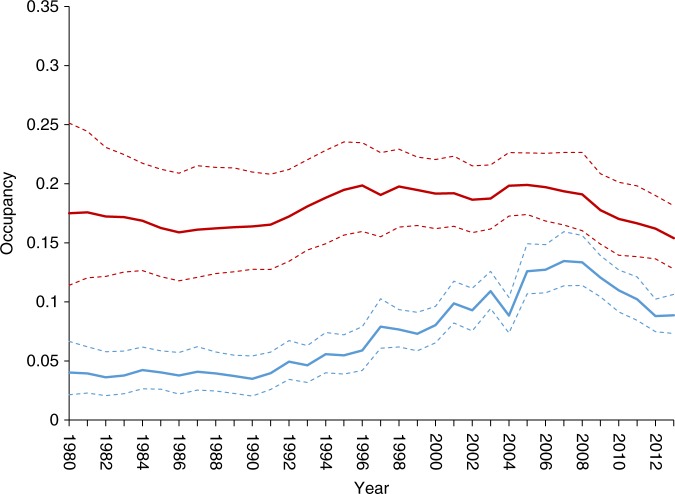
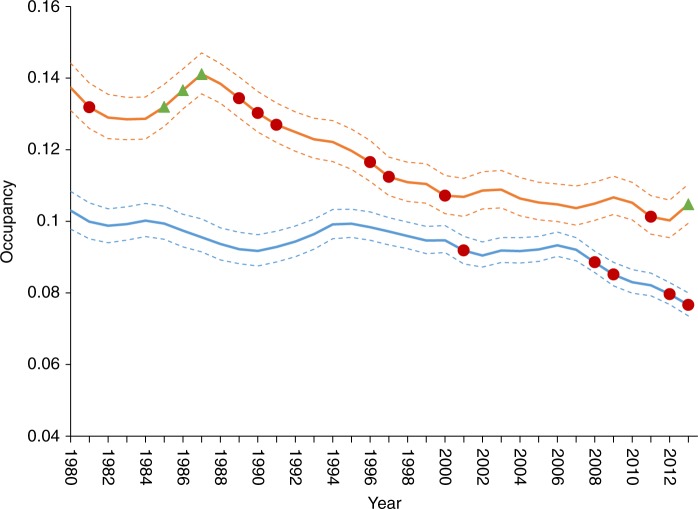
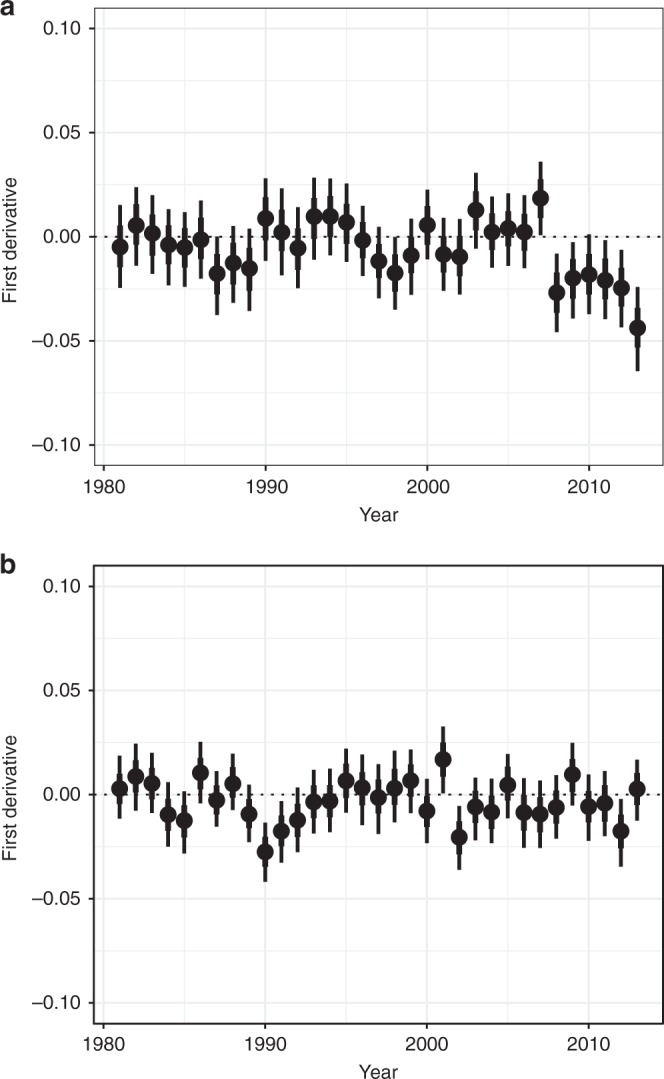
Pollination is a critical ecosystem service underpinning the productivity of agricultural systems across the world. Wild insect populations provide a substantial contribution to the productivity of many crops and seed set of wild flowers. However, large-scale evidence on species-specific trends among wild pollinators are lacking. Here we show substantial inter-specific variation in pollinator trends, based on occupancy models for 353 wild bee and hoverfly species in Great Britain between 1980 and 2013. Furthermore, we estimate a net loss of over 2.7 million occupied 1 km2 grid cells across all species. Declines in pollinator evenness suggest that losses were concentrated in rare species. In addition, losses linked to specific habitats were identified, with a 55% decline among species associated with uplands. This contrasts with dominant crop pollinators, which increased by 12%, potentially in response agri-environment measures. The general declines highlight a fundamental deterioration in both wider biodiversity and non-crop pollination services.


Conflict of interest statement

The authors declare no competing interests.

Figures

Fig. 1
Fig. 1
Trends of two example bee species illustrate contrasting patterns of change among species. Time series for Bombus humilis (blue) and Colletes succinctus (red) show the mean (solid line) and limits of the 95% credible intervals (dashed lines) of the posterior distribution of annual occupancy estimates
Fig. 2
Fig. 2
Contrasting patterns of change among major groups of pollinating insects. Trend lines show average occupancy of 1 km grid cells in Britain across all modelled bee (n = 139, blue) and hoverfly (n = 214, orange) species. Uncertainty is represented by the 95% credible intervals (delimited by dashed lines). Red circles and green triangles highlight years with notable decreases or increases, respectively. Notable years were defined as those where the upper (decreasing) or lower (increasing) 95% credible interval for the first derivative of occupancy did not span zero (see Supplementary Figure 2)
Fig. 3
Fig. 3
Annual estimates of change in assemblage evenness (first derivative of evenness). a Bee and b hoverfly assemblages. Points represent the median estimate of the posterior, with uncertainty presented as the limits of the credible intervals (thin = 95% CI, thick = 80% CI)

References

    1. Ollerton J, Winfree R, Tarrant S. How many flowering plants are pollinated by animals? Oikos. 2011;120:321–326. doi: 10.1111/j.1600-0706.2010.18644.x. - DOI
    1. Potts SG, et al. Global pollinator declines: trends, impacts and drivers. Trends Ecol. Evol. 2010;25:345–353. doi: 10.1016/j.tree.2010.01.007. - DOI - PubMed
    1. Goulson D, Nicholls E, Botías C, Rotheray EL. Bee declines driven by combined stress from parasites, pesticides, and lack of flowers. Science. 2015;347:1255957. doi: 10.1126/science.1255957. - DOI - PubMed
    1. Garratt MPD, et al. Pollination deficits in UK apple orchards. J. Pollinat. Ecol. 2014;12:9–14.
    1. Ollerton J, Edwards M, Crockett R. Extinctions of aculeate pollinators in Britain and the role of large-scale agricultural changes. Science. 2014;346:1360–1362. doi: 10.1126/science.1257259. - DOI - PubMed

Publication types