. 2019 Mar 26;9(1):5155.
doi: 10.1038/s41598-018-37888-7.

Suboptimal human multisensory cue combination

Affiliations

Suboptimal human multisensory cue combination

Derek H Arnold et al. Sci Rep. .

Abstract

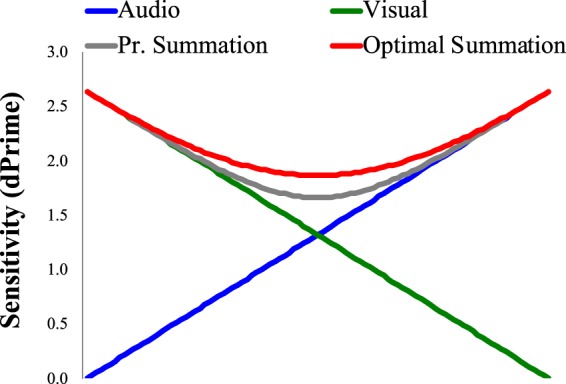
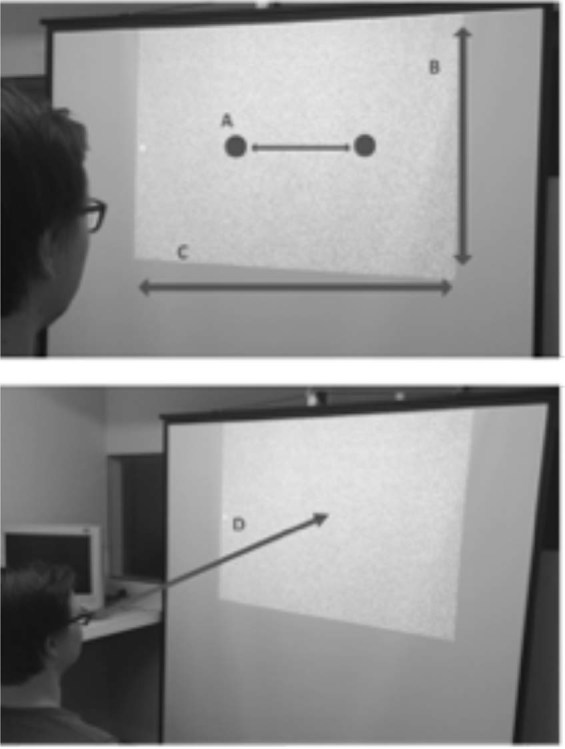
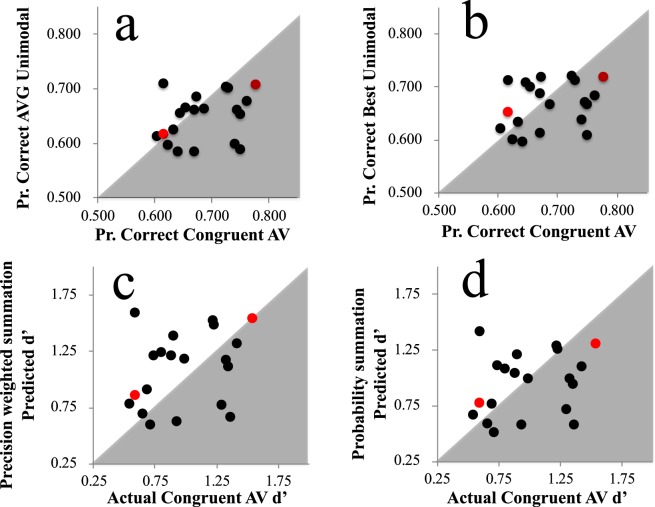
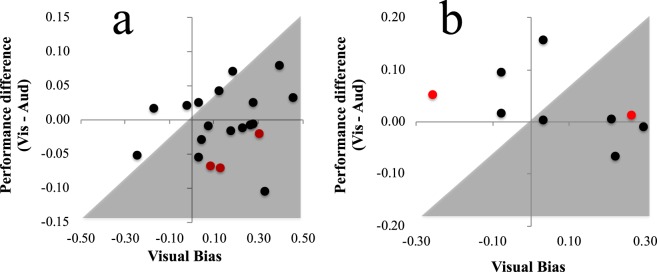
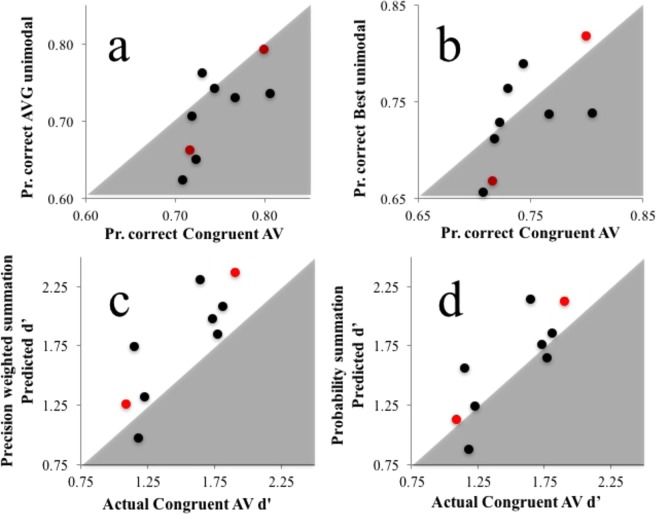
Information from different sensory modalities can interact, shaping what we think we have seen, heard, or otherwise perceived. Such interactions can enhance the precision of perceptual decisions, relative to those based on information from a single sensory modality. Several computational processes could account for such improvements. Slight improvements could arise if decisions are based on multiple independent sensory estimates, as opposed to just one. Still greater improvements could arise if initially independent estimates are summed to form a single integrated code. This hypothetical process has often been described as optimal when it results in bimodal performance consistent with a summation of unimodal estimates weighted in proportion to the precision of each initially independent sensory code. Here we examine cross-modal cue combination for audio-visual temporal rate and spatial location cues. While suggestive of a cross-modal encoding advantage, the degree of facilitation falls short of that predicted by a precision weighted summation process. These data accord with other published observations, and suggest that precision weighted combination is not a general property of human cross-modal perception.


Conflict of interest statement

The authors declare no competing interests.

Figures

Figure 1
Figure 1
Plots of inversely varying simulated audio (blue) and visual (red) sensitivity scores, in addition to sensitivity scores predicted by weighted summations of unimodal signals (red) and via probability summations (grey). Note that the largest difference, between unimodal sensitivities and predicted bimodal sensitivities, occurs when unimodal sensitivities are precisely matched.
Figure 2
Figure 2
Graphics depicting the visual display for Experiment 1. (A) Position of speakers, mounted to the rear of the display, used to present audio stimuli, (B) Height of display area (86 cm), (C) Width of display area (112 cm) (D) Viewing distance (137 cm).
Figure 3
Figure 3
(a) X/Y scatterplot of individual proportion correct task performance scores on Congruent audiovisual trials (X axis) and averaged across unimodal visual and auditory trials (Y axis). (b) As for (a), but for the best of each individuals’ unimodal condition performance (Y axis). (c) X/Y scatterplot of individual d’ scores for Congruent audiovisual trials (X axis) and d’ scores predicted by precision weighted summation, from performances on unimodal trials. (d) As for (c), but for d’ scores predicted by probability summation. In all plots author data points are coloured red. Data points in grey regions of (a,b) indicate better performance on Congruent AV trials, relative to the other dataset. Data points in white regions in (c,d) indicate worse performance on congruent AV trials than predicted.
Figure 4
Figure 4
(a) X/Y scatterplot of individual visual bias scores (X axis) and proportional differences in correct performances on unimodal visual and audio trials (Y axis) from Experiment 1. Data points falling within the grey region are indicative of a greater visual bias than is justified by differences in unimodal trial performances. (b) Details are as for (a) but data are from Experiment 2.
Figure 5
Figure 5
Data from Experiment 2. (a) X/Y scatterplot of individual proportion correct task performance scores on Congruent AV trials (X axis) and proportion correct scores averaged across each individuals’ unimodal visual and auditory trials (Y axis). (b) As for (a) but for the best of each individuals’ two types of unimodal trials (Y axis). (c) (c) X/Y scatterplot of individual d’ scores for Congruent AV trials (X axis) and d’ scores predicted by a precision weighted summation, from performances on unimodal trials. (d) As for (c), but for d’ scores predicted by probability summation. In all plots author data points are coloured red. Data points in grey regions of (a,b) indicate better performance on Congruent AV trials, relative to the other dataset. Data points in white regions in (c,d) indicate worse performance on congruent AV trials than predicted.

References

    1. Slutsky DA, Recanzone GH. Temporal and spatial dependency of the ventriloquism effect. NeuroReport. 2001;12(1):7–10. doi: 10.1097/00001756-200101220-00009. - DOI - PubMed
    1. Vroomen J, de Gelder B. Temporal ventriloquism: Sound modulates the flash-lag effect. Journal of Experimental Psychology: Human Perception and Performance. 2004;30(3):513–518. - PubMed
    1. Welch RB, Warren DH. Immediate perceptual response to intersensory discrepancy. Psychological Bulletin. 1980;88(3):638–667. doi: 10.1037/0033-2909.88.3.638. - DOI - PubMed
    1. Alais D, Burr D. The Ventriloquist effect results from near optimal bimodal integration. Current Biology. 2004;14:257–262. doi: 10.1016/j.cub.2004.01.029. - DOI - PubMed
    1. Ernst MO, Banks MS. Humans integrate visual and haptic information in a statistically optimal fashion. Nature. 2002;415:429–433. doi: 10.1038/415429a. - DOI - PubMed

Publication types