. 2019 Mar 26;9(1):5141.
doi: 10.1038/s41598-019-41672-6.

Utilization of NGS technologies to investigate transcriptomic and epigenomic mechanisms in trastuzumab resistance

Affiliations

Utilization of NGS technologies to investigate transcriptomic and epigenomic mechanisms in trastuzumab resistance

Miguel Nava et al. Sci Rep. .

Abstract

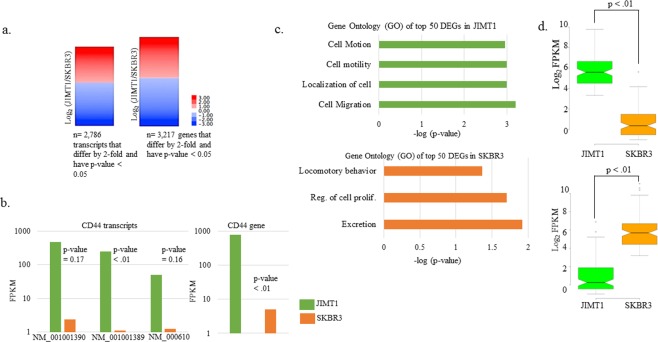
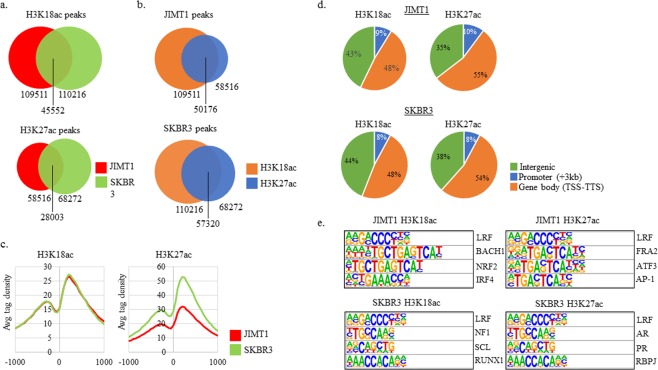
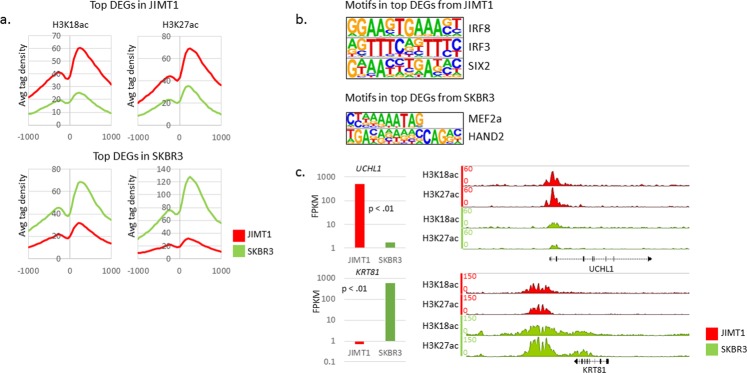
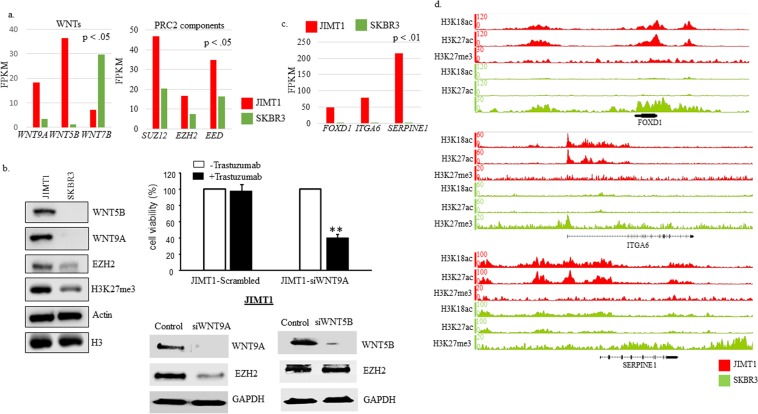
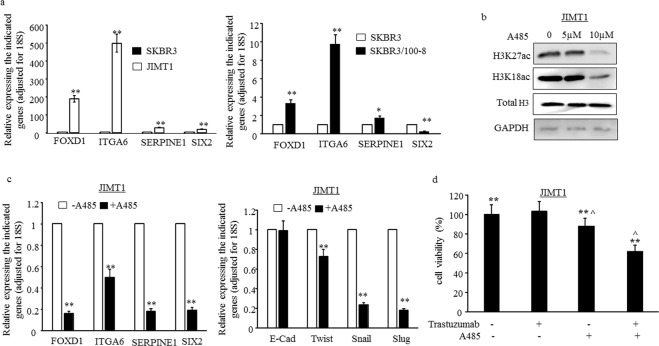
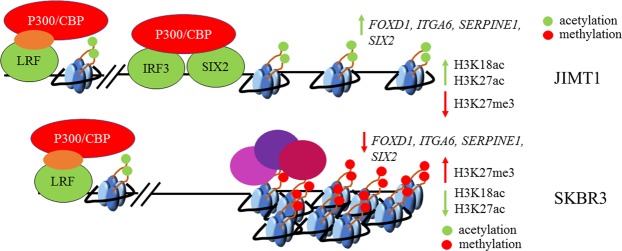
NGS (Next Generation Sequencing) technologies allows us to determine key gene expression signatures that correlate with resistance (and responsiveness) to anti-cancer therapeutics. We have undertaken a transcriptomic and chromatin immunoprecipitation followed by sequencing (ChIP-seq) approach to describe differences in gene expression and the underlying chromatin landscape between two representative HER2+ cell lines, one of which is sensitive (SKBR3) and the other which is resistant (JIMT1) to trastuzumab. We identified differentially expressed genes (DEGs) and differentially expressed transcripts (DETs) between SKBR3 and JIMT1 cells. Several of the DEGs are components of the Polycomb Repressing Complex 2 (PRC2), and they are expressed higher in JIMT1 cells. In addition, we utilized ChIP-seq to identify H3K18ac, H3K27ac and H3K27me3 histone modifications genome-wide. We identified key differences of H3K18ac and H3K27ac enrichment in regulatory regions, found a correlation between these modifications and differential gene expression and identified a transcription factor binding motif for LRF near these modifications in both cell lines. Lastly, we found a small subset of genes that contain repressive H3K27me3 marks near the gene body in SKBR3 cells but are absent in JIMT1. Taken together, our data suggests that differential gene expression and trastuzumab responsiveness in JIMT1 and SKBR3 is determined by epigenetic mechanisms.


Conflict of interest statement

The authors declare no competing interests.

Figures

Figure 1
Figure 1
RNA-seq results and Gene Ontology (GO) in top DEGs. (a) DETs and DEGs log2 ratios of (Fragments Per Kilobase of transcript per Million mapped reads) FPKMs (JIMT1/SKBR3) meeting indicated criteria. Statistical testing was conducted by Cufflinks. (b) Three CD44 DETs that were DE at least 2-fold in JIMT1 relative to SKBR3 cells and their associated p-values as reported by Cufflinks for replicates. CD44 DE in JIMT1 and SKBR3 cells. (c) Gene ontology (GO) terms for top DE genes determined by DAVID. Only p-values (as reported by DAVID) less than 0.05 are shown. (d) Two-tailed t-test of top-50 genes shown in (c) for each cell line.
Figure 2
Figure 2
H3K18ac and H3K27ac ChIP-seq and transcription factor binding sites (TFBS) near H3K18ac and H3K27ac. (a) Total H3K18ac and H3K27ac peaks in each condition and overlapping peaks between cell lines. (b) Comparison of H3K18ac and H3K27ac peaks within the same cell line. (c) H3K18ac and H3K27ac peaks at all TSS from −1000 to 1000 as reported by CEAS. (d) Locations of H3K18ac and H3K27ac peaks when broken down into three bins: intergenic, promoter (−3kb to TSS) and gene body (TSS to TTS). (e) Transcription factor binding sites (TFBS) query results as indicated by HOMER search. All motifs shown were enriched at p-value < 0.01 as reported by HOMER.
Figure 3
Figure 3
H3K18ac, H3K27ac and TFBS at DEGs. (a) H3K18ac and H3K27ac at top-50 DEGs in JIMT1 (top) and SKBR3 (bottom) as reported by CEAS. (b) TFBS query results as indicated by HOMER search. All motifs shown were enriched at p-value < 0.01 as reported by HOMER. (c) FPKM expression data juxtaposed to IGB ChIP H3K18ac and H3K27ac locus containing gene of interest. UCHL1 is the top DEG in JIMT1. KRT81 is the top DEG in SKBR3.
Figure 4
Figure 4
WNTs, PRC2 components, and H3K27me3 enrichment in SKBR3 cells. (a) FPKM data for WNTs and PRC2 components in JIMT1 and SKBR3 cells. P-value reported is from Cufflinks output data. (b-right) Western blot data comparing whole cell lysates from JIMT1 and SKBR3 cells (n = 2). Western blots utilized same lysates and same gels in most cases, unless samples were overloaded in which case they were rerun with less protein (see Supplementary Fig. 7 for more complete images); (b-left top) JIMT1 cells were plated in 96 well plate at 5000 cells/per well and treated with scrambled RNA or siRNA WNT9A for 72 hours. Trastuzumab was added after 24 hours siRNA treatment for 3 days. MTT assay was used for evaluated cell growth. Each data point was 6 measurements and the graph showed mean of 6 measurements plus standard deviation, **p < 0.01 compared to untreated cells; (b-right bottom). JIMT1 cells were treated with pooled of two siRNA-sequences against WNT9A (siWNT9A), WNT5B (siWNT5B) or negative sequences (control) for 72 hours and total protein was extracted followed by Western Blot with antibody against WNT9A, WNT5B and EZH2. GAPDH was used as loading control. (c) FPKM data for top DEGs in JIMT1, FOXD1, ITGA6, and SERPINE1, in JIMT1 and SKBR3 cells. P-value reported is from Cufflinks output data. (d) IGB screenshots for genes contained in (c) containing tracks for H3K18ac, H3K27ac and H3K27me3.
Figure 5
Figure 5
Inhibition of P300/CBP acetylase activity reduces EMT and enhances inhibitory effectiveness of trastuzumab. (a) mRNA levels of FOXD1, ITGA6, SERPINE1 and SIX2 were examined by RT-qPCR. The bars indicated mean of three values plus stander deviation. The levels of each indicated genes in SKBR3 were used as references and all levels were adjusted for 18S, *p < 0.05 and **p < 0.01 compared to the levels in SKBR3. (b) JIMT1 cells were treated with A-485 for 24 hours and Western blot data comparing whole cell lysates from the A-485 treated and no-treated cells. Antibodies for H3K27ac, H3K18ac, total H3 and GAPDH were used for detecting effect of A-485 in protein levels of H3K27ac and H3K18ac. Total H3 and GAPDH were used as loading control. (c) JIMT1 cells were treated with 10 µ of A-485 for 24 hours and mRNA levels of the indicated genes were determined by RT-qPCR. The bars indicated mean of three values plus stander deviation. The levels of each indicated genes in untreated cells were used as references and all levels were adjusted for 18S. **p < 0.01 compared to untreated cells. (d) JIMT1 cells were plated in 96 well plate at 5000 cells/per well and treated with (1) 10 µ of A-485, (2) 40 µg trastuzumab, (3) A-485+ trastuzumab, (4) untreated (control) for 72 hours. MTT assay was used for evaluated cell viability. Each data point was 6 measurements and the graph showed mean of 6 measurements plus standard deviation, **p < 0.01 compared to untreated cells.
Figure 6
Figure 6
Regulation of gene expression in JIMT1 and SKBR3 cells. IRF/SIX2 motifs were enriched in top-DEGs in JIMT1. These genes contained high levels of H3K18ac and H3K27ac. JIMT1 cells contained low levels of H3K27me3 at these genes. SKBR3 cells contained low levels of H3K18ac and H3K27ac at the same genes. SKBR3 cells contained high levels of H3K27me3 at these genes.

References

    1. Chung A, Cui X, Audeh W, Giuliano A. Current status of anti-human epidermal growth factor receptor 2 therapies: predicting and overcoming herceptin resistance. Clin Breast Cancer. 2013;13:223–232. doi: 10.1016/j.clbc.2013.04.001. - DOI - PMC - PubMed
    1. Haque R, et al. Impact of breast cancer subtypes and treatment on survival: An analysis spanning two decades. Cancer Epidemiol. Biomarkers Prev. 2012;21:1848–1855. doi: 10.1158/1055-9965.EPI-12-0474. - DOI - PMC - PubMed
    1. Vici P, et al. Outcomes of HER2-positive early breast cancer patients in the pre-trastuzumab and trastuzumab eras: a real-world multicenter observational analysis. The RETROHER study. Breast Cancer Res. Treat. 2014;147:599–607. doi: 10.1007/s10549-014-3133-1. - DOI - PMC - PubMed
    1. Brennan PJ, Kumogai T, Berezov A, Murali R, Greene MI. HER2/neu: Mechanisms of dimerization/oligomerization. Oncogene. 2000;19:6093–6101. doi: 10.1038/sj.onc.1203967. - DOI - PubMed
    1. Rubin I, Yarden Y. The basic biology of HER2. Ann. Oncol. 2001;12:3–8. doi: 10.1023/A:1011195320446. - DOI - PubMed

Publication types

MeSH terms