. 2019 Mar 12:10:429.
doi: 10.3389/fmicb.2019.00429. eCollection 2019.

Comparative Description of the Expression Profile of Interferon-Stimulated Genes in Multiple Cell Lineages Targeted by HIV-1 Infection

Affiliations

Comparative Description of the Expression Profile of Interferon-Stimulated Genes in Multiple Cell Lineages Targeted by HIV-1 Infection

Hirofumi Aso et al. Front Microbiol. .

Abstract

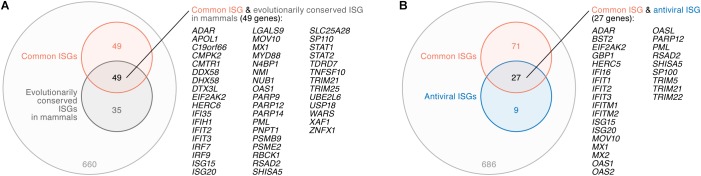
Immediately after viral infections, innate immune sensors recognize viruses and lead to the production of type I interferon (IFN-I). IFN-I upregulates various genes, referred to as IFN-stimulated genes (ISGs), and some ISGs inhibit viral replication. HIV-1, the causative agent of AIDS, mainly infects CD4+ T cells and macrophages and triggers the IFN-I-mediated signaling cascade. Certain ISGs are subsequently upregulated by IFN-I stimulus and potently suppress HIV-1 replication. HIV-1 cell biology has shed light on the molecular understanding of the IFN-I production triggered by HIV-1 infection and the antiviral roles of ISGs. However, the differences in the gene expression patterns following IFN-I stimulus among HIV-1 target cell types are poorly understood. In this study, we hypothesize that the expression profiles of ISGs are different among HIV-1 target cells and address this question by utilizing public transcriptome datasets and bioinformatic techniques. We focus on three cell types intrinsically targeted by HIV-1, including CD4+ T cells, monocytes, and macrophages, and comprehensively compare the expression patterns of ISGs among these cell types. Furthermore, we use the datasets of the differentially expressed genes by HIV-1 infection and the evolutionarily conserved ISGs in mammals and perform comparative transcriptome analyses. We defined 104 'common ISGs' that were upregulated by IFN-I stimulus in CD4+ T cells, monocytes, and macrophages. The ISG expression patterns were different among these three cell types, and intriguingly, both the numbers and the magnitudes of upregulated ISGs by IFN-I stimulus were greatest in macrophages. We also found that the upregulated genes by HIV-1 infection included most 'common ISGs.' Moreover, we determined that the 'common ISGs,' particularly those with antiviral activity, were evolutionarily conserved in mammals. To our knowledge, this study is the first investigation to comprehensively describe (i) the different expression patterns of ISGs among HIV-1 target cells, (ii) the overlap in the genes modulated by IFN-I stimulus and HIV-1 infection and (iii) the evolutionary conservation in mammals of the antiviral ISGs that are expressed in HIV-1 target cells. Our results will be useful for deeply understanding the relationship of the effect of IFN-I and the modulated gene expression by HIV-1 infection.

Keywords: HIV-1; bioinformatics; evolution; interferon-stimulated gene; transcriptomics; type I interferon.


Figures

FIGURE 1
FIGURE 1
ISGs in CD4+ T cells, monocytes, and MDMs. (A) A heatmap of the ISGs in CD4+ T cells (seven datasets), monocytes (four datasets), and MDMs (three datasets). Color shows the fold change values of genes, and the up- and downregulated genes are indicated in red and blue, respectively. The 14 datasets used in this analysis are summarized in Table 1, and the total 1,495 ISGs are listed in Supplementary Table S5. A binary (black or white) heatmap denotes the DEGs detected in this study. (B) Principal component analysis of the transcriptome data based on the induction levels of ISGs upon IFN-I stimulus. PC, principal component. The result from a respective dataset is indicated by a dot. (C) The number of ISGs. Each number on the bar graph indicates the gene number.
FIGURE 2
FIGURE 2
Classification of ISGs based on cell type/lineage specificity. (A) A heatmap of ‘common ISGs’ and cell type/lineage-specific ISGs. Color shows the fold change values of genes, and the up- and downregulated genes are indicated in red and blue, respectively. Representative 20 common ISGs and eight myeloid-specific ISGs are indicated above and below the heatmap. The total 772 ISGs and 104 ‘common ISGs’ are indicated in Supplementary Table S5. A binary (black or white) heatmap denotes the ISGs detected in the indicated cell category. (B) A Venn diagram of the ISGs in the three cell types. (C) Induction level of the 104 ‘common ISG’ expression following IFN-I treatment in the three cell types. Each dot indicates the fold change value of an ISG expression following IFN-I treatment. Horizontal lines indicate the quantiles. Asterisks indicate P < 0.005 by Welch’s t-test. Also refer to Supplementary Figure S3.
FIGURE 3
FIGURE 3
DEGs following HIV-1 infection in CD4+ T cells. (A) A heatmap of the DEGs following HIV-1 infection in CD4+ T cells (four datasets). Color shows the fold change values of genes, and the up- and downregulated genes are indicated in red and blue, respectively. A binary (red or blue) heatmap denotes the up- and down-regulated DEGs detected in the dataset of the HIV-1 infected CD4+ T cells. The four datasets used in this analysis are summarized in Table 2, and the 826 upregulated and 810 downregulated genes are, respectively, listed in Supplementary Table S6. (B) A Venn diagram of the 104 ‘common’ ISGs defined in this study (Figure 2B) and the DEGs by HIV-1 infection. (C) A heatmap showing the degree of the overlap of genes between DEGs following HIV-1 infection and each category of ISGs (Figure 2). Color shows the odds ratio of the overlap between the two gene sets. (D) A heatmap showing the anti-HIV-1 activity of ISGs. Upper panel shows the anti-HIV-1 activity measured by the previous study (Kane et al., 2016). “MT-4 incoming” and “THP-1 incoming” indicate the degree of the inhibition of HIV-1 infection at the early step of retroviral life cycle in each cell type, respectively. “HEK293T production” indicates the degree of the inhibition of HIV-1 production in HEK293T cells. The genes that suppressed viral infectivity/yield at the level of <50% compared to the mock-transfected cells in ≥1 dataset are shown. Lower panel shows the annotation of the genes according to our classifications of ISGs and the DEGs following HIV-1 infection.
FIGURE 4
FIGURE 4
Relationship between ‘common ISGs’ and ‘evolutionary core ISGs in mammals.’ (A) A Venn diagram of ‘common ISGs’ and ‘evolutionary core ISGs in mammals.’ (B) A Venn diagram of ‘common ISGs’ and antiviral ISGs. Both ‘evolutionary core ISGs in mammals’ (A) and antiviral ISGs (B) were defined in a previous paper (Shaw et al., 2017). The universal set of panels (A,B) is the 793 ISGs (refer to text). The genes overlapped in both groups are listed on the right of the respective Venn diagrams.

References

    1. Abudu A., Wang X., Dang Y., Zhou T., Xiang S. H., Zheng Y. H. (2012). Identification of molecular determinants from Moloney leukemia virus 10 homolog (MOV10) protein for virion packaging and anti-HIV-1 activity. J. Biol. Chem. 287 1220–1228. 10.1074/jbc.M111.309831 - DOI - PMC - PubMed
    1. Akira S., Uematsu S., Takeuchi O. (2006). Pathogen recognition and innate immunity. Cell 124 783–801. 10.1016/j.cell.2006.02.015 - DOI - PubMed
    1. Balachandran S., Roberts P. C., Brown L. E., Truong H., Pattnaik A. K., Archer D. R., et al. (2000). Essential role for the dsRNA-dependent protein kinase PKR in innate immunity to viral infection. Immunity 13 129–141. 10.1016/S1074-7613(00)00014-5 - DOI - PubMed
    1. Barral P. M., Sarkar D., Su Z. Z., Barber G. N., Desalle R., Racaniello V. R., et al. (2009). Functions of the cytoplasmic RNA sensors RIG-I and MDA-5: key regulators of innate immunity. Pharmacol. Ther. 124 219–234. 10.1016/j.pharmthera.2009.06.012 - DOI - PMC - PubMed
    1. Benjamini Y., Hochberg Y. (1995). Controlling the false discovery rate: a practical and powerful approach to multiple testing. J. R. Stat. Soc. Ser. B 57 289–300. 10.1111/j.2517-6161.1995.tb02031.x - DOI