

Dissection of two quantitative trait loci with pleiotropic effects on plant height and spike length linked in coupling phase on the short arm of chromosome 2D of common wheat (Triticum aestivum L.)
- PMID: 30915484
- PMCID: PMC6531420
- DOI: 10.1007/s00122-019-03318-z
Dissection of two quantitative trait loci with pleiotropic effects on plant height and spike length linked in coupling phase on the short arm of chromosome 2D of common wheat (Triticum aestivum L.)
Erratum in
-
Correction to: Dissection of two quantitative trait loci with pleiotropic effects on plant height and spike length linked in coupling phase on the short arm of chromosome 2D of common wheat (Triticum aestivum L.).Theor Appl Genet. 2019 Nov;132(11):3225. doi: 10.1007/s00122-019-03421-1. Theor Appl Genet. 2019. PMID: 31552443 Free PMC article.
-
Correction to: Dissection of two quantitative trait loci with pleiotropic effects on plant height and spike length linked in coupling phase on the short arm of chromosome 2D of common wheat (Triticum aestivum L.).Theor Appl Genet. 2019 Nov;132(11):3223. doi: 10.1007/s00122-019-03420-2. Theor Appl Genet. 2019. PMID: 34410447 No abstract available.
Abstract
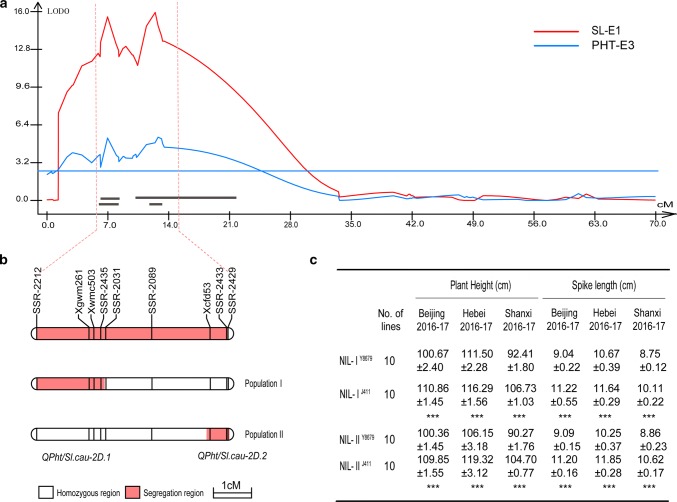
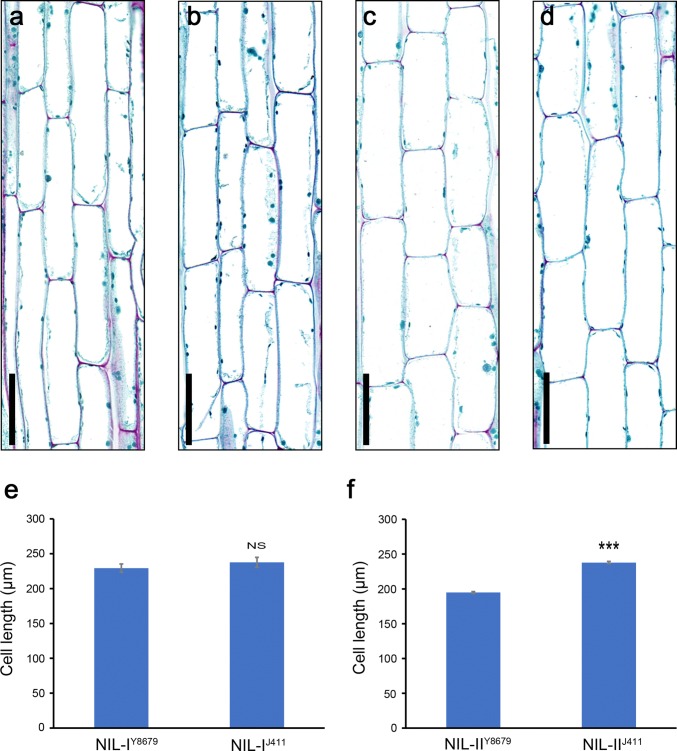
Two QTL with pleiotropic effects on plant height and spike length linked in coupling phase on chromosome 2DS were dissected, and diagnostic marker for each QTL was developed. Plant height (PHT) is a crucial trait related to plant architecture and yield potential, and dissection of its underlying genetic basis would help to improve the efficiency of designed breeding in wheat. Here, two quantitative trait loci (QTL) linked in coupling phase on the short arm of chromosome 2D with pleiotropic effects on PHT and spike length, QPht/Sl.cau-2D.1 and QPht/Sl.cau-2D.2, were separated and characterized. QPht/Sl.cau-2D.1 is a novel QTL located between SNP makers BS00022234_51 and BobWhite_rep_c63957_1472. QPht/Sl.cau-2D.2 is mapped between two SSR markers, SSR-2062 and Xgwm484, which are located on the same genomic interval as Rht8. Moreover, the diagnostic marker tightly linked with each QTL was developed for the haplotype analysis using diverse panels of wheat accessions. The frequency of the height-reduced allele of QPht/Sl.cau-2D.1 is much lower than that of QPht/Sl.cau-2D.2, suggesting that this novel QTL may be an attractive target for genetic improvement. Consistent with a previous study of Rht8, a significant difference in cell length was observed between the NILs of QPht/Sl.cau-2D.2. By contrast, there was no difference in cell length between NILs of QPht/Sl.cau-2D.1, indicating that the underlying molecular mechanism for these two QTL may be different. Collectively, these data provide a new example of QTL dissection, and the developed diagnostic markers will be useful in marker-assisted pyramiding of QPht/Sl.cau-2D.1 and/or QPht/Sl.cau-2D.2 with the other genes in wheat breeding.
Conflict of interest statement
The authors declare that they have no conflict of interest.
Figures


References
-
- Ahmad M, Sorrells ME. Distribution of microsatellite alleles linked to Rht8 dwarfing gene in wheat. Euphytica. 2002;123:235e–240e. doi: 10.1023/A:1014962016967. - DOI
-
- Akman H, Bruckner P. Marker assisted selection for Rht8 and Rht-D1b dwarfing genes in winter wheat breeding program. New Biotechnol. 2012;29:S139e. doi: 10.1016/j.nbt.2012.08.389. - DOI
-
- Bai GH, Das MK, Carver BF, Xu XY, Krenzer EG. Covariation for microsatellite marker alleles associated with Rht8 and coleoptile length in winter wheat. Crop Sci. 2004;44:1187e–1194e. doi: 10.2135/cropsci2004.1187. - DOI
MeSH terms
Substances
Grants and funding
LinkOut - more resources
Full Text Sources
Other Literature Sources
