. 2019 May 21;47(9):4638-4651.
doi: 10.1093/nar/gkz187.

Transcriptional and post-transcriptional events trigger de novo infB expression in cold stressed Escherichia coli

Affiliations

Transcriptional and post-transcriptional events trigger de novo infB expression in cold stressed Escherichia coli

Anna Brandi et al. Nucleic Acids Res. .

Abstract

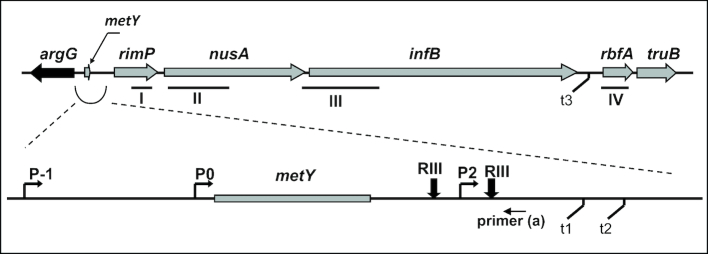
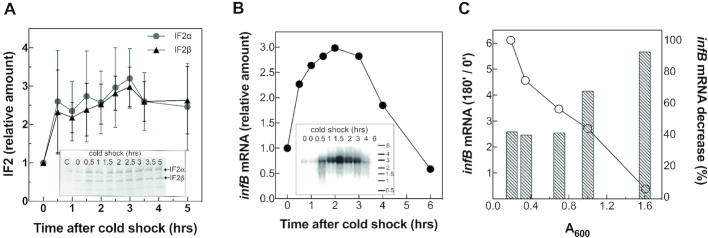
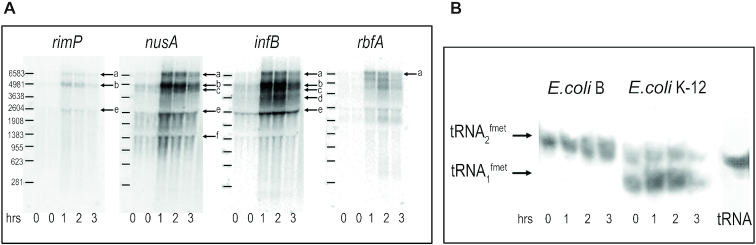
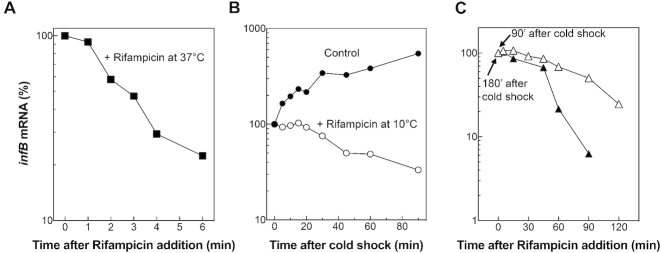
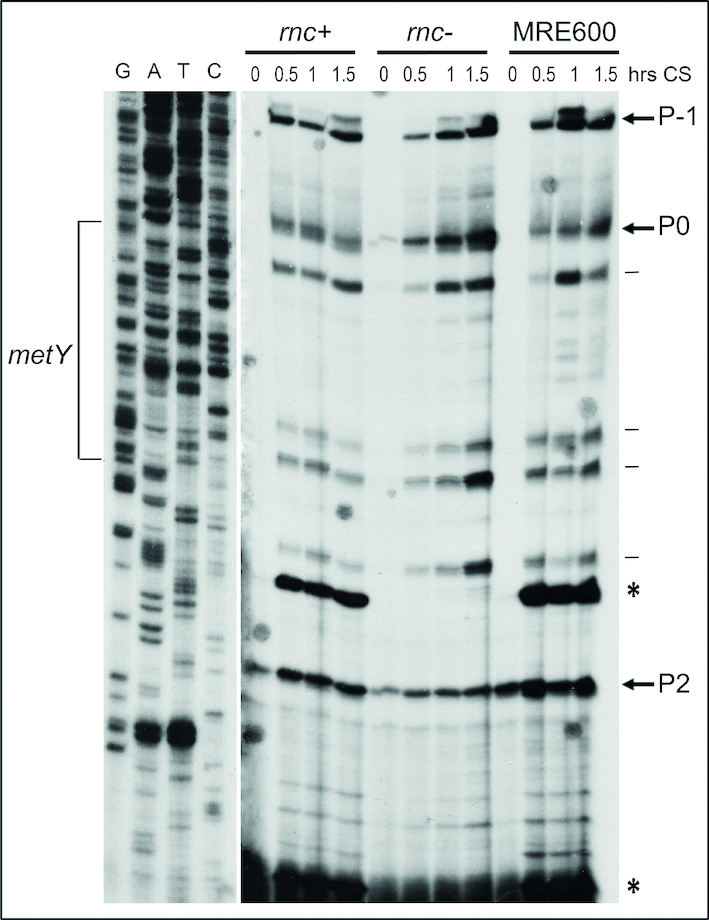
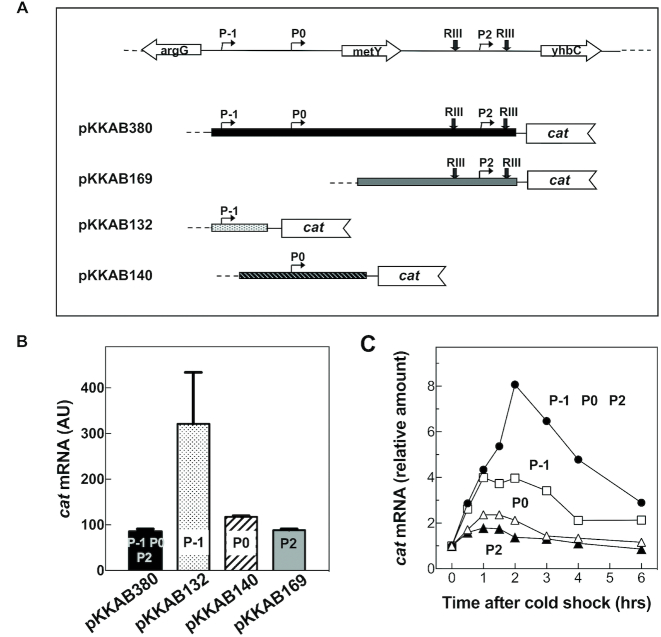
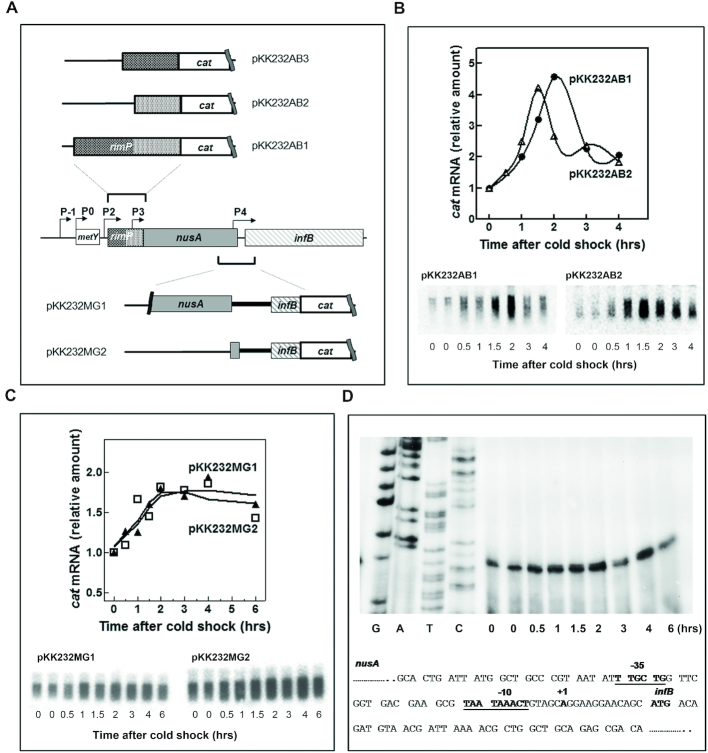
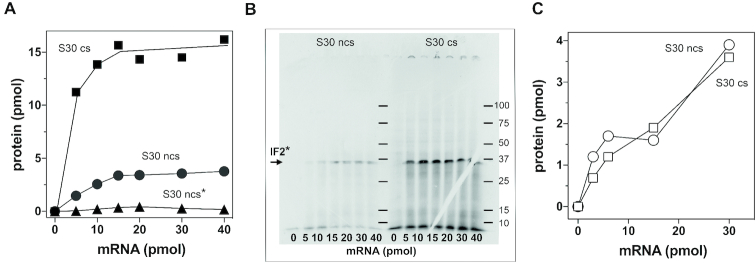
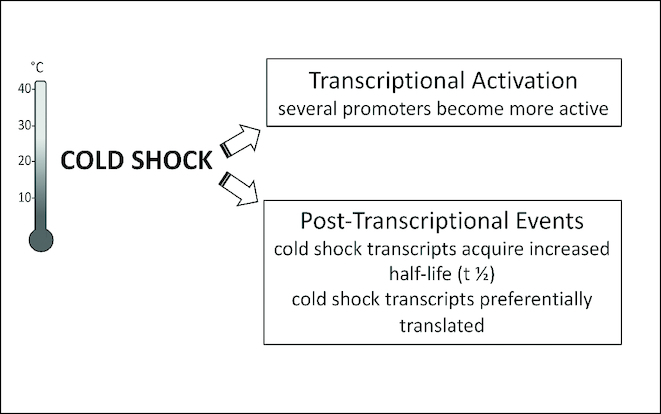
After a 37 to 10°C temperature downshift the level of translation initiation factor IF2, like that of IF1 and IF3, increases at least 3-fold with respect to the ribosomes. To clarify the mechanisms and conditions leading to cold-stress induction of infB expression, the consequences of this temperature shift on infB (IF2) transcription, infB mRNA stability and translation were analysed. The Escherichia coli gene encoding IF2 is part of the metY-nusA-infB operon that contains three known promoters (P-1, P0 and P2) in addition to two promoters P3 and P4 identified in this study, the latter committed to the synthesis of a monocistronic mRNA encoding exclusively IF2. The results obtained indicate that the increased level of IF2 following cold stress depends on three mechanisms: (i) activation of all the promoters of the operon, P-1 being the most cold-responsive, as a likely consequence of the reduction of the ppGpp level that follows cold stress; (ii) a large increase in infB mRNA half-life and (iii) the cold-shock induced translational bias that ensures efficient translation of infB mRNA by the translational apparatus of cold shocked cells. A comparison of the mechanisms responsible for the cold shock induction of the three initiation factors is also presented.


Figures

Figure 1.
Figure 1.
Scheme of the Escherichia coli chromosomal region corresponding to the nusA-infB operon. The region surrounding metY is enlarged to show better the location of the promoters identified so far. The positions of P-1, P0 and P2 promoters, the transcription terminators (t1, t2 and t3) as well as the RNaseIII processing sites are indicated in the scheme. The black arrow indicates the region corresponding to the oligonucleotide primer (a) used in primer extension analyses. The bars designated with roman numbers indicate the sequences corresponding to the probes used for northern blot analyses. Further details are given in the text.
Figure 2.
Figure 2.
Variation of the cellular levels of IF2 and infB mRNA as a function of cell density and following cold stress. (A) Relative increase of IF2α (•) and IF2β (▴) levels at the indicated times after a cold stress induced by shifting from 37 to 10°C a cell culture that had attained A600 = 0.5 with respect to the pre-shock level (time 0) taken as = 1.The amount of IF2 was estimated semi-quantitatively by subjecting western blots developed using a rabbit polyclonal anti-IF2 serum as described (6) to densitometry using a BioRad imaging densitometer GS-670. The error bars refer to the standard deviation calculated on the relative increase of the IF2 level from results obtained in three separate experiments carried out in duplicate. The inset shows a typical western blot of purified IF2α and IF2β (lane C) and of the factor present in extracts of cells at the onset of cold stress (time 0) and at the times of cold stress indicated above each lane. (B) Relative increase of the infB mRNA level at the times after the cold shock indicated in the abscissa with respect to the pre-shock (time 0) level taken as = 1. The amount of the mRNA was quantified from the radioactivity of the northern blot bands as detected by a BioRad FX molecular imager. A typical northern blot is presented in the inset; the numbers above the individual lanes indicate the time (hours) elapsed since the onset of the cold stress that is indicated as ‘0’. An RNA ladder (Thermo Scientific RoboRuler High Range RNA Ladder 200–6000 bases) is presented on the right side; (C) decreasing level of infB mRNA (○) as a function of the cell density (reported in the abscissa) of a culture growing in LB at 37°C. The decreasing infB mRNA level is expressed on the right side y-axis as %, taking as 100% the level detected at cell density A600 = 0.2. The histogram bars (left y-axis) indicate the ratios between the infB mRNA levels in cells cold-stressed for 180 min at the cell density indicated in the abscissa and the levels determined before cold-shock (time 0) induced at the corresponding cell density.
Figure 3.
Figure 3.
Analysis of the RNA transcripts of the nusA-infB operon before and after cold stress. (A) Analysis of the transcripts recognized by the probes indicated in Figure 1 hybridizing specifically with: from left to right rimP (probe I), nusA (probe II), infB (probe III) and rbfA (probe IV) genes. The arrows labelled with letters ‘a’ though ‘f’ indicate specific RNA molecules whose nature is discussed in the text. (B) Electrophoretic analysis of the tRNAi transcribed before and after cold stress from metY and metZ present in Escherichia coli K-12 and MRE600, respectively. The time elapsed after a 37 to 10°C cold stress is indicated below each lane. Further details are given in the text.
Figure 4.
Figure 4.
Effect of rifampicin on the infB mRNA levels before and after cold shock. (A) Variation of infB mRNA levels after addition of rifampicin to cells incubated at 37°C (▪). (B) infB mRNA levels in cold shocked cells treated with rifampicin (○) or not treated (•) at the onset of the cold acclimation as a function of time elapsed after rifampicin addition. (C) Variation of infB mRNA levels during cold acclimation in cells treated with rifampicin 90 min (△) and 180 min (▴) after the temperature downshift. The infB mRNA steady state level detected just before rifampicin addition is taken as 100%. The RNA mean half-lives (t1/2 ± standard deviation) determined from this and from two similar experiments are given in the text.
Figure 5.
Figure 5.
Primer extension analysis of the nusA-infB transcripts. The analyses were performed on total RNA extracted before and after the indicated times following a 37 to 10°C temperature downshift from cells expressing (Escherichia coli K12 MG1673 and E. coli MRE600) or not expressing (E. coli SK7622) the rnc gene that encodes RNase III as specified. The extensions originate from primer ‘a’ (Figure 1) complementary to a region downstream of RNaseIII cleavage sites. The arrows indicate the start sites corresponding to the 5’ ends of mRNAs originating from promoters P-1, P0 and P2. The two strong signals, corresponding to mRNA molecules resulting from RNaseIII processing are indicated by asterisks. Spurious stops are indicated by horizontal lines. The start sites (bold letter) and the sequences of core region of the three promoters are: P-1:ACGTTGACAAAATGTGGCATGGATCACTATAATGCCTGCAGATT; P0: TATTTGCATCTTTTACCCAAAACGAGTAGAATTTGCCACGTT; P2: ACTTTCCCTTAGAGTCCTTTTTCAAATATACTGTGAAGACTT
Figure 6.
Figure 6.
Expression of cat reporter gene fused to different DNA fragments derived from the nusA-infB operon. (A) Representation of the cat transcriptional fusion constructs used in this study. The DNA fragments schematically indicated in the figure, each containing chromosomal regions corresponding to the different promoters, were cloned upstream of promoter-less cat gene in pKK232–8; (B) Levels of cat mRNA expressed at 37°C in cells harbouring plasmids carrying the transcriptional fusions shown in panel (A) and containing the indicated promoters; (C) Relative increase of the steady-state levels of cat mRNA present in cells carrying the constructs containing all three promoters (P-1, P0 and P2) (•) or only P-1 (□), P0 (△) and P2 (▴) at the times after cold shock reported in the abscissa. The RNA level at time zero is taken as = 1.
Figure 7.
Figure 7.
Identification of P3 and P4 two new cold-inducible promoters in the nusA-infB operon. (A) Representation of the cat transcriptional fusion constructs used for the identification of new promoters. The chromosomal DNA fragments used in the transcriptional fusions with the cat gene are indicated in the panel. The fragments corresponding to the entire rimP and to the proximal and distal regions of the same gene and those corresponding to the nusA-infB intragenic regions are schematically indicated above and below the nusA-infB operon, respectively. (B) Steady state levels of cat mRNA present before and after the indicated times of cold stress in cells transformed with pKK232AB1(•) and pKK232AB2 (△). The RNA levels were estimated from the quantification of the hybridization bands detected by northern blotting like those shown below the graph. (C) Cold stress-dependent increase of the steady state levels of cat mRNA in cells carrying plasmids in which the promoter-less cat gene is placed downstream the proximal portion of infB plus a long (pKK232MG1, ▴) or a short (pKK232MG2, □) DNA segment belonging to the distal region of nusA. (D) Primer extension analysis of the start point of the transcript originating from P4, the promoter located in the nusA-infB intragenic region whose sequence is reported below. The identified core elements of the P4 promoter and the first transcribed base are indicated in bold letters. The curves shown in panels (B) and (C) have been fitted using the fitspline/lowess program (Graphpad Prism).
Figure 8.
Figure 8.
infB mRNA translation by extracts of control and cold-shocked cells. (A) Translation directed by infB mRNA in the amounts indicated in the abscissa by S30 extracts from Escherichia coli MRE600 cells subjected (▪) or not subjected (•, ▴) to cold stress. Translation was carried out for 30 min at 37°C (▪, •) or 15°C (▴). (B) Autoradiography of an SDS-PAGE showing the translational products obtained with the indicated increasing amounts of infB mRNA and S30 extracts of control cells (left) and cells subjected to cold stress (right). Further details can be found in ‘Materials and methods’ section. (C) Translation of bacterial phage MS2 coat protein at 37°C as a function of increasing concentrations of MS2 mRNA in the presence of cell-free extracts obtained from cells subjected (○) or not subjected (□) to cold stress. The translation conditions are the same as those presented in panel (A). The amount of protein synthesized was determined from the amount of [35S] methionine incorporated into hot TCA precipitated material. The experiment of panel (A) was carried out using as radioactive precursor [35S] methionine. Two similar experiments carried out in parallel using [14C] tyrosine and [14C] phenylalanine as precursors yielded identical results (Supplementary Figure S8).
Figure 9.
Figure 9.
Scheme summarizing the transcriptional and post-transcriptional events triggering de novo infB expression in cold stressed Escherichia coli cells.

Similar articles

Cited by

References

    1. Jones P.J., VanBogelen R.A F., Neidhardt C.. Induction of proteins in response to low temperature in Escherichia coli. J. Bacteriol. 1987; 169:2092–2095. - PMC - PubMed
    1. Thieringer H.A., Jones P.G., Inouye M.. Cold shock and adaptation. Bioessays. 1998; 20:49–57. - PubMed
    1. Yamanaka K. Cold shock response in Escherichia coli. J. Mol. Microbiol. Biotechnol. 1999; 1:193–202. - PubMed
    1. Graumann P., Wendrich T.M., Weber M.H., Schröder K., Marahiel M.A.. A family of cold shock proteins in Bacillus subtilis is essential for cellular growth and for efficient protein synthesis at optimal and low temperatures. Mol. Microbiol. 1997; 25:741–756. - PubMed
    1. Gualerzi C.O., Giuliodori A.M., Pon C.L.. Transcriptional and post-transcriptional control of cold-shock genes. J. Mol. Biol. 2003; 331:527–539. - PubMed

Publication types

MeSH terms

Substances

LinkOut - more resources