. 2019 Jun;10(3):662-686.
doi: 10.1002/jcsm.12404. Epub 2019 Mar 27.

Compression of morbidity in a progeroid mouse model through the attenuation of myostatin/activin signalling

Affiliations

Compression of morbidity in a progeroid mouse model through the attenuation of myostatin/activin signalling

Khalid Alyodawi et al. J Cachexia Sarcopenia Muscle. 2019 Jun.

Abstract

Background: One of the principles underpinning our understanding of ageing is that DNA damage induces a stress response that shifts cellular resources from growth towards maintenance. A contrasting and seemingly irreconcilable view is that prompting growth of, for example, skeletal muscle confers systemic benefit.

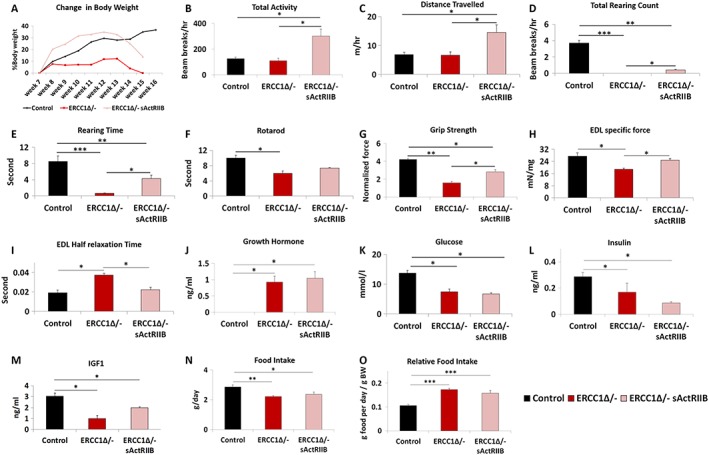
Methods: To investigate the robustness of these axioms, we induced muscle growth in a murine progeroid model through the use of activin receptor IIB ligand trap that dampens myostatin/activin signalling. Progeric mice were then investigated for neurological and muscle function as well as cellular profiling of the muscle, kidney, liver, and bone.

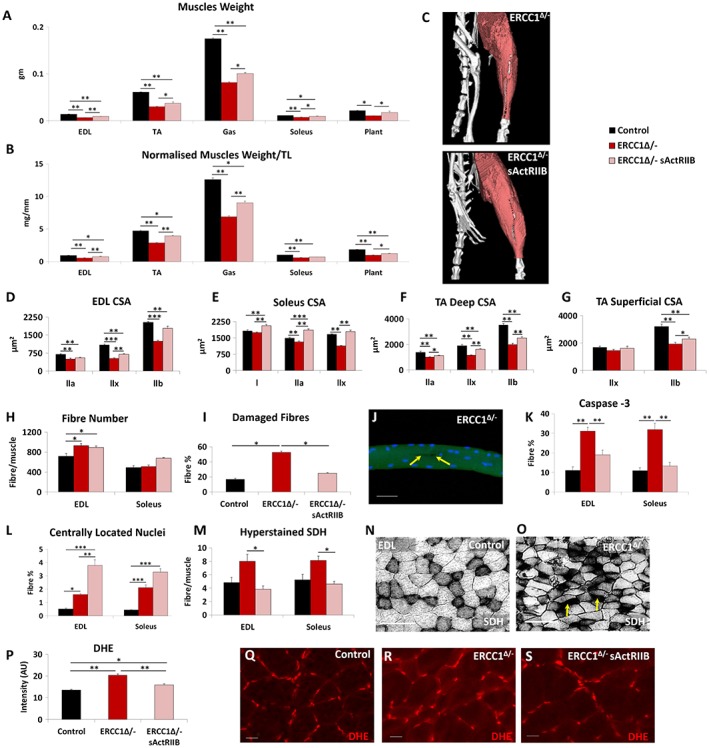
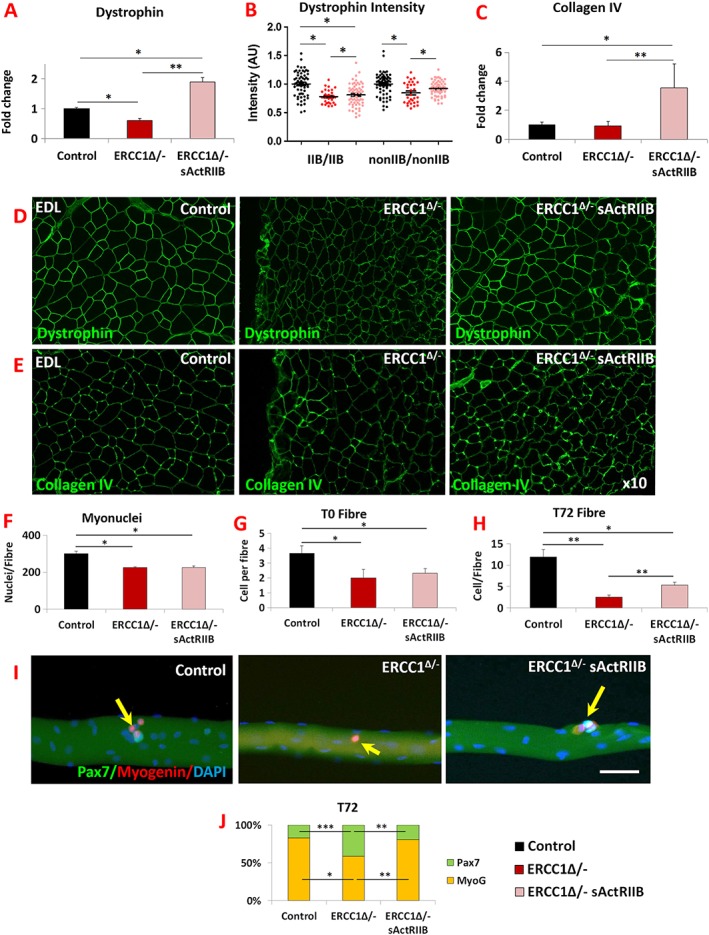
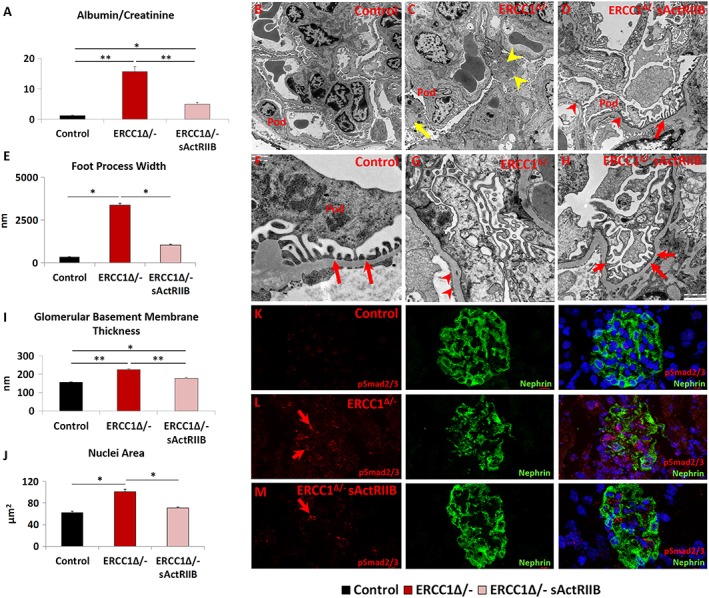
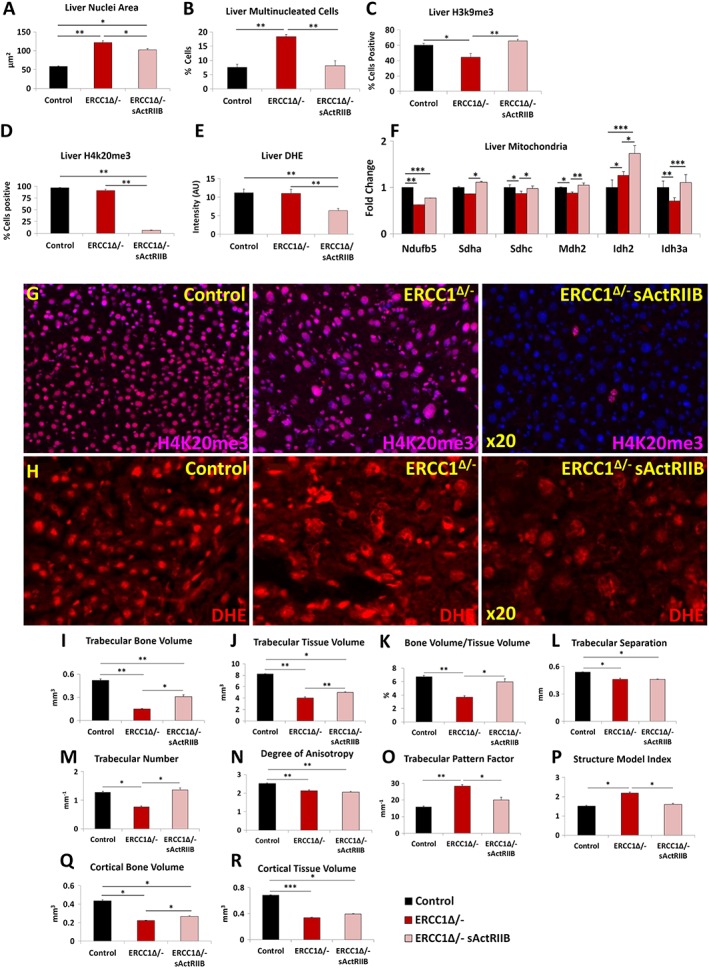
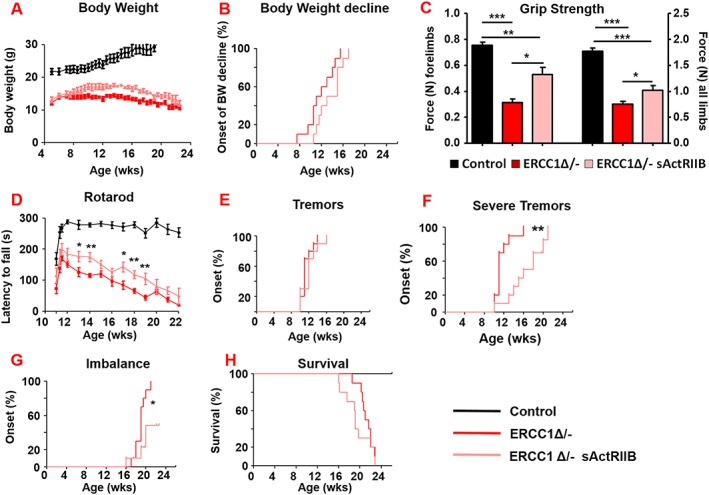
Results: We show that muscle of Ercc1Δ/- progeroid mice undergoes severe wasting (decreases in hind limb muscle mass of 40-60% compared with normal mass), which is largely protected by attenuating myostatin/activin signalling using soluble activin receptor type IIB (sActRIIB) (increase of 30-62% compared with untreated progeric). sActRIIB-treated progeroid mice maintained muscle activity (distance travel per hour: 5.6 m in untreated mice vs. 13.7 m in treated) and increased specific force (19.3 mN/mg in untreated vs. 24.0 mN/mg in treated). sActRIIb treatment of progeroid mice also improved satellite cell function especially their ability to proliferate on their native substrate (2.5 cells per fibre in untreated progeroids vs. 5.4 in sActRIIB-treated progeroids after 72 h in culture). Besides direct protective effects on muscle, we show systemic improvements to other organs including the structure and function of the kidneys; there was a major decrease in the protein content in urine (albumin/creatinine of 4.9 sActRIIB treated vs. 15.7 in untreated), which is likely to be a result in the normalization of podocyte foot processes, which constitute the filtration apparatus (glomerular basement membrane thickness reduced from 224 to 177 nm following sActRIIB treatment). Treatment of the progeric mice with the activin ligand trap protected against the development of liver abnormalities including polyploidy (18.3% untreated vs. 8.1% treated) and osteoporosis (trabecular bone volume; 0.30 mm3 in treated progeroid mice vs. 0.14 mm3 in untreated mice, cortical bone volume; 0.30 mm3 in treated progeroid mice vs. 0.22 mm3 in untreated mice). The onset of neurological abnormalities was delayed (by ~5 weeks) and their severity reduced, overall sustaining health without affecting lifespan.

Conclusions: This study questions the notion that tissue growth and maintaining tissue function during ageing are incompatible mechanisms. It highlights the need for future investigations to assess the potential of therapies based on myostatin/activin blockade to compress morbidity and promote healthy ageing.

Keywords: Ageing; Bone; Compression; Kidney; Liver; Morbidity; Myostatin; Neurological; Progeroid; Skeletal muscle.


Conflict of interest statement

The authors declare no competing interests.

Figures

Figure 1
Figure 1
sActRIIB treatment mitigates body, whole animal activity, grip strength, losses, and specific force loss in Ercc1 Δ/− mice. (A) Relative changes in body mass over time. Intraperitoneal injection of Ercc1 Δ/− with sActRIIB started at week 7 and tissues collected at the end of week 15. Organismal activity measurements through activity cages. Measurements in (B–E) made at the end of week 14. (F) Rotarod activity. (G) Muscle contraction measurement through assessment of grip strength. (H) Ex vivo assessment of EDL‐specific force. (I) Half relaxation time for the EDL. Levels of (J) growth hormone, (K) glucose, (L) insulin, and (M) insulin‐like growth factor‐1 at beginning of week 15. (N) Food intake and (O) relative food intake at the end of week 15. n = 6 control male mice, n = 5 Ercc1 Δ/− untreated male mice, and n = 5 Ercc1 Δ/− treated male mice. All analysis performed using non‐parametric Kruskal–Wallis test followed by the Dunn's multiple comparisons except (J) where one‐way analysis of variance followed by Bonferroni's multiple comparison tests was used. *P < 0.05, **P < 0.01, ***P < 0.001. EDL, extensor digitorum longus; IGF‐1, insulin‐like growth factor‐1; sActRIIB, soluble activin receptor type IIB.
Figure 2
Figure 2
Quantitative and qualitative improvements to Ercc1 Δ/− skeletal muscle through sActRIIB treatment. (A) Muscle weight at end of week 15. (B) Muscle mass normalized to tibial length. (C) Micro‐computed tomography scan of hind limb to visualize the increase in muscle upon sActRIIB treatment in Ercc1 Δ/− mice. (D–G) Cross‐sectional fibre areas assigned to specific myosin heavy chain isoforms. (H) Fibre number increased in EDL and soleus of Ercc1 Δ/− mice and further increased following treatment. (I) Incidence of damaged fibres following single fibre isolation. (J) Example of micro‐tear (arrows) in an Ercc1 Δ/− EDL fibre. (K) Fibres containing caspase 3 epitope as a percentage of all EDL and soleus fibres. (L) Percentage of fibres with centrally located nuclei in the EDL and soleus. (M) Quantification of hyper‐stained SDH fibres. (N) SDH in control muscle and (O) Ercc1 Δ/− muscle showing hyper‐stained fibres (arrows). (P) Quantification of DHE fluorescence in TA muscle fibres. (Q) Control TA fibres with little DHE fluorescence in the body of control fibres. (R) Ercc1 Δ/− TA fibres with elevated DHE fluorescence in the body of control fibres. (S) Treated Ercc1 Δ/− TA fibres with little DHE fluorescence in the body of fibres. n = 9 control male mice, n = 8 Ercc1 Δ/− untreated male mice, and n = 8 Ercc1 Δ/− treated male mice. Scale for single fibre 50 μm, SDH 100 μm and DHE 20 μm. One‐way analysis of variance followed by Bonferroni's multiple comparison tests. *P < 0.05, **P < 0.01, ***P < 0.001. DHE, dihydroethidium; EDL, extensor digitorum longus; sActRIIB, soluble activin receptor type IIB; SDH, succinate dehydrogenase; TA, tibialis anterior.
Figure 3
Figure 3
sActRIIB induces fast and glycolytic transformation of Ercc1 Δ/− muscle. (A) MHC profile of EDL muscle. (B–D) EDL MHCIIA/IIB fibre distribution in the three cohorts, controls, Ercc1 Δ/−, and Ercc1 Δ/− treated with sActRIIB. (E) SDH‐positive and ‐negative fibre profile of EDL muscle. (F–H) SDH stain in the three cohorts. (I) Quantification of EDL capillary density. (J–L) Identification of EDL capillaries with CD‐31 in the three cohorts. Quantitative PCR profiling of (M) angiogenic genes, (N) PGC1α, (O) mitochondrial genes, and (P) regulators of fat metabolism. n = 8 for all cohorts. Scale for SDH 100 μm and CD31 50 μm. One‐way analysis of variance followed by Bonferroni's multiple comparison tests used in all data sets except (E) where non‐parametric Kruskal–Wallis test followed by the Dunn's multiple comparison was used. *P < 0.05, **P < 0.01, ***P < 0.001. EDL, extensor digitorum longus; MHC, myosin heavy chain; SDH, succinate dehydrogenase; sActRIIB, soluble activin receptor type IIB.
Figure 4
Figure 4
sActRIIB prevents Ercc1 Δ/− muscle ultrastructural abnormalities and supports normal levels of expression of key stress indicators. All Electron microscopy (EM) longitudinal image and quantitative measurements are from the bicep muscle. (A) Low‐power image of control muscle. (B) Low‐power image of Ercc1 Δ/− muscle. Note large spaces (black arrowheads), non‐uniform sarcomere width (red arrows), dilated sarcomeric mitochondria (red arrowheads), split sarcomere (black arrow), and disrupted M‐Line (blue arrow). (C) Low‐power image of sActRIIB‐treated Ercc1 Δ/− muscle. (D) Higher magnification of sarcomeric region of control muscle showing uniformly sized mitochondria (black arrows). (E) Enlarged mitochondria in sarcomeric region of Ercc1 Δ/− muscle (blue arrowhead) and absent (blue arrow) or faint Z‐line (black arrow). (F) Higher magnification of sarcomeric region of treated Ercc1 Δ/− mice showing smaller sarcomeric mitochondria (black arrows). (G) Sarcolemma region of control muscle showing compact mitochondria (red arrowhead). (H) Dilated (blue arrowhead) and aberrant mitochondria (blue arrow) in sub‐sarcolemma region of Ercc1 Δ/− muscle. (I) Sarcolemma region of treated Ercc1 Δ/− mice showing compact mitochondria (red arrowhead). (J, K) Sarcomeric (intrafusal) and sub‐membrane mitochondrial density measurements. (L, M) Sub‐membrane and sarcomeric (intrafusal) mitochondrial size measurements. (N) Expression of mitochondria unfolded protein response gene in gastrocnemius muscle. (O) Expression of inflammatory genes in gastrocnemius muscle. (P) Expression of prohibitin genes in gastrocnemius muscle. (Q) Quantification of EDL fibres expressing H3K9me3 and (R) H4K20me3. EM studies n = 6–7 for all cohorts. All other measures n = 8–9 for all cohorts. Non‐parametric Kruskal–Wallis test followed by the Dunn's multiple comparisons used in (N, O) and the rest with one‐way analysis of variance followed by Bonferroni's multiple comparison tests. *P < 0.05, **P < 0.01. EDL, extensor digitorum longus; sActRIIB, soluble activin receptor type IIB.
Figure 5
Figure 5
Normalization of Ercc1 Δ/− extracellular components by sActRIIB and differentiation and self‐renewal of its satellite cells. (A) Dystrophin gene expression measured by quantitative PCR (qPCR). (B) Measure of dystrophin in fibre‐type‐specific manner using quantitative immunofluorescence. (C) Measure of collagen IV expression profiling by qPCR. (D) Immunofluorescence image for dystrophin expression in EDL muscle. (E) Immunofluorescence image for collagen IV expression in EDL muscle. n = 7 for all cohorts. (F) EDL myonuclei count. (G) Quantification of satellite cells on freshly isolated EDL fibres. (H) Quantification of cells on EDL fibres after 72 h culture. (I) Control, mock‐treated Ercc1 Δ/−, and sActRIIB‐treated Ercc1 Δ/− fibre examined at 72 h for expression of Myogenin (red) and Pax7 (green). Arrows indicated satellite cell progeny. (J) Quantification of EDL differentiated (Pax7/Myogenin+) vs. stem cell (Pax7+/Myogenin) after 72 h in culture. Fibres collected from three mice from each cohort and minimum of 25 fibres examined. Scale 50 μm. Non‐parametric Kruskal–Wallis test followed by the Dunn's multiple comparisons used for (A–C). Rest of data was analysed using one‐way analysis of variance followed by Bonferroni's multiple comparison tests. *P < 0.05, **P < 0.01, ***P < 0.001. EDL, extensor digitorum longus; sActRIIB, soluble activin receptor type IIB.
Figure 6
Figure 6
The prevention of kidney function abnormalities through the maintenance of the filtration barriers by sActRIIB treatment of Ercc1 Δ/− mice. (A) Urine protein measurements at the end of week 14. (B–D) Low and (F–H) high magnification of electron microscopy images of podocytes from control, mock‐treated Ercc1 Δ/−, and sActRIIB‐treated Ercc1 Δ/ mice. Pod indicates the podocyte. (C) Ercc1 Δ/− tissue contains autophagosomes (yellow arrow) and enlarged mitochondria (yellow arrowhead). (D) sActRIIB‐treated Ercc1 Δ/− mice show some foot process effacement (red arrowheads) but significant number of mature foot processes (red arrow). (E) Quantification of foot process width. (F) Numerous mature foot processes in control sample (red arrows). (G) Very few foot processes in Ercc1 Δ/− sample but thickened glomerular basement membrane (red arrowheads). (H) Treated Ercc1 Δ/− sample showing numerous mature foot processes (red arrows). (I) Quantification of glomerular basement membrane thickness. (J) Nuclear size measurements in Nephrin‐positive domain. (K) pSmad2/3 profile in control mice (red) in relation to podocytes, identified through Nephrin expression. (L) Abundant levels of pSmad2/3 (red arrows) in Ercc1 Δ/− podocytes. (M) Few pSmad2/3 puncta in sActRIIB‐treated Ercc1 Δ/− podocytes (red arrow). n = 8 mice examined for each cohort for (A) and n = 5 mice examined for each cohort for (EM). Analysis performed using non‐parametric Kruskal–Wallis test followed by the Dunn's multiple comparisons. *P < 0.05, **P < 0.01. sActRIIB, soluble activin receptor type IIB.
Figure 7
Figure 7
sActRIIB prevents the development age‐related liver abnormalities and osteoporotic phenotype in Ercc1 Δ/−. (A) Measure of liver nuclear size. (B) Profile frequency of multinucleated liver cells. (C) Frequency of H3K9me3‐positive liver cells. (D) Frequency of H4K20me3‐positive liver cells. (E) Quantification of DHE fluorescence to gauge superoxide levels. (F) Quantitative PCR profiling of mitochondrial gene expression. (G) Immunofluorescence images for H4K20me3 distribution in the three cohorts. (H) DHE intensity levels in the three cohorts. (I) Trabecular bone volume measurements. (J) Trabecular tissue volume measurements. (K) Trabecular bone to tissue volume ratios. (L) Trabecular separation indices. (M) Enumeration of trabeculae. (N) Degrees of trabecular anisotrophy. (O) Trabecular pattern factor as a quantification of bone architecture. (P) Structure model index. (Q) Measure of cortical bone volume. (R) Cortical tissue volume measure. Trabecular bone volume measurements. n = 8 for all animals in (A–H) and n = 6 control male mice, five Ercc1 Δ/−‐untreated male mice, and six Ercc1 Δ/−‐treated male mice in other experiments. One‐way analysis of variance followed by Bonferroni's multiple comparison tests used for (A–F) and non‐parametric Kruskal–Wallis test followed by the Dunn's multiple comparisons for (I–R). *P < 0.05, **P < 0.01, ***P < 0.001. DHE, dihydroethidium; sActRIIB, soluble activin receptor type IIB.
Figure 8
Figure 8
sActRIIB delays neurological abnormalities in Ercc1 Δ/− mice without affecting lifespan. (A, B) Body weight changes of treated (sActRIIB or mock control) Ercc1 Δ/− mice at a second test site (P = 0.07). Intraperitoneal injection started at week 7. (C) Average grip strength of the forelimbs and all limbs of 4‐month‐old Ercc1 Δ/− mice under mock and sActRIIB conditions. (D) Average time spent on an accelerating rotarod of Ercc1 Δ/− mice on different treatments weekly monitored. (E–G) Onset of neurological abnormalities (F) tremors (P = 0.28), (F) severe tremors (P = 0.0014), and (G) imbalance (P = 0.021) with age. (H) Survival of sActRIIB‐treated and mock‐treated Ercc1 Δ/− mice (P = 0.27). n = 10 animals per group. Error bars indicate mean ± SE. Log‐rank Mantel‐Cox test. *P < 0.05, **P < 0.01, ***P < 0.001. sActRIIB, soluble activin receptor type IIB.

References

    1. Niccoli T, Partridge L. Ageing as a risk factor for disease. Curr Biol 2012;22:R741–R752. - PubMed
    1. Niedernhofer LJ, Garinis GA, Raams A, Lalai AS, Robinson AR, Appeldoorn E, et al. A new progeroid syndrome reveals that genotoxic stress suppresses the somatotroph axis. Nature 2006;444:1038–1043. - PubMed
    1. Garinis GA, Uittenboogaard LM, Stachelscheid H, Fousteri M, Van Ijcken W, Breit TM, et al. Persistent transcription‐blocking DNA lesions trigger somatic growth attenuation associated with longevity. Nat Cell Biol 2009;11:604–615. - PMC - PubMed
    1. Hoeijmakers JH. DNA damage, aging, and cancer. N Engl J Med 2009;361:1475–1485. - PubMed
    1. Milman S, Huffman DM, Barzilai N. The somatotropic axis in human aging: framework for the current state of knowledge and future research. Cell Metab 2016;23:980–989. - PMC - PubMed

Publication types

MeSH terms