. 2019 Mar 27:8:e44210.
doi: 10.7554/eLife.44210.

Antigen receptor control of methionine metabolism in T cells

Affiliations

Antigen receptor control of methionine metabolism in T cells

Linda V Sinclair et al. Elife. .

Abstract

Immune activated T lymphocytes modulate the activity of key metabolic pathways to support the transcriptional reprograming and reshaping of cell proteomes that permits effector T cell differentiation. The present study uses high resolution mass spectrometry and metabolic labelling to explore how murine T cells control the methionine cycle to produce methyl donors for protein and nucleotide methylations. We show that antigen receptor engagement controls flux through the methionine cycle and RNA and histone methylations. We establish that the main rate limiting step for protein synthesis and the methionine cycle is control of methionine transporter expression. Only T cells that respond to antigen to upregulate and sustain methionine transport are supplied with methyl donors that permit the dynamic nucleotide methylations and epigenetic reprogramming that drives T cell differentiation. These data highlight how the regulation of methionine transport licenses use of methionine for multiple fundamental processes that drive T lymphocyte proliferation and differentiation.

Keywords: T cell activation; immunology; inflammation; lymphocyte; methionine metabolism; mouse; nutrient uptake; proteomics.


Conflict of interest statement

LS, AH, AB, LS, JH, AM, XL, ST, PT, JR, JL, AL, DC No competing interests declared

Figures

Figure 1.
Figure 1.. T cell activation and differentiation requires a sustained supply of extracellular methionine.
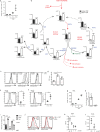
(a) Flow cytometry plots show the forward (FSC) and side (SSC) scatter profiles of CD4+ T cells stimulated through the TCR (CD3/CD28) for 18 hr ± methionine. (b) Cell counts of CD4+ T cells over 48 hr after TCR-stimulation (CD3/CD28) in the presence or absence of methionine. (c) Flow cytometry plots CD69 expression of CD4+ T cells stimulated through the TCR (CD3/CD28) for 18 hr ± methionine. (d-f) CD4+ T cells activated with CD3/CD28 antibodies + IL2/IL12 for 3 days in indicated methionine concentrations. (d) CD44 surface staining and intracellular IFNγ cytokine staining. The % CD4+ T cells producing IFNγ is indicated on the plot. The percentage (e) and MFI (f) of IFNγ producing CD4+ T cells from three biological replicates. (g–l) CD4+ T cells were stimulated through the TCR (CD3/CD28) for 20 hr before culturing in reducing concentrations of methionine for a further 2 hr. The histograms (left panel) show de novo protein synthesis as measured by incorporation of the puromycin analog (OPP) (g) or RNA synthesis as determined by EU incorporation (h). The right panels show the MFIs over the expanded dose response. Cyclohexamide (CHX) treatment or Actinomycin D (ActD) treatment are included as negative controls for protein and RNA synthesis. (i) The histograms (left panel) show the frequency of CD4+ T cells undergoing DNA synthesis as measured by EdU incorporation. The right panel shows the frequency of EdU positive cells over the expanded dose response. (j–l) EC50 values were calculated from dose response curves (using logged concentration values). Goodness of fit is represented by the R2 values. (m–o) Th1 effector cells were expanded for 5 days before culturing in reducing concentrations of methionine for a further 5 hr. The histograms show (m) de novo protein synthesis (n) RNA synthesis and (o) DNA synthesis. (Plots are representative of 3 biological replicates. Gating strategies are provided in Supplementary file 1. Error bars are mean ± s.d of: three biological replicates; Points on the graphs indicate biological replicates.).
Figure 2.
Figure 2.. Methionine metabolism in T cells.
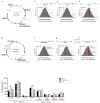
(a) 3H radioactivity measured in TCA precipitated protein from isolated CD4+ T cells stimulated through the TCR (CD3/CD28) in the presence of 3H-methionine for the indicated times. (b) Metabolomic analysis of metabolites in the de novo pathway and the salvage pathway of the methionine cycle. The graphs show metabolite intensity derived from integrated peak areas of MS intensity from naïve CD4+ T cells and TCR-stimulated CD4+ T cells (CD3/CD28, for 16 hr). Enzymes are indicated adjacent to arrows (in blue). P values are indicated on each graph. Source data is available in Figure 2—source data 1. (c) The histograms show representative intracellular staining of total H3, trimethylated H3K27 (H3K27me3) or trimethylated H3K4 (H3K4me3) from IL7 maintained (unstimulated) or TCR-stimulated (CD3/CD28) CD4+ T cells for 18 hr. Geometric mean fluorescence intensities (MFI) are shown in the histograms. (d) The graph shows ratios of H3, H3K27me3 and H3K4me3 MFIs from TCR-stimulated (CD3/CD28) CD4+ T cells compared to unstimulated CD4+ T cells. (e, f) OT2 (CD45.1) cells were adoptively transferred into WT CD45.2 hosts. The hosts were immunised with NP-OVA/alum and the transferred OT2 cells were analysed after 3 days. The histograms (left) show representative intracellular staining of H3K27me3 (e) and H3K4me3 (f). Graphs (right) show ratios of H3K27me3 and H3K4me3 MFIs in activated OT2 CD4+ T cells compared to non-activated host CD4+ T cells 3 days post-immunisation. (g) 3H radioactivity measured in RNA extracted from isolated CD4+ T cells stimulated through the TCR (CD3/CD28) in the presence of 3H-methionine for the indicated times. (h) 3H radioactivity measured in protein or RNA extracted from CD4+ T cells stimulated in parallel to (g) in the presence 3H-phenylalanine for 18 hr. (i) Levels of SAH from unstimulated (naïve cells), TCR-stimulated (CD3/CD28, 18 hr) CD4+ T cells or IL2 maintained Th1 cells ± methionine for 18 hr. (j) The histograms show representative intracellular staining of total H3, trimethylated H3K27 (H3K27me3) or trimethylated H3K4 (H3K4me3) from IL7 maintained (unstimulated) or TCR-stimulated (CD3/CD28) CD4+ T cells±methionine as indicated (18 hr). (k) Percentage of RNA with m6A modification, as determined by ELISA, in Th1 cells cultured with decreasing methionine concentrations for 5 hr (as indicated). (l) Percentage of RNA with m5C modification, as determined by ELISA, in Th1 cells cultured ±methionine for 5 hr. (Error bars are mean ± s.d of: (a–d, i–l) three biological replicates (e–f) six biological replicates. (g,h) 4 (RNA) biological replicates and five biological replicates (protein). MFIs are indicated in the histograms, points on the graphs indicate biological replicates. (b, e, l) t -test; (d,i,k) One-way ANOVA; P= *<0.05, **<0.01, ***<0.001, ****<0.0001; Flow cytometry gating strategies are provided in Supplementary file 1).
Figure 3.
Figure 3.. Proteomics expression of methionine pathway in T cells Quantitative proteomics data showing the abundance of key enzymes in the methionine cycle of the de novo.
(a) and the salvage pathways (b). Mean protein copy numbers, indicated in red, estimated using the proteomic ruler protocol and presented as log-transformed mean values are shown relative to their frequency in the total data set. The graphs show copy numbers from naïve CD4+ T cells of MAT2A (c), AHCY (d), MTR (e) and SRM/SMS (f), MTAP (g) and mtnA-D (h). (i) Quantitative proteomics data comparing the concentration of key enzymes in the methionine cycle of the de novo and the salvage pathways in naïve, TCR activated and Th1 effector CD4+ T cells. Concentration is calculated using the histone ruler and estimated mass of molecules per cell, as described in Wiśniewski et al. (2014). (Data are from three biological replicates and error bars are mean ± s.d.).
Figure 4.
Figure 4.. Methyltransferase expression in T cells.
Abundance of (a) CMTR1 and RNMT cap methyltransferases (b) METTL3 m6A RNA methyltransferase and (c) NSUN2 m5C methyltransferase expression in naïve, TCR activated and effector Th1 CD4+ T cells (plotted as in 3 c). (e) DNA methyltransferases use SAM as a methyl donor to methylate CG residues. The concentration of the DNA methyltransferase complexes expressed in naïve CD4+ T cells (naïve), 24 hr TCR- stimulated (aCD3/aCD28, IL2/12) CD4+ T cells (TCR) and in vitro generated Th1 cells (Th1). (f) The polycomb repressor complex 2 (PRC2) uses SAM to methylate lysine residues for example K27 on histone tails. Concentration of the PRC2 components calculated from proteomics data from naïve CD4+ T cells (naïve), 24 hr TCR- stimulated CD4+ T cells (TCR) and in vitro generated Th1 cells (Th1). (g) Flow cytometry plots showing EZH2 staining in naïve CD4+ T cells, CD4+ T cells stimulated through the TCR (aCD3/aCD28, IL2/12) for 18 hr and in vitro generated Th1 cells. MFI are shown on the graph. (h) Concentrations of histone methyltransferases calculated from proteomics data of naïve CD4+ T cells (naïve), 24 hr TCR- stimulated CD4+ T cells (TCR) and in vitro generated Th1 cells (Th1). Histone methyl modifications are indicated. (Error bars are mean ± s.d. Data are from three biological replicates.).
Figure 5.
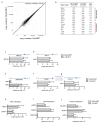
Figure 5.. Acute methionine restriction on methionine cycle proteome Quantitative ‘single-shot’ proteomics was performed on in vitro generated IL2 maintained Th1 cells cultured for 5 hr in 100 μM or 1 μM methionine.
(a) The graph shows the protein copy numbers in Th1 cultured with 1 μM methionine plotted against those in 100 μM methionine. Pearson correlation is indicated. (b) Proteins that were significantly differentially expressed (= <0.05, with a 1.5 fold cut-off) are listed by gene name. They are ranked as most decreased by acute methionine deprivation to those that are increased. (c-g) The graphs show mean copy numbers (estimated using the proteomic ruler protocol) of (c) MAT2A, (d) AHCY, (e) SMS/SRM, (f) MTAP and (g) mtnA. (h-j) The graphs show mean copy numbers of (h) RNA cap methyltransferases RNMT and CMTR1; (i) DNA methyltransferase complex components UHRF1, DNMT1 and DNMt3a and (j) histone methyltransferases SUV39H1, SETD3 and EZH2. (Error bars are mean ± s.d. Data are from three biological replicates.).
Figure 6.
Figure 6.. Impact of methionine restriction on c-myc expression and mTORC1 activity.
(a, b) CD4+ T cells from GFP-MycKI mice were activated with CD3/CD28 antibodies ± methionine for 5 hr. (a) Flow cytometry plots show CD69 expression (left) and GFP-Myc expression (right) of IL7 maintained control CD4+ T cells (grey), CD4+ T cells activated with (black) or without (red) methionine. The MFI are shown in (b). (c-e) In vitro generated Th1 CD4+ T cells were cultured for 3 days prior to acute methionine deprivation (1 hr). (c) Histograms show ribosomal protein S6 phosphorylation (pS6) in Th1 cells in methionine replete media (100 μM, MET)±rapamycin (Rap, 20 nM); (d) methionine free media (no MET), no amino acids (no AA) (e) or methionine free media supplemented with SAM (100 μM, no MET +SAM). The corresponding MFI are shown in (f). (a, c-e Data are representative of 3 biological replicates. (b,f) Points indicate individual biological replicates. Error bars are mean ± s.d. One-way ANOVA; (d) t-test; P = *<0.05, **<0.01, ***<0.001, ****<0.0001).
Figure 7.
Figure 7.. Antigen receptor and cytokine signalling regulate methionine bioavailability through SLC7A5 expression.
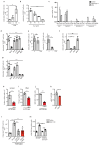
(a) Uptake of 3H-methionine in purified CD4+ T cells±TCR activation using CD3/CD28 antibodies for 3 or 18 hr. (b) 3H-methionine uptake in 5 day in vitro expanded Th1 cells switched for final 18 hr into indicated concentrations of IL2. (c) The graphs show copy numbers of potential methionine transporters from proteomics data sets of naïve CD4+ T cells, 24 hr TCR- stimulated CD4+ T cells and effector Th1 cells. (nd = not detected) (d) Uptake of 3H-methionine in IL2 maintained Th1 cells in the presence or absence of BCH, ALA, LYS, MeAIB or MET (all 5 mM). (e) Uptake of 3H-methionine (left panel) or 14C glutamine (right panel) in IL2 maintained Th1 cells in presence or absence of sodium in the uptake buffer. (f) 14C-glutamine uptake in IL2 maintained Th1 cells in the presence or absence of GLN, ALA and BCH (all 5 mM). (g) 3H-phenylalanine uptake in IL2 maintained Th1 cells in the presence or absence of BCH, ALA, LYS, LEU or MET (all 5 mM). (h–i) 3H radioactivity of TCA precipitated protein (h) or RNA (i) from CD4+ T cells stimulated through the TCR (CD3/CD28) for 6 hr in the presence of 3H-methionine ± the System L inhibitor BCH. (j) SAH levels as determined by ELISA in CD4+ T cells stimulated through the TCR (CD3/CD28)±the System L inhibitor BCH for 18 hr. (k) Percentage of RNA with m6A modification, as determined by ELISA, in Th1 cells cultured in 20 μM MET ±BCH for 5 hr. (l) Uptake of 3H-methionine in TCR stimulated (CD3/CD28, 18 hr) CD4+ T cells from Slc7a5fl/fl or Cd4-Cre+::Slc7a5fl/fl mice, compared to unstimulated CD4+ T cells maintained in IL7,±System L transporter inhibitor BCH (5 mM). (m) SAH levels in CD4+ T cells from Slc7a5fl/fl or Cd4-Cre+::Slc7a5fl/fl mice stimulated through the TCR (CD3/CD28) for 18 hr, compared to naive cells. ((a,b- d, f, g, l, m) ANOVA, (e,h–k) t-test; P= *<0.05, **<0.01, ***<0.001, ****<0.0001. Uptakes performed in triplicate. Error bars are s.d. from minimum three biological replicates. Points indicate individual biological replicates.).

Comment in

  • doi: 10.7554/eLife.47221

References

    1. Albers E. Metabolic characteristics and importance of the universal methionine salvage pathway recycling methionine from 5'-methylthioadenosine. IUBMB Life. 2009;61:1132–1142. doi: 10.1002/iub.278. - DOI - PubMed
    1. Allis CD, Jenuwein T. The molecular hallmarks of epigenetic control. Nature Reviews Genetics. 2016;17:487–500. doi: 10.1038/nrg.2016.59. - DOI - PubMed
    1. Araki K, Morita M, Bederman AG, Konieczny BT, Kissick HT, Sonenberg N, Ahmed R. Translation is actively regulated during the differentiation of CD8+ effector T cells. Nature Immunology. 2017;18:1046–1057. doi: 10.1038/ni.3795. - DOI - PMC - PubMed
    1. Aregger M, Cowling VH. Regulation of mRNA capping in the cell cycle. RNA Biology. 2017;14:11–14. doi: 10.1080/15476286.2016.1251540. - DOI - PMC - PubMed
    1. Baird FE, Bett KJ, MacLean C, Tee AR, Hundal HS, Taylor PM. Tertiary active transport of amino acids reconstituted by coexpression of system A and L transporters in Xenopus oocytes. American Journal of Physiology-Endocrinology and Metabolism. 2009;297:E822–E829. doi: 10.1152/ajpendo.00330.2009. - DOI - PubMed

Publication types