Comparative Study
. 2019 Jul;33(7):7929-7941.
doi: 10.1096/fj.201802650RR. Epub 2019 Mar 27.

Primary endothelial cell-specific regulation of hypoxia-inducible factor (HIF)-1 and HIF-2 and their target gene expression profiles during hypoxia

Affiliations
Comparative Study

Primary endothelial cell-specific regulation of hypoxia-inducible factor (HIF)-1 and HIF-2 and their target gene expression profiles during hypoxia

Rafal Bartoszewski et al. FASEB J. 2019 Jul.

Abstract

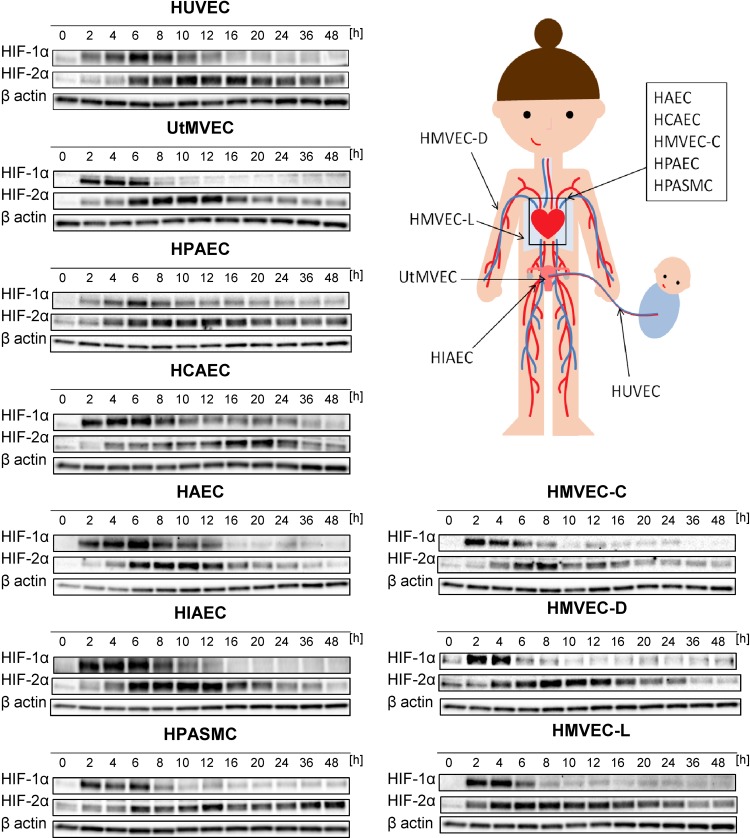
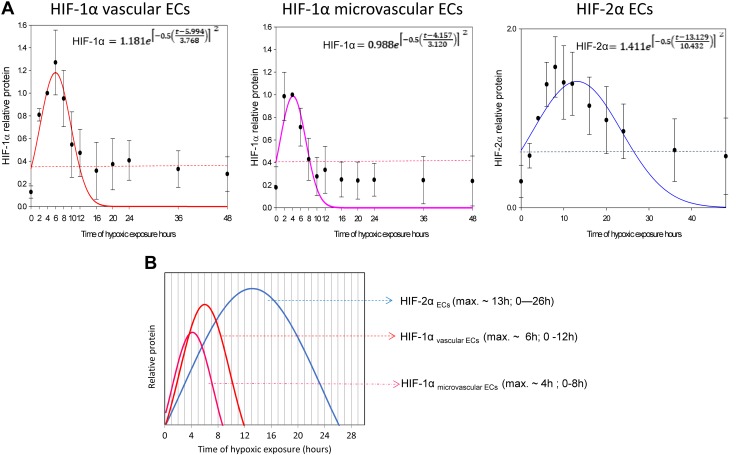
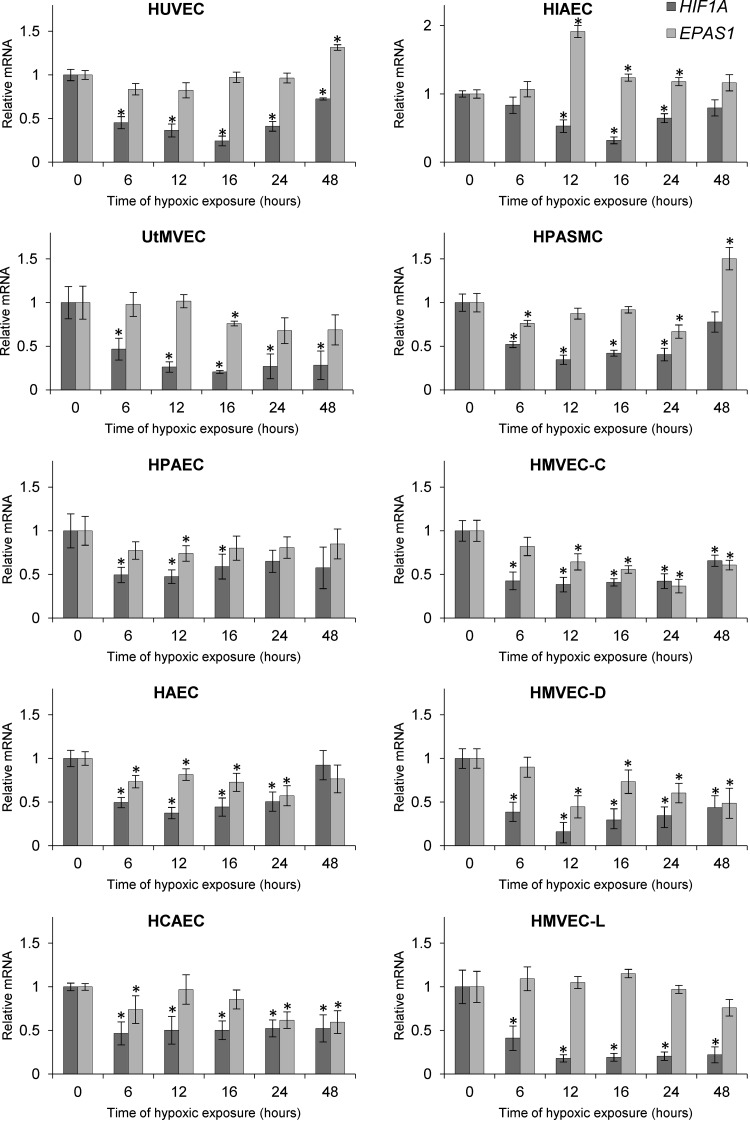
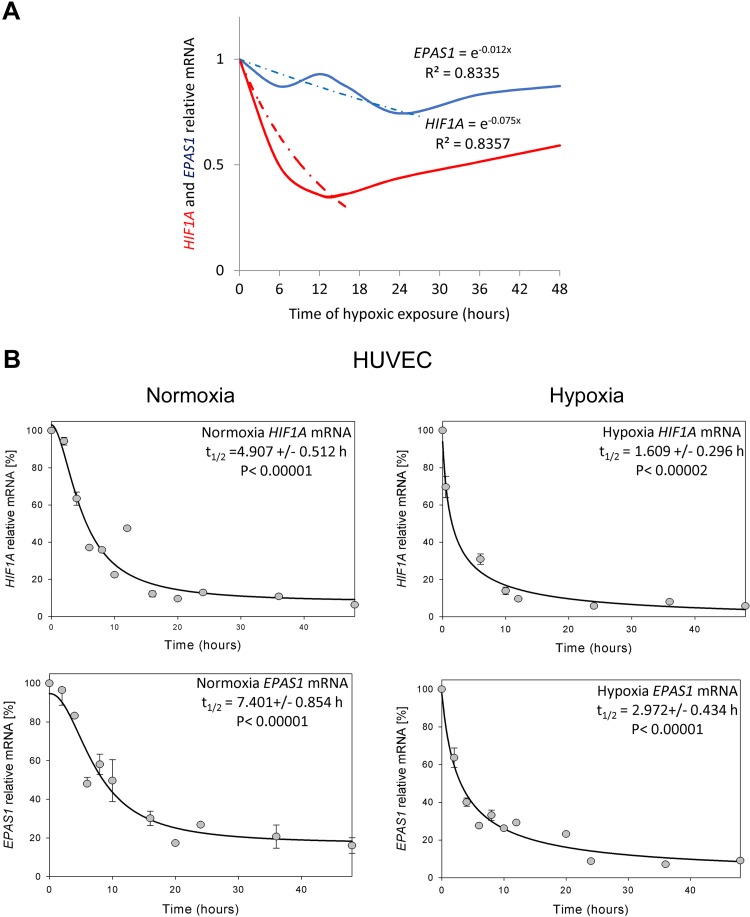
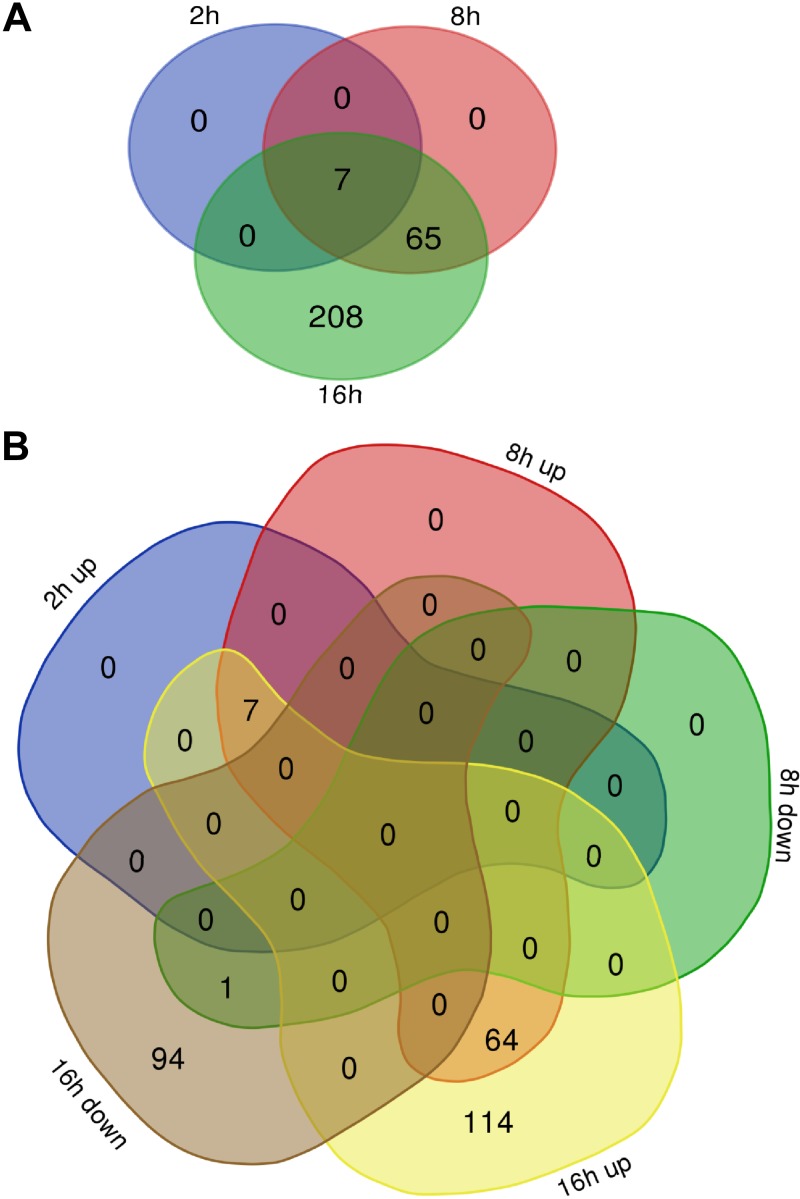
During hypoxia, a cellular adaptive response activates hypoxia-inducible factors (HIFs; HIF-1 and HIF-2) that respond to low tissue-oxygen levels and induce the expression of a number of genes that promote angiogenesis, energy metabolism, and cell survival. HIF-1 and HIF-2 regulate endothelial cell (EC) adaptation by activating gene-signaling cascades that promote endothelial migration, growth, and differentiation. An HIF-1 to HIF-2 transition or switch governs this process from acute to prolonged hypoxia. In the present study, we evaluated the mechanisms governing the HIF switch in 10 different primary human ECs from different vascular beds during the early stages of hypoxia. The studies demonstrate that the switch from HIF-1 to HIF-2 constitutes a universal mechanism of cellular adaptation to hypoxic stress and that HIF1A and HIF2A mRNA stability differences contribute to HIF switch. Furthermore, using 4 genome-wide mRNA expression arrays of HUVECs during normoxia and after 2, 8, and 16 h of hypoxia, we show using bioinformatics analyses that, although a number of genes appeared to be regulated exclusively by HIF-1 or HIF-2, the largest number of genes appeared to be regulated by both.-Bartoszewski, R., Moszyńska, A., Serocki, M., Cabaj, A., Polten, A., Ochocka, R., Dell'Italia, L., Bartoszewska, S., Króliczewski, J., Dąbrowski, M., Collawn, J. F. Primary endothelial cell-specific regulation of hypoxia-inducible factor (HIF)-1 and HIF-2 and their target gene expression profiles during hypoxia.

Keywords: human endothelial cells.


Conflict of interest statement

The authors thank Perlan Technologies, Polska Spółka z ograniczoną odpowiedzialnością (Sp. z o.o.) for performing microarray experiments and analysis. This research was funded by National Science Center SONATA BIS Program under contract UMO-2015/18/E/NZ3/00687 (to R.B.). J.F.C. was funded by the U.S. National Institutes of Health, National Institute of Diabetes and Digestive and Kidney Diseases Grant P30 DK072482, and a Research Development Program grant from the Cystic Fibrosis Foundation. The funders had no role in the design of the study; in the collection, analyses, or interpretation of data; in the writing of the manuscript; or in the decision to publish the results. The authors declare no conflicts of interest.

Figures

Figure 1
Figure 1
Hypoxia results in accumulation of HIF-1α and HIF-2α in human ECs. Cells were exposed to hypoxia for the time periods specified, and total RNA and protein lysates were collected. The changes in HIF-1α and HIF-2α protein levels were evaluated by Western blot normalized to β-actin and total protein levels and related to the normoxic control. The densitometry analyses are provided in Supplemental Fig. S1. HIAEC, human iliac EC; HPAEC, human pulmonary artery EC.
Figure 2
Figure 2
The hypoxic switch between HIF-1α and HIF-2α constitutes a universal mechanism of human endothelium adaptation to prolonged hypoxia. A) The mathematic representation of HIF-1α/HIF-2α switch in human ECs. The changes in HIF-1α (obtained from vascular or microvascular ECs) and HIF-2α levels (from all ECs tested) during hypoxia time course were analyzed using the logarithmic normal 3 parameter function (using 200 iterations, P < 0.005). The dashed lines represent predicted normoxic HIF levels. The error bars represent sd. B) The general model of endothelial HIF-1α/HIF-2α proposed based on the mathematical modeling. Max., maximum.
Figure 3
Figure 3
Hypoxia reduces HIF1A and EPAS1 mRNA levels in human ECs. Cells were exposed to hypoxia for the time periods specified, and total RNA lysates were collected. HIF1A and EPAS1 mRNA levels were quantified by quantitative real-time PCR and normalized to TBP and 18S rRNA levels and expressed as a fold change over normoxic samples. Data represent the mean ± sd of 2 independent experiments (3 replicates each). *P < 0.05 was considered significant. HIAEC, human iliac EC; HPAEC, human pulmonary artery EC.
Figure 4
Figure 4
Hypoxia reduces mRNA levels and half-lives of HIF1A and EPAS1. A) The mathematic representation of HIF1A and EPAS1 mRNA levels during hypoxia in human ECs. The changes in mRNA levels obtained from all ECs tested during hypoxia time course were analyzed using the natural exponential function. The dashed lines represent mathematically predicted reduction curves, whereas solid lines represent experimental data. B) HIF1A and EPAS1 mRNA half-life measurements were taken in HUVECs exposed to hypoxia and cultured in normoxia. Actinomycin D was added to stop transcription, after which the RNA was isolated, and total HIF1A and EPAS1 mRNA levels at each time point were measured by real-time PCR and normalized to endogenous 18S rRNA levels. mRNA values for each time point were calculated from 2 individual samples generated in at least 2 independent experiments. Relative HIF1A and EPAS1 mRNA levels at the time points indicated were plotted as percent differences from HIF1A and EPAS1 mRNA levels at the initial time point (t = 0). The mRNA half-lives were calculated from the exponential decay using the trend line equation C/C0 = e–kdt (where C and C0 are mRNA amounts at time t and at the t0, respectively, and kd is the mRNA decay constant). The error bars represent sd. P < 0.05 was considered significant.
Figure 5
Figure 5
Acute hypoxia has a different effect on the HUVECs’ genome-wide mRNA profiles compared with prolonged hypoxia. A) Venn diagram (41) represents the general distribution of unique transcripts significantly affected during 2, 8, and 16 h of hypoxia. B) The distribution of up-regulated and down-regulated mRNAs at each time point. The mRNA levels were expressed as log2 fold change relative to normoxic control, and the groups were compared with ANOVA to select transcripts significantly different between the normoxia and hypoxia groups (P < 0.005 was considered significant).
Figure 6
Figure 6
A higher HRE binding motif number is associated with an earlier response to hypoxia and to a specific HIF at the time of its maximum activity. A) Logos of the HIF-1 and HIF-2 HRE binding motifs (HOCOMOCO v.9) used in this analysis. B) Cumulative distribution functions of counts of HREs (HIF-1–specific and HIF-2–specific summed) per gene. Numbers of genes forming each group are given in brackets. C) Cumulative distribution functions of the numbers of HIF-1 and HIF-2 motif instances considered separately. The number of HIF-2 instances was significantly (K-S test, P = 0.00241) higher in the 8-h group than in the 16-h group. D) Cumulative distribution functions of the counts of HIF-1 and HIF-2 instances in the 8-h group. The number of HIF-2 instances was significantly (K-S test, P = 0.04891) higher than that of HIF-1 instances.
Figure 7
Figure 7
A) Majority of HRE motifs containing genes affected during hypoxia are mainly transcriptional targets of both HIF-1 and HIF-2. The genome-wide distribution of genes containing HRE sequences specific for HIF-1 (violet), HIF-2 (orange), or both (green) at different times of hypoxic exposure in HUVECs. B) Distributions of motif instances directed distances from the transcription start site (TSS) between genes containing only motifs for HIF-1 or only motifs for HIF-2 differ significantly (K-S test, P = 1.123 × 10⁻⁹). C) Distributions of distances of motifs for HIF-1 and of motifs for HIF-2 in genes containing both types of motifs do not differ significantly (K-S test, P = 0.7257).
Figure 8
Figure 8
A) Genes that mediate cellular responses to hypoxia are mainly transcriptional targets of both HIF-1 and HIF-2. Heat maps show the significant (P < 0.005) expression changes of unique HIF-1 (violet), HIF-2 (orange), and HIF-1/HIF-2 (green) regulated transcripts during 2, 8, and 16 h of hypoxia, and they were assigned with the GeneAnalytics database. These analysis results were verified with the literature (Supplemental Table S2). Heat maps were generated with Morpheus software. ADORA2A, adenosine A2a receptor; ALDOC, aldolase, fructose-bisphosphate C; ANG, angiogenin; ANGPTL4, angiopoietin-like 4; APOLD1, apolipoprotein L domain containing 1; BEX2, brain expressed X-linked 2; BNIP3, BCL2 interacting protein 3; BNIP3L, BCL2 interacting protein 3 like; CXCR4, C-X-C motif chemokine receptor 4; DUSP6, dual specificity phosphatase 6; EGLN3, Egl-9 family hypoxia inducible factor 3; EIF2B3, eukaryotic translation initiation factor 2B subunit γ; EIF4E, eukaryotic translation initiation factor 4E; EIF5B, eukaryotic translation initiation factor 5B; ENO2, enolase 2; EPOR, erythropoietin receptor; FLNA, filamin A; ING4, inhibitor of growth family member 4; MEF2D, myocyte enhancer factor 2D; MIR210HG, MIR210 host gene; NDRG1, N-Myc downstream regulated 1; NFATC4, nuclear factor of activated T-cell 4; NOP56, nucleolar protein 56; NOP58, nucleolar protein 58; NOX4, NADPH oxidase 4; P4HA2, prolyl 4-hydroxylase subunit alpha 2; PDK1, pyruvate dehydrogenase kinase 1; PFKFB4, 6-phosphofructo-2-kinase/fructose-2,6-biphosphatase 4; PGM1, phosphoglucomutase 1; P4HA1, prolyl 4-hydroxylase subunit α1; PTGIS, prostaglandin I2 synthase; RBM14, RNA binding motif protein 14; RBM28, RNA binding motif protein 28; RGCC, regulator of cell cycle; RRP9, ribosomal RNA processing 9; SLC2A1, solute carrier family 2 member 1; VEGFC, vascular endothelial growth factor C; WDR75, WD repeat domain 75.

References

    1. Koh M. Y., Powis G. (2012) Passing the baton: the HIF switch. Trends Biochem. Sci. 37, 364–372 - PMC - PubMed
    1. Wang G. L., Jiang B. H., Rue E. A., Semenza G. L. (1995) Hypoxia-inducible factor 1 is a basic-helix-loop-helix-PAS heterodimer regulated by cellular O2 tension. Proc. Natl. Acad. Sci. USA 92, 5510–5514 - PMC - PubMed
    1. Loboda A., Jozkowicz A., Dulak J. (2012) HIF-1 versus HIF-2--is one more important than the other? Vascul. Pharmacol. 56, 245–251 - PubMed
    1. Safran M., Kaelin W. G., Jr (2003) HIF hydroxylation and the mammalian oxygen-sensing pathway. J. Clin. Invest. 111, 779–783 - PMC - PubMed
    1. Kaelin W. G., Jr., Ratcliffe P. J. (2008) Oxygen sensing by metazoans: the central role of the HIF hydroxylase pathway. Mol. Cell 30, 393–402 - PubMed

Publication types

MeSH terms

Substances