. 2019 Mar 27;14(3):e0213374.
doi: 10.1371/journal.pone.0213374. eCollection 2019.

Reduced variability of neural progenitor cells and improved purity of neuronal cultures using magnetic activated cell sorting

Affiliations

Reduced variability of neural progenitor cells and improved purity of neuronal cultures using magnetic activated cell sorting

Kathryn R Bowles et al. PLoS One. .

Erratum in

Abstract

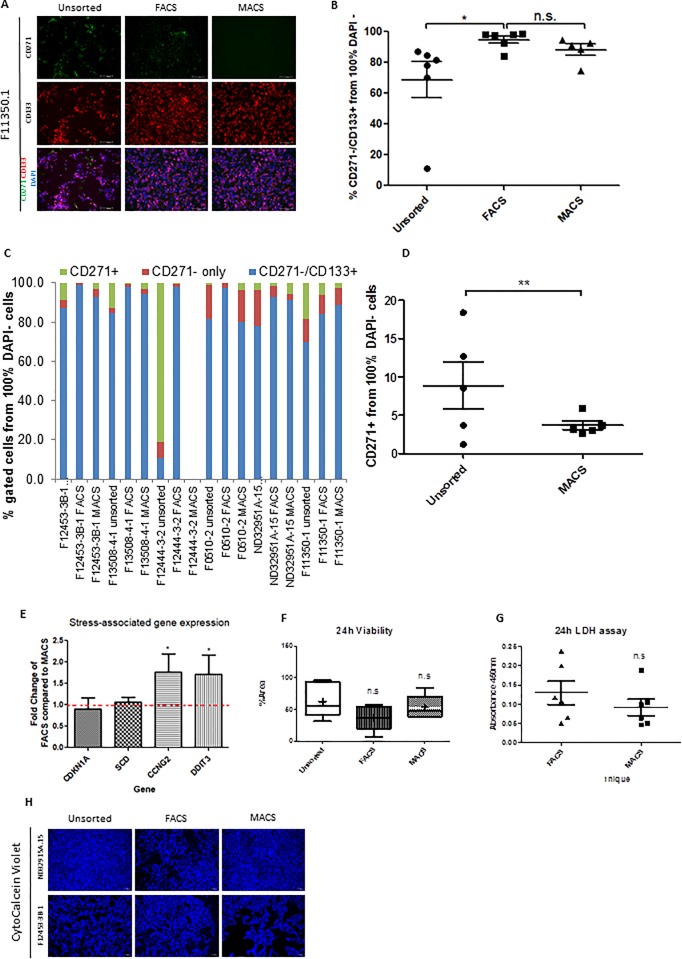
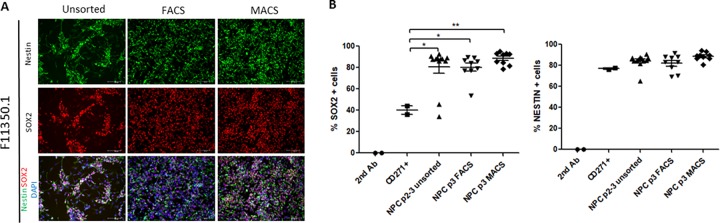
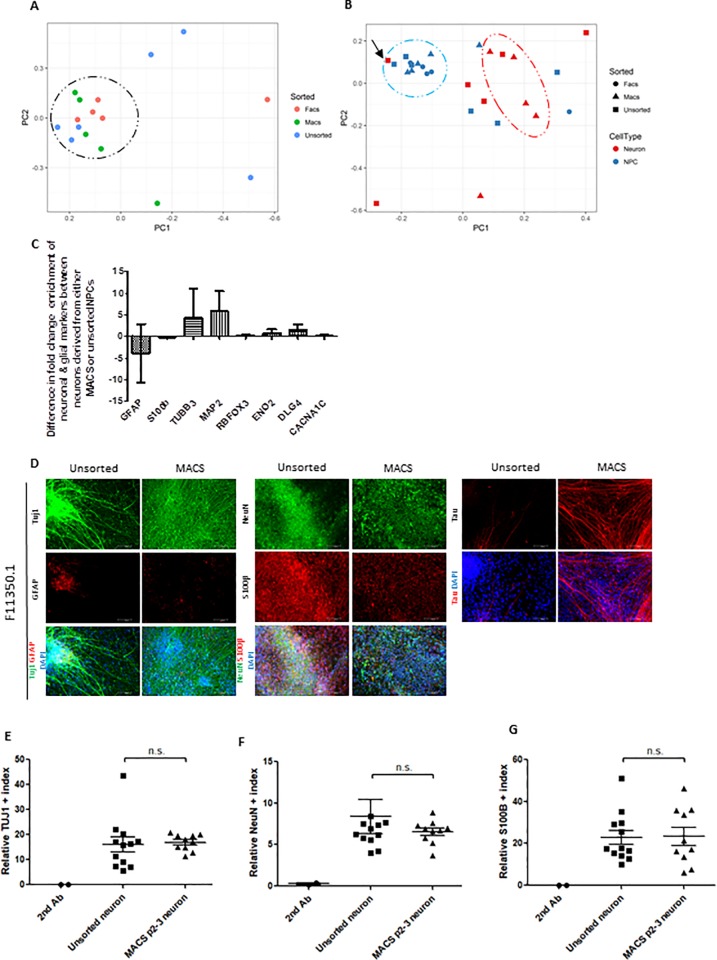
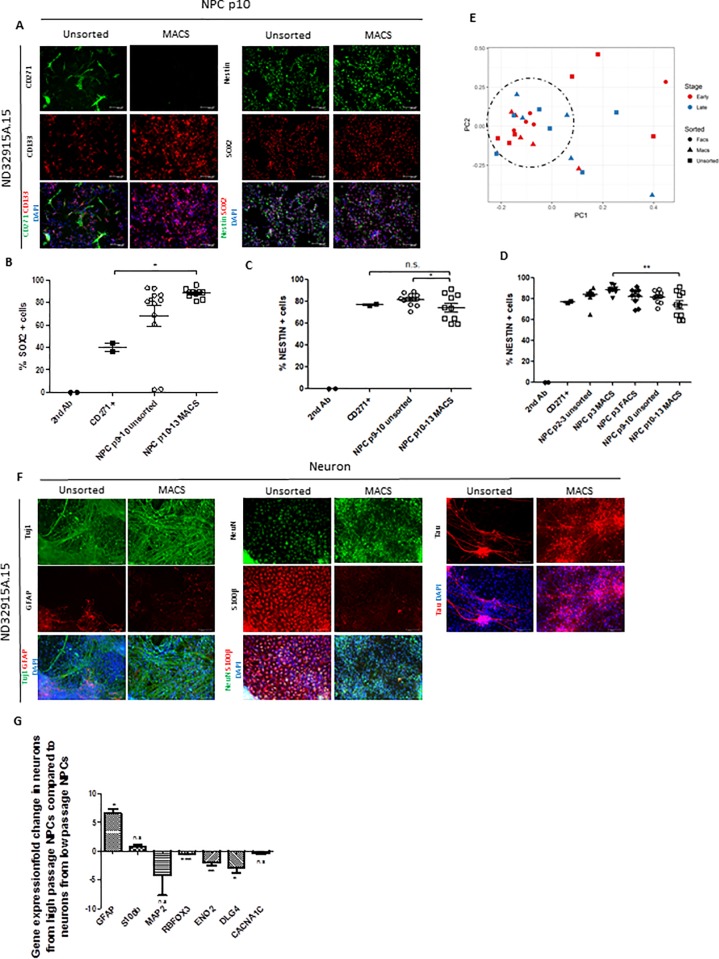
Genetic and epigenetic variability between iPSC-derived neural progenitor cells (NPCs) combined with differences in investigator technique and selection protocols contributes to variability between NPC lines, which subsequently impacts the quality of differentiated neuronal cultures. We therefore sought to develop an efficient method to reduce this variability in order to improve the purity of NPC and neuronal cultures. Here, we describe a magnetic activated cell sorting (MACS) method for enriching NPC cultures for CD271-/CD133+ cells at both early (<2-3) and late (>10) passage. MACS results in a similar sorting efficiency to fluorescence activated cell sorting (FACS), while achieving an increased yield of live cells and reduced cellular stress. Furthermore, neurons derived from MACS NPCs showed greater homogeneity between cell lines compared to those derived from unsorted NPCs. We conclude that MACS is a cheap technique for incorporation into standard NPC differentiation and maintenance protocols in order to improve culture homogeneity and consistency.


Conflict of interest statement

The authors have declared that no competing interests exist.

Figures

Fig 1
Fig 1. MACS reduces cell stress and improves live cell yield while maintaining an equivalent CD271-/CD133+ sorting efficiency as FACS.
(A) Representative immunofluorescence images from one NPC line demonstrating a reduction in CD271+ cells and an enrichment of CD133+ positive cells following both FACS and MACS compared to unsorted cells. Cell nuclei are labelled with DAPI. Scale bar = 100μm, N = 6. (B) Combined flow cytometry analysis of percent CD271+, CD271- and CD271-/CD133+ cells from 100% live cells (DAPI negative population) comparing unsorted, FACS and MACS conditions. (C) Flow cytometry analysis in B presented as individual cell lines. (D) Reduction in CD271+ cell variability following MACS compared to unsorted cells. **p<0.01 Variance F-test. (E) Fold change expression of stress-associated genes in cells following FACS compared to MACS. Dotted line denotes equal expression at fold change = 1. (F) Quantification of the percentage surface area covered by live cells imaged in D. (G) Absorbance read at 450nm of LDH assay carried out on media supernatant collected from cells 24 hours following either FACS or MACS sorting. (H) Cell viability assessed by Calcein Violet staining 24 hours following standard passage (unsorted) or following sorting by either FACS or MACS in two representative NPC lines with different survival responses. Scale bar = 100μm, *p<0.05, n.s = not significant. Error bars ± SEM.
Fig 2
Fig 2. CD271-/CD133+ cells are enriched for NPC markers Nestin and SOX2.
(A) Representative immunofluorescence images from one NPC line demonstrating the enrichment of Nestin and SOX2 positive cells following sorting by either FACS or MACS, compared to unsorted cells. Cell nuclei are labelled with DAPI. Scale bar = 100μm. (B). Flow cytometry analysis for SOX2 and NESTIN in unsorted cells, or following either FACS or MACS in all cell lines compared to CD271+ cells. *p<0.05, **p<0.01, Error bars ± SEM.
Fig 3
Fig 3. Sorting NPCs for CD271-/CD133+ cells increases homogeneity of gene expression patterns in NPCs and neurons across multiple cell lines, while enriching for neuronal-specific markers and depleting glial-specific markers in differentiated neuron cultures.
(A-B). Clustering of individual cell lines using multidimensional scaling analysis based on gene expression profiles from custom designed Taqman microfluidic cards. (A)Both FACS (red) and MACS (blue) increase gene expression homogeneity between NPC lines (indicated by black circle) compared to unsorted cells (green). (B) MACS (triangles) also improves gene expression homogeneity across different neuron populations (red), as indicated by the red oval, compared to unsorted cells (squares). NPC populations are colored in blue and the homogeneous cluster is indicated by a blue circle, FACS NPCs are circles. Neurons differentiated from the unsorted F12444-3-2 NPC line that failed both FACS and MACS sorting due to low levels of CD271-/CD133+ cells are indicated with a black arrow. (C) Comparison of gene expression of glial and neuronal specific markers in neurons derived from MACS NPCs compared to neurons derived from unsorted NPCs. (D) Representative immunofluorescence images of neurons derived from NPCs demonstrating the enrichment of neuronal markers Tuj1, NeuN and Tau, as well as the depletion of glial markers GFAP and S100β when differentiated from MACS NPCs compared to unsorted NPCs. Cell nuclei are labelled with DAPI. Scale bar = 100μm, N = 5. (E-F) Flow cytometry analysis for neuronal marker TUJ1 (E) and NeuN (F) on neurons derived from MACS NPCs compared to neurons from unsorted NPCs. Relative index for each marker is generated by the multiplication of total number of fluorescent positive cells and its median fluorescence intensity. (G) Relative index of astrocyte marker, S100β by flow cytometry analysis. *p<0.05, **p<0.01, n.s = not significant. Error bars ± SEM.
Fig 4
Fig 4. Late passage NPCs can be effectively enriched for CD271-/CD133+ cells by MACS, but still maintain a higher propensity for glial differentiation.
(A) Representative immunofluorescence images from a late passage NPC line demonstrating a visible reduction in CD271+ cells and an enrichment of CD133+ positive cells, as well as an enrichment of NPC markers following MACS. Cell nuclei are labelled with DAPI. Scale bar = 100μm. (B-C) Percentage of late passage NPCs positive for SOX2 (B) and NESTIN (C) as measured by flow cytometry analysis. The summary result is shown in unsorted and MACS NPCs compared to the secondary antibody control and CD271+ cells by pooled results of individual cell lines from S5B and S5C Fig. (D) Percent NESTIN+ cells by flow cytometry analysis in early (p2-3) and late passage (p10-13) NPCs. (E) Clustering of individual late passage NPC lines using multidimensional scaling analysis based on gene expression profiles from custom designed Taqman microfluidic cards. MACS (triangles) improves homogeneity across late passage (blue) cell lines compared to unsorted cell lines (squares), and exhibits similar gene expression profiles as early passage (red) MACS and FACS (circles) NPCs, indicated by a dotted circle. (F) Representative immunofluorescence images of neurons differentiated from one late passage NPC line demonstrating an enrichment of neuronal specific markers following MACS, but a maintenance of expression of glial-specific markers. Cell nuclei are labelled with DAPI. Scale bar = 100μm. (G) Comparison of gene expression of glial and neuronal specific markers in neurons derived from late passage MACS NPCs compared to neurons derived from early passage NPCs. *p<0.05, **p<0.01, ***p<0.001. Error bars ± SEM.

References

    1. Takahashi K, Yamanaka S. Induction of Pluripotent Stem Cells from Mouse Embryonic and Adult Fibroblast Cultures by Defined Factors. Cell. 2006;126: 663–676. 10.1016/j.cell.2006.07.024 - DOI - PubMed
    1. Takahashi K, Tanabe K, Ohnuki M, Narita M, Ichisaka T, Tomoda K, et al. Induction of Pluripotent Stem Cells from Adult Human Fibroblasts by Defined Factors. Cell. 2007;131: 861–872. 10.1016/j.cell.2007.11.019 - DOI - PubMed
    1. Haggarty SJ, Silva MC, Cross A, Brandon NJ, Perlis RH. Advancing Drug Discovery for Neuropsychiatric Disorders Using Patient-Specific Stem Cell Models. Mol Cell Neurosci. 2016;73: 104–115. 10.1016/j.mcn.2016.01.011 - DOI - PMC - PubMed
    1. Ghaffari LT, Starr A, Nelson AT, Sattler R. Representing Diversity in the Dish: Using Patient-Derived in Vitro Models to Recreate the Heterogeneity of Neurological Disease. Front Neurosci. 2018;12: 1–18. 10.3389/fnins.2018.00001 - DOI - PMC - PubMed
    1. McKinney CE. Using induced pluripotent stem cells derived neurons to model brain diseases. Neural Regen Res. 2017;12: 1062–1067. 10.4103/1673-5374.211180 - DOI - PMC - PubMed

Publication types

MeSH terms