. 2019 Mar 26;20(6):1509.
doi: 10.3390/ijms20061509.

Telomerase Impinges on the Cellular Response to Oxidative Stress Through Mitochondrial ROS-Mediated Regulation of Autophagy

Affiliations

Telomerase Impinges on the Cellular Response to Oxidative Stress Through Mitochondrial ROS-Mediated Regulation of Autophagy

Paula D Green et al. Int J Mol Sci. .

Abstract

Telomerase has cellular functions beyond telomere stabilization, including a role in mitochondria. The function of the catalytic component-TERT-in mitochondria is still unknown, but it seems to play a role in the response to oxidative stress. Here, we interrogated the role of the subcellular localization of TERT to the response to hydrogen peroxide (H₂O₂) treatment. Using normal human fibroblasts (NHF) expressing non-tagged wild type (WT) human TERT (hTERT) or nuclear localization and function (nuchTERT), a mutant that we previously described as being competent in telomere elongation, while not being able to localize to mitochondria, we found the differential activation of autophagy as a function of hTERT's subcellular localization. Specifically, we found that only cells expressing the mutant had significant increases in autophagy markers as a response to H₂O₂ challenge. Either the reintroduction of the mitochondrial pool of hTERT or the expression of mitochondrially-targeted catalase in mutant cells blunted the autophagic response under oxidative stress. Interestingly, autophagy activation was also associated with decreased levels of mitochondrial DNA damage. Taken together, these results suggest that the loss of hTERT in mitochondria initiates a signaling cascade that allows for cells to adapt to and cope with the lack of mitochondrial telomerase. Such effects also influence the cellular response to oxidative damage.

Keywords: autophagy; mitochondria; oxidative stress; telomerase.


Conflict of interest statement

The authors declare no conflict of interests.

Figures

Figure 1
Figure 1
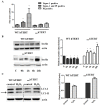
Autophagy and AMP-activated protein kinase (AMPK) are upregulated in nuclear localization and function (nuchTERT) under basal conditions due to lack of the mitochondrial localization of telomerase. (A and C) Expression levels of autophagy markers LC3-II and beclin in untreated cells. The position of LC3-II is indicated by thin black arrow, actin was used as the loading control. (B) Representative immunoblots (N = 3) of protein lysates from whole cell extracts and mitochondrial extracts from each corresponding cell line—wild type human TERT (WT hTERT), nuchTERT, and nuchTERT + WT. Tubulin was used to check for cytoplasmic contamination and Ku80 was used to check for nuclear contamination; mtHSP70 probed enrichment of the mitochondrial fraction. (D) Representative (N = 5) immunoblot analysis of phosphor-active AMPK in untreated normal human fibroblasts (NHF) WT hTERT, nuchTERT, and nuchTERT + WT cells. Total AMPK was used as loading control.
Figure 2
Figure 2
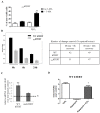
Autophagy is upregulated upon oxidative stress but only when hTERT does not enter mitochondria. (A) WT hTERT and nuchTERT were submitted to 60 min of 200 µM H2O2 treatment and allowed to recover in conditioned medium for 24 h. The cells were then harvested and assayed with Yopro-1 and propidium iodide to monitor apoptosis (YoPro-1) and cell death (propidium iodide) using flow cytometry. Graphs depict the mean of at least three biological experiments ± SEM. Student t-test was performed by comparing each corresponding cell death marker to its representative control. p value < 0.05 *. (B) WT hTERT and nuchTERT cells were subjected to 200 µM of H2O2 for 60 min (0 h), and allowed to recover at two, six, and 24 h. After the removal of H2O2 the cells were cultured in conditioned medium (medium in which cells had grown overnight containing cells released-growth factors) for the two, six, and 24 h recovery time points. Levels of beclin were normalized to actin. Graph represents the average of eight independent experiments ± SEM. Student t-test was performed by comparing each treated sample — 60 min H2O2 and the recovery time points to its respective control (untreated cells). Statistical significance was determined at p value < 0.05 * and 0.01 **. (C) LC3-II levels were assayed by immunoblots following H2O2 treatment in WT hTERT and nuchTERT expressing cells. The levels of LC3-II were normalized to actin. Graph shows average of 8 independent experiments ± SEM. Student t-test was performed by comparing each 60-minute H2O2 treatment to its respective untreated control. Statistical significance was p value < 0.01 **. (DE) Representative Western blot analysis of extracts from cells (WT hTERT and nuchTERT) untreated (control) and treated (200 µM H2O2 for 60 min) against phospho AMPKα (Thr172), AMPKα total, phospho p70S6K (Thr389) and p70S6K total antibodies. Graphs show average data from four independent experiments ± SEM. Phosphorylated AMPKα (Thr172) density was normalized to total AMPKα. Phosphorylated p70S6K density was normalized to total p70S6K. Student’s t-test was used to evaluate statistical significance. Student t-test compared each H2O2 treated hTERT expressing cells to its representative untreated control. Statistical significance was determined at a p value < 0.05 * and 0.01 **. (F) NHF parental cells were submitted to the same H2O2 treatment as above and autophagy markers analyzed. (GI) Representative Western blot analysis of extracts from cells (WT hTERT, nuchTERT, and nuchTERT + WT) untreated (control) and treated (200 µM H2O2 for 60 min) against beclin, phospho AMPKα (Thr172), AMPKα total, phospho p70S6K (Thr389), and p70S6K total antibody. Actin was also included as loading control for beclin. Graphs show average data from three experiments ± SEM. Student’s t-test was used to evaluate statistical significance and then compared each untreated (control) to its respective H2O2 treatment. Statistical significance was determined at a p value < 0.05 * and 0.01 **.
Figure 2
Figure 2
Autophagy is upregulated upon oxidative stress but only when hTERT does not enter mitochondria. (A) WT hTERT and nuchTERT were submitted to 60 min of 200 µM H2O2 treatment and allowed to recover in conditioned medium for 24 h. The cells were then harvested and assayed with Yopro-1 and propidium iodide to monitor apoptosis (YoPro-1) and cell death (propidium iodide) using flow cytometry. Graphs depict the mean of at least three biological experiments ± SEM. Student t-test was performed by comparing each corresponding cell death marker to its representative control. p value < 0.05 *. (B) WT hTERT and nuchTERT cells were subjected to 200 µM of H2O2 for 60 min (0 h), and allowed to recover at two, six, and 24 h. After the removal of H2O2 the cells were cultured in conditioned medium (medium in which cells had grown overnight containing cells released-growth factors) for the two, six, and 24 h recovery time points. Levels of beclin were normalized to actin. Graph represents the average of eight independent experiments ± SEM. Student t-test was performed by comparing each treated sample — 60 min H2O2 and the recovery time points to its respective control (untreated cells). Statistical significance was determined at p value < 0.05 * and 0.01 **. (C) LC3-II levels were assayed by immunoblots following H2O2 treatment in WT hTERT and nuchTERT expressing cells. The levels of LC3-II were normalized to actin. Graph shows average of 8 independent experiments ± SEM. Student t-test was performed by comparing each 60-minute H2O2 treatment to its respective untreated control. Statistical significance was p value < 0.01 **. (DE) Representative Western blot analysis of extracts from cells (WT hTERT and nuchTERT) untreated (control) and treated (200 µM H2O2 for 60 min) against phospho AMPKα (Thr172), AMPKα total, phospho p70S6K (Thr389) and p70S6K total antibodies. Graphs show average data from four independent experiments ± SEM. Phosphorylated AMPKα (Thr172) density was normalized to total AMPKα. Phosphorylated p70S6K density was normalized to total p70S6K. Student’s t-test was used to evaluate statistical significance. Student t-test compared each H2O2 treated hTERT expressing cells to its representative untreated control. Statistical significance was determined at a p value < 0.05 * and 0.01 **. (F) NHF parental cells were submitted to the same H2O2 treatment as above and autophagy markers analyzed. (GI) Representative Western blot analysis of extracts from cells (WT hTERT, nuchTERT, and nuchTERT + WT) untreated (control) and treated (200 µM H2O2 for 60 min) against beclin, phospho AMPKα (Thr172), AMPKα total, phospho p70S6K (Thr389), and p70S6K total antibody. Actin was also included as loading control for beclin. Graphs show average data from three experiments ± SEM. Student’s t-test was used to evaluate statistical significance and then compared each untreated (control) to its respective H2O2 treatment. Statistical significance was determined at a p value < 0.05 * and 0.01 **.
Figure 3
Figure 3
WT hTERT accumulates more mtDNA that nuchTERT-expressing cells upon oxidative stress. (A) The nuchTERT cells were pretreated with the autophagy inhibitor 3-MA for 48 h and then treated with 60 min H2O2. In addition, the cells were allowed to recover for an additional 24 h in condition media with and without the presence of 3-MA. Cell viability was determined by PI and flow cytometry. Graph represents mean of four separate biological experiments ± SEM. Student t-test was performed comparing the vehicle (no 3MA) + H2O2 to its respective control and 3MA + H2O2 to 3MA + no H2O2. Statistical significance was determined at a p value < 0.01 **. (B) WT and the nuchTERT cells were exposed to 200 µM of H2O2 for 60 min and then allowed to recover for six and 24 h. Total genomic DNA was isolated and the mtDNA integrity was analyzed. Data was normalized to mtDNA copy number. The results represent the mean of three experiments. (C) Total genomic DNA was extracted from WT hTERT and nuchTERT non-treated or immediately following 60 min H2O2 treatment when mtDNA content was analyzed. Graphs show average data from three independent biological experiments ± SEM. Student t-test compared mtDNA content at 60 min as compared to non-treated control. Statistical significance was determined at p value < 0.01 **. The dotted line represents non-treated control. (D) Quantification of mtDNA damage per 10 kb DNA by QPCR. WT hTERT expressing cells were exposed to 200 µM of H2O2 for 60 min in the presence or absence of the autophagy modulator rapamycin. The samples were pretreated for one hour with rapamycin and then exposed to H2O2 (H2O2 + rapamycin) for an additional hour. Graphs show an average from four independent experiments ± SEM. Student t-test compared levels of mtDNA detected in the rapamycin + H2O2 compared to H2O2 treatment alone. Statistical significance was determined at p value < 0.05 *. Data were normalized to mtDNA content.
Figure 4
Figure 4
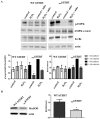
Lack of upregulation of autophagy in WT hTERT is not due to defects in signaling. The WT hTERT cells were put under conditions of nutrient deprivation (ND) or treated with 10 nM rapamycin (an mTOR inhibitor) for two hours. Autophagy activation was evaluated utilizing the LC3-II and AMPK antibodies. Phosphorylation of p70S6K (Thr 389), which is a downstream target of mTOR and classically used as a surrogate of mTOR activity, was probed. Actin was used as loading control. Graphs show average data from three independent experiments ± SEM. Student t-test as compared nutrient deprivation and rapamycin to untreated WT hTERT control. Statistical significance was determined at a p value < 0.05 * and 0.01 **.
Figure 5
Figure 5
Expression of mitochondrially-targeted catalase blunts AMPK activation and autophagy in nuchTERT-expressing cells. (A) WT hTERT and nuchTERT cells were infected with an adenovirus expressing mitocatalase and 24h later cells were treated with H2O2 for 60 min. Beclin and AMPK levels were evaluated through immunoblot analysis. Actin was used as loading control. Western blots are representative; graphs are the mean of four biological experiments ± SEM. Student t-test compared control untreated to control mitocatalase and so forth. Statistical significance was determined at a p value < 0.05 *. Protein extracts were taken from untreated WT hTERT and nuchTERT cells. Actin was used to normalize data. The graph represents the mean of three independent experiments. Student t-test compared either cell type to the untreated samples. Statistical significance was determined at a p value < 0.05 *. (B) Levels of MnSOD were assayed by immunoblots in the cells and actin was used as loading control to normalize MnSOD amounts The graph represents the mean of three independent experiments; student t-test compared levels in WT to mutant cells. p value < 0.05 *.

References

    1. Santos J.H., Meyer J.N., Skorvaga M., Annab L.A., Van Houten B. Mitochondrial hTERT exacerbates free-radical-mediated mtDNA damage. Aging Cell. 2004;3:399–411. doi: 10.1111/j.1474-9728.2004.00124.x. - DOI - PubMed
    1. Santos J.H., Meyer J.N., Van Houten B. Mitochondrial localization of telomerase as a determinant for hydrogen peroxide-induced mitochondrial DNA damage and apoptosis. Hum. Mol. Genet. 2006;15:1757–1768. doi: 10.1093/hmg/ddl098. - DOI - PubMed
    1. Sharma N.K., Reyes A., Green P., Caron M.J., Bonini M.G., Gordon D.M., Holt I.J., Santos J.H. Human telomerase acts as a hTR-independent reverse transcriptase in mitochondria. Nucleic Acids Res. 2012;40:712–725. doi: 10.1093/nar/gkr758. - DOI - PMC - PubMed
    1. Singhapol C., Pal D., Czapiewski R., Porika M., Nelson G., Saretzki G.C. Mitochondrial telomerase protects cancer cells from nuclear DNA damage and apoptosis. PLoS ONE. 2013;8:e52989. doi: 10.1371/journal.pone.0052989. - DOI - PMC - PubMed
    1. Listerman I., Sun J., Gazzaniga F.S., Lukas J.L., Blackburn E.H. The major reverse transcriptase-incompetent splice variant of the human telomerase protein inhibits telomerase activity but protects from apoptosis. Cancer Res. 2013;73:2817–2828. doi: 10.1158/0008-5472.CAN-12-3082. - DOI - PMC - PubMed

LinkOut - more resources