. 2019 Mar 26;19(6):1480.
doi: 10.3390/s19061480.

Continuous Analysis of Running Mechanics by Means of an Integrated INS/GPS Device

Affiliations

Continuous Analysis of Running Mechanics by Means of an Integrated INS/GPS Device

Pavel Davidson et al. Sensors (Basel). .

Abstract

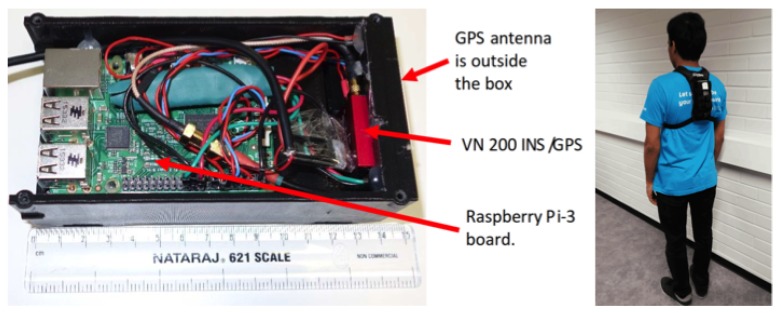
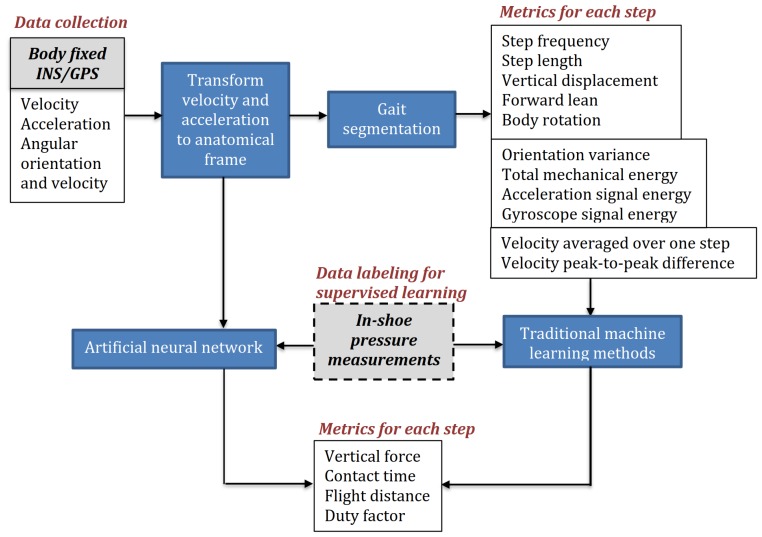
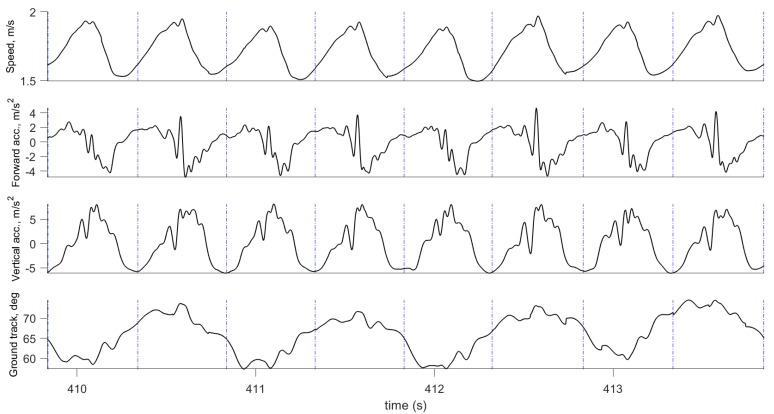
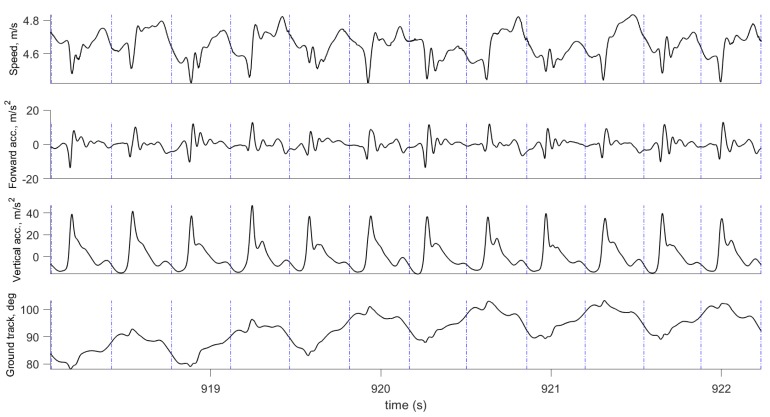
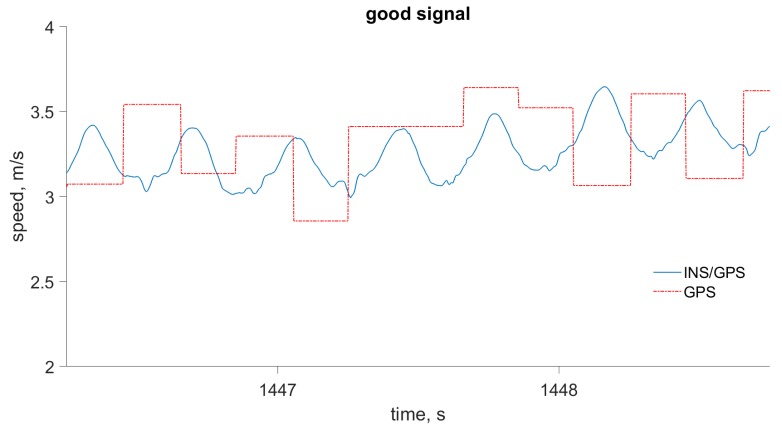
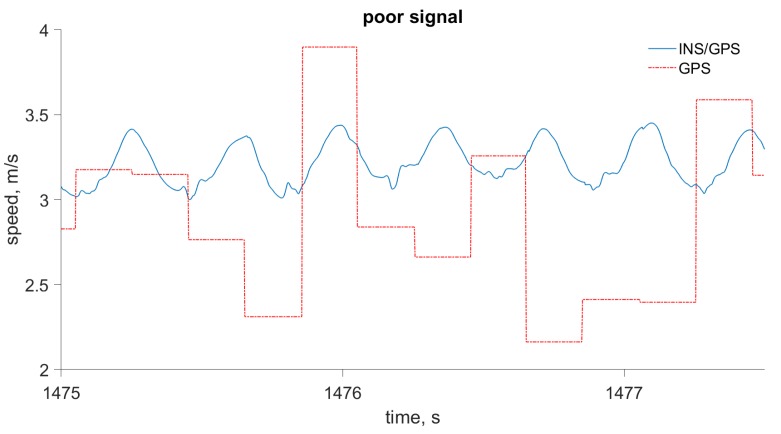
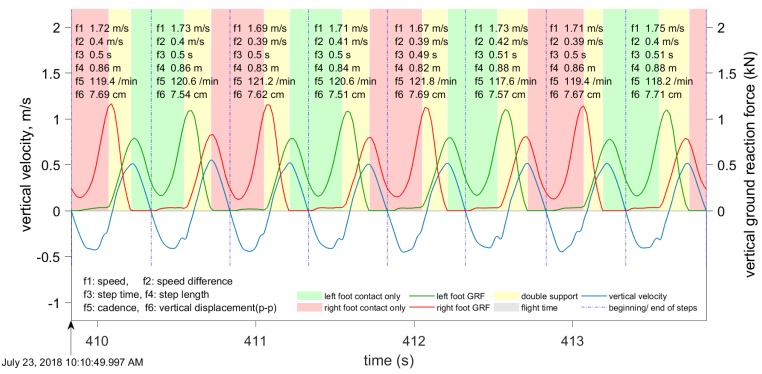
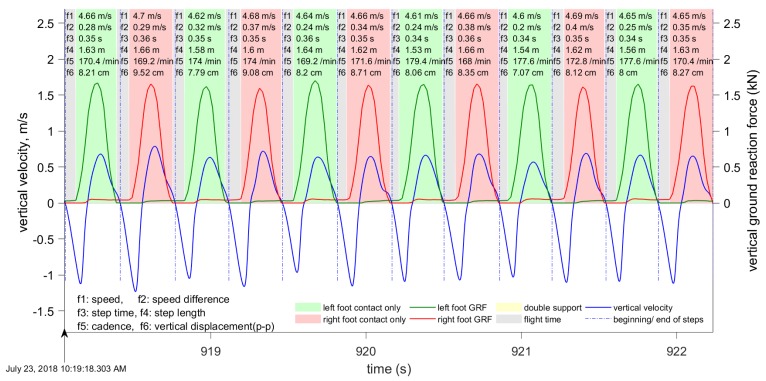
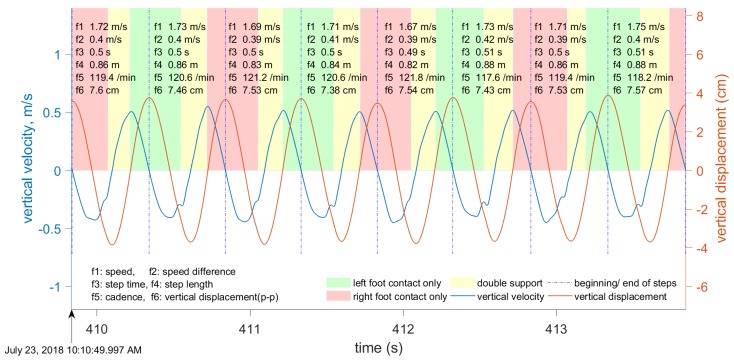
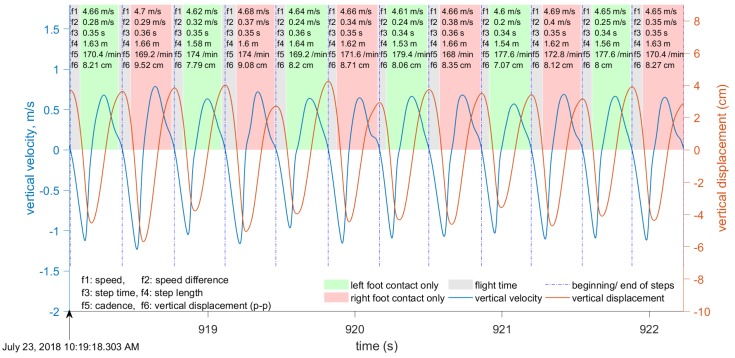
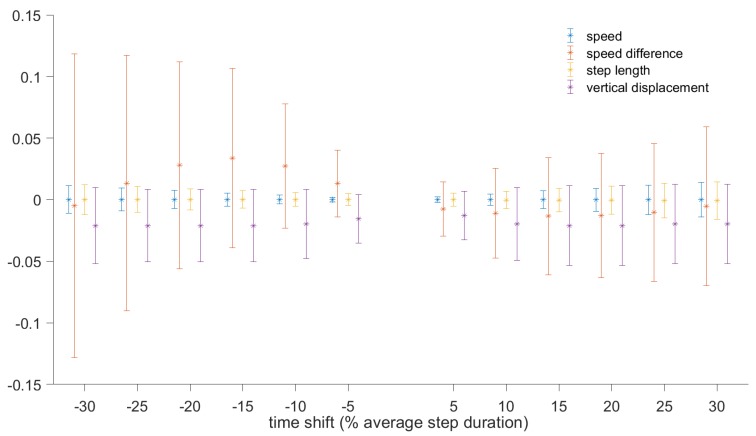
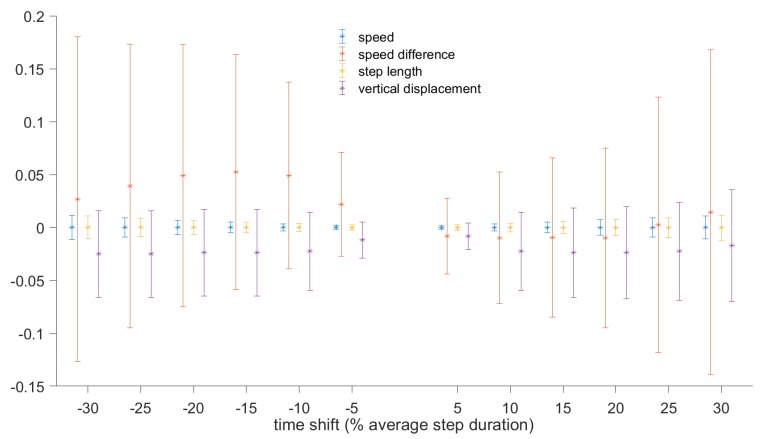
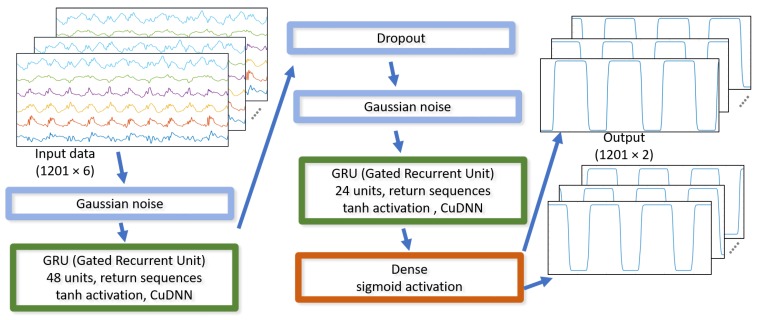
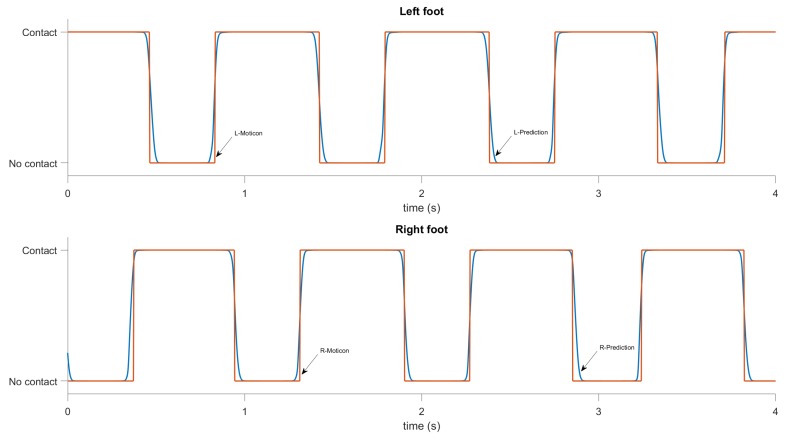
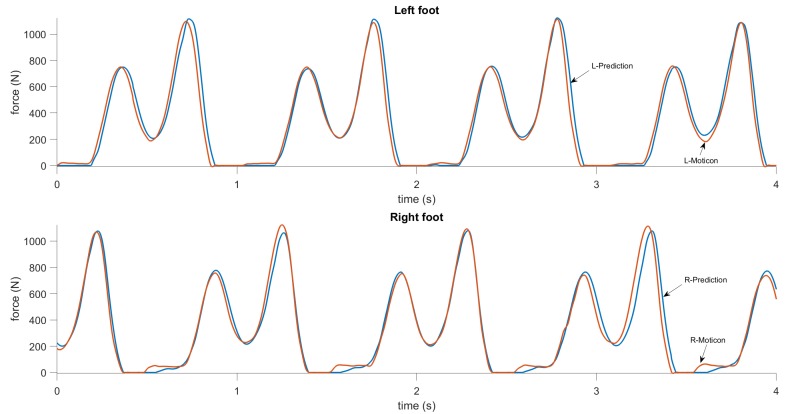
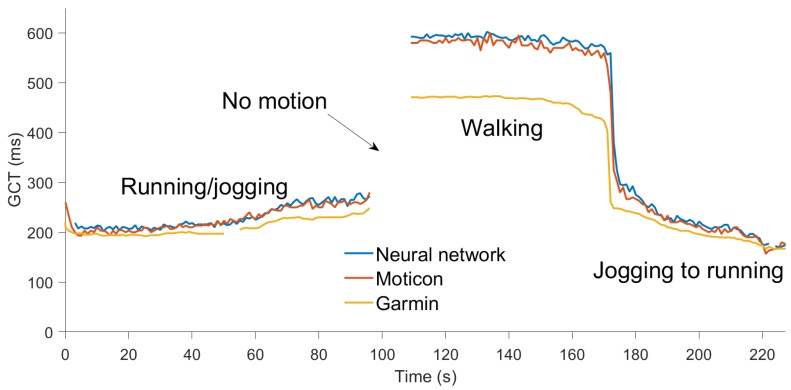
This paper describes a single body-mounted sensor that integrates accelerometers, gyroscopes, compasses, barometers, a GPS receiver, and a methodology to process the data for biomechanical studies. The sensor and its data processing system can accurately compute the speed, acceleration, angular velocity, and angular orientation at an output rate of 400 Hz and has the ability to collect large volumes of ecologically-valid data. The system also segments steps and computes metrics for each step. We analyzed the sensitivity of these metrics to changing the start time of the gait cycle. Along with traditional metrics, such as cadence, speed, step length, and vertical oscillation, this system estimates ground contact time and ground reaction forces using machine learning techniques. This equipment is less expensive and cumbersome than the currently used alternatives: Optical tracking systems, in-shoe pressure measurement systems, and force plates. Another advantage, compared to existing methods, is that natural movement is not impeded at the expense of measurement accuracy. The proposed technology could be applied to different sports and activities, including walking, running, motion disorder diagnosis, and geriatric studies. In this paper, we present the results of tests in which the system performed real-time estimation of some parameters of walking and running which are relevant to biomechanical research. Contact time and ground reaction forces computed by the neural network were found to be as accurate as those obtained by an in-shoe pressure measurement system.

Keywords: INS/GPS; gait analysis; machine learning; neural networks; sports equipment; velocity measurement.


Conflict of interest statement

The authors declare no conflict of interest. The funders had no role in the design of the study; in the collection, analyses, or interpretation of data; in the writing of the manuscript, or in the decision to publish the results.

Figures

Figure 1
Figure 1
The data logger includes a Vectornav VN-200 inertial navigation system (INS)/GPS, a GPS antenna, a Raspberry Pi 3, and a battery. The battery is under the board. The data logger placement during field tests is on the right image. The GPS antenna is pointing upwards.
Figure 2
Figure 2
The system architecture. An optional in-shoe pressure measurement system provides a dataset for training and validation of machine learning methods that can be used for indirect estimation of ground contact time (GCT) and ground reaction forces (GRF).
Figure 3
Figure 3
Motion parameters computed by the INS/GPS system for walking: Speed, forward and vertical accelerations, and ground track. Vertical lines show the beginning of the gait cycle.
Figure 4
Figure 4
Motion parameters computed by the INS/GPS system for running: Speed, forward and vertical accelerations, and ground track. Vertical lines show the beginning of the gait cycle.
Figure 5
Figure 5
Walking speed computed by the INS/GPS integrated system and by the GPS receiver only. The plot shows the typical velocity accuracy for a consumer-grade single frequency GPS receiver.
Figure 6
Figure 6
Walking speed computed by the INS/GPS integrated system and by the GPS receiver only. The plot shows degraded velocity accuracy for the same GPS receiver.
Figure 7
Figure 7
The segmentation of gait during walking, based on the vertical velocity. The plot shows the vertical velocity (blue), left (green), and right (red) foot force measurements. The following six metrics are displayed for each step: Speed averaged over one step, speed difference peak-to-peak, cadence, step length, step duration, and vertical displacement peak-to-peak.
Figure 8
Figure 8
The segmentation of gait during running, based on the vertical velocity. Curves and metrics as in Figure 7.
Figure 9
Figure 9
Vertical velocity (blue) and displacement (red) during walking. The following six metrics are displayed for each step: Speed averaged over one step, speed difference peak-to-peak, cadence, step length, step duration, and vertical displacement peak-to-peak.
Figure 10
Figure 10
Vertical velocity (blue) and displacement (red) during running. The displayed metrics are as in Figure 9.
Figure 11
Figure 11
Relative error in speed, speed difference, step length, and vertical displacement to the beginning of the gait cycle. The results are based on 500 steps during walking.
Figure 12
Figure 12
Relative error in speed, speed difference, step length, and vertical displacement caused by a shift in the gait cycle beginning. The results are based on 1000 steps during mix of walking and running.
Figure 13
Figure 13
The recurrent neural network implementation.
Figure 14
Figure 14
GCT predictions, computed by the recurrent neural network during walking. The upper plot shows the predicted (blue) and reference (red) ground contact for the left foot, and the lower plot shows the same for the right foot.
Figure 15
Figure 15
GRF predictions, computed by the recurrent neural network during walking. The upper plots show the predicted (blue) and reference (red) GRF for the left foot, and the lower plots show the same for the right foot.
Figure 16
Figure 16
Ground contact time computed by Moticon insoles (red), the Garmin HRM-Run (amber), and indirect estimation using the neural network (blue) during walking, jogging, and running.
Figure 17
Figure 17
Vertical oscillation computed by the Garmin HRM-Run (amber) and by our device (blue) during walking, jogging, and running.

References

    1. Fleming P., Young C., Dixon S., Carré M. Athlete and coach perceptions of technology needs for evaluating running performance. Sport. Eng. 2010;13:1–18. doi: 10.1007/s12283-010-0049-9. - DOI
    1. Sutherland D.H. The evolution of clinical gait analysis: Part II Kinematics. Gait Posture. 2002;16:159–179. doi: 10.1016/S0966-6362(02)00004-8. - DOI - PubMed
    1. Sutherland D.H. The evolution of clinical gait analysis: Part III—Kinetics and energy assessment. Gait Posture. 2005;21:447–461. doi: 10.1016/j.gaitpost.2004.07.008. - DOI - PubMed
    1. Aminian K., Najafi B. Capturing human motion using body-fixed sensors: Outdoor measurement and clinical applications. Comput. Animat. Virtual Worlds. 2004;15:79–94. doi: 10.1002/cav.2. - DOI
    1. Benson L.C., Clermont C.A., Osis S.T., Kobsar D., Ferber R. Classifying running speed conditions using a single wearable sensor: Optimal segmentation and feature extraction methods. J. Biomech. 2018;71:94–99. doi: 10.1016/j.jbiomech.2018.01.034. - DOI - PubMed

Grants and funding

LinkOut - more resources