. 2019 Mar 27;21(1):21.
doi: 10.1186/s12968-019-0531-x.

Kidney transplantation is associated with reduced myocardial fibrosis. A cardiovascular magnetic resonance study with native T1 mapping

Affiliations

Kidney transplantation is associated with reduced myocardial fibrosis. A cardiovascular magnetic resonance study with native T1 mapping

Mariana Moraes Contti et al. J Cardiovasc Magn Reson. .

Abstract

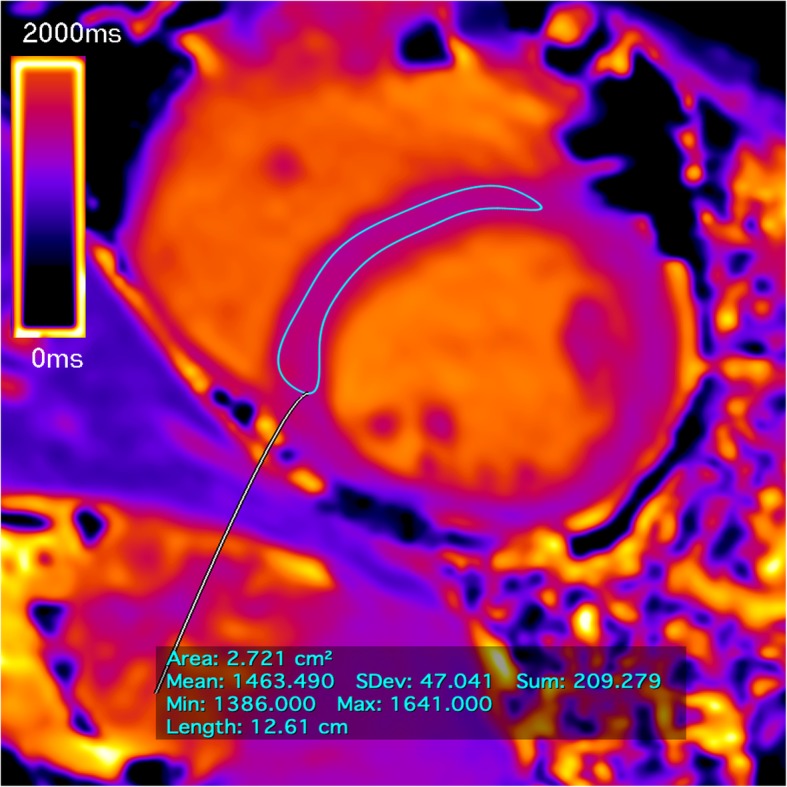
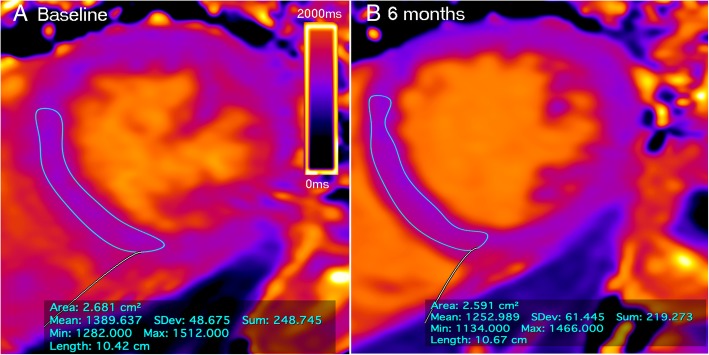
Background: The measurement of native T1 through cardiovascular magnetic resonance (CMR) is a noninvasive method of assessing myocardial fibrosis without gadolinium contrast. No studies so far have evaluated native T1 after renal transplantation. The primary aim of the current study is to assess changes in the myocardium native T1 6 months after renal transplantation.

Methods: We prospectively evaluated 44 renal transplant patients with 3 T CMR exams: baseline at the beginning of transplantation and at 6 months after transplantation.

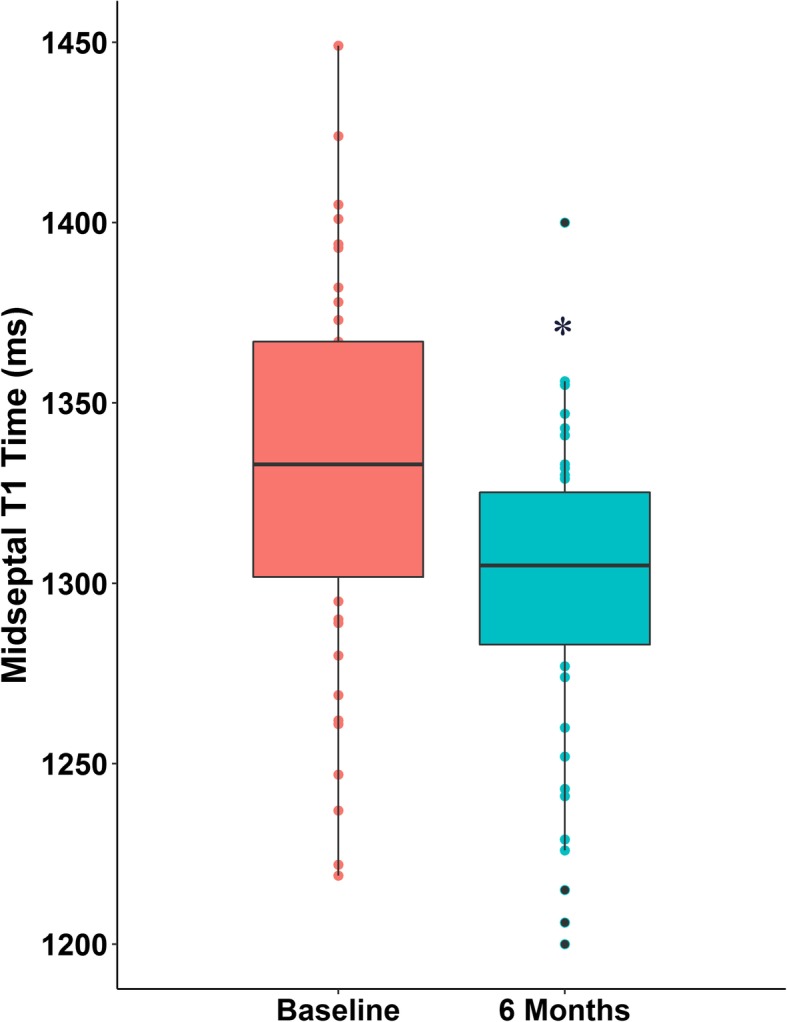
Results: The native T1 time was measured in the midventricular septum and decreased significantly from 1331 ± 52 ms at the baseline to 1298 ± 42 ms 6 months after transplantation (p = 0.001). The patients were split into two groups through a two-step cluster algorithm: In cluster-1 (n = 30) the left ventricular (LV) mass index and the prevalence of diabetes were lower. In cluster-2 (n = 14) the LV mass index and diabetes prevalence were higher. Decrease in native T1 values was significant only in the patients in cluster-1 (p = 0.001).

Conclusions: The native myocardial T1 time decreased significantly 6 months after renal transplant, which may be associated with the regression of the reactive fibrosis. The patients with greater baseline LV mass index and the diabetic group did not reach a significant decrease in T1.

Keywords: Cardiovascular magnetic resonance imaging; Fibrosis; Kidney transplantation; Native T1.


Conflict of interest statement

Ethics approval and consent to participate

The protocol was reviewed and approved by the institutional review board (CAAE: 40598414.9.0000.5411).

Consent for publication

Written informed consent was obtained from the patients before participation.

Competing interests

The authors declare that they have no competing interests.

Publisher’s Note

Springer Nature remains neutral with regard to jurisdictional claims in published maps and institutional affiliations.

Figures

Fig. 1
Fig. 1
Example of T1 septal mapping. The thin line denotes the manually contoured region of interest (ROI) in the midventricular septum. The box shows the measures of T1 value by automatic computer average of the pixels. The color map scale represents the values in milliseconds (blue corresponds to smaller values and yellow to higher values). Data acquired with the modified look-locker inversion recovery (MOLLI) T1 mapping sequence at a field strength of 3 T
Fig. 2
Fig. 2
Boxplot comparing midventricular septum T1 time at baseline and 6 months after transplantation.* p < 0.001 x baseline
Fig. 3
Fig. 3
Example of native T1 mapping in a 38-year-old deceased-donor kidney transplant patient. The T1 value changing from 1389 ms (a) to 1252 ms (b) showing a decrease 6 months after transplantation (visual pattern with increased blue staining, patient id = 3).The thin line denotes the manually contoured region of interest (ROI) in the midventricular septum. The box shows the measures of T1 value by automatic computer average of the pixels. The color map scale represents the values in milliseconds (blue corresponds to smaller values and yellow to higher values). Data acquired with the modified look-locker inversion recovery (MOLLI) T1 mapping sequence at field strength of 3 T
Fig. 4
Fig. 4
Boxplot comparing midventricular septum T1 time at baseline and 6 months after transplantation splitted into two groups. The groups were wrapped by a cluster analysis designed to reveal natural groupings within a dataset that would otherwise not be apparent. The majority of patients in cluster-2 were diabetics and the patients with greater baseline left ventricular mass index. * p = 0.001 x baseline

References

    1. Baigent C, Burbury K, Wheeler D. Premature cardiovascular disease in chronic renal failure. Lancet. 2000;356:147–152. doi: 10.1016/S0140-6736(00)02456-9. - DOI - PubMed
    1. Cavalcante LG, Ricardo de Souza C, Kochi AC. Left ventricular mass behaviour in hemodialysis patients during 17 years. J Bras Nefrol. 2014;37:341–348. - PubMed
    1. Wolfe RA, Ashby VB, Milford EL. Comparison of mortality in all patients on dialysis, patients on dialysis awaiting transplantation, and recipients of a first cadaveric transplant. N Engl J Med. 1999;341:1725–1730. doi: 10.1056/NEJM199912023412303. - DOI - PubMed
    1. Mall G, Huther W, Schneider J, Lundin P, Ritz E. Diffuse intermyocardiocytic fibrosis in uraemic patients. Nephrol Dial Transpl. 1990;5:39–44. doi: 10.1093/ndt/5.1.39. - DOI - PubMed
    1. Ter Maaten JM, Damman K, Verhaar MC, Paulus WJ, Duncker DJ, Cheng C, et al. Connecting heart failure with preserved ejection fraction and renal dysfunction: the role of endothelial dysfunction and inflammation. Eur J Heart Fail. 2016;18:588–598. doi: 10.1002/ejhf.497. - DOI - PubMed

Publication types

MeSH terms