. 2019 Mar 27;11(1):54.
doi: 10.1186/s13148-019-0651-z.

Exploring targets of TET2-mediated methylation reprogramming as potential discriminators of prostate cancer progression

Affiliations

Exploring targets of TET2-mediated methylation reprogramming as potential discriminators of prostate cancer progression

Shivani Kamdar et al. Clin Epigenetics. .

Abstract

Background: Global DNA methylation alterations are hallmarks of cancer. The tumor-suppressive TET enzymes, which are involved in DNA demethylation, are decreased in prostate cancer (PCa); in particular, TET2 is specifically targeted by androgen-dependent mechanisms of repression in PCa and may play a central role in carcinogenesis. Thus, the identification of key genes targeted by TET2 dysregulation may provide further insight into cancer biology.

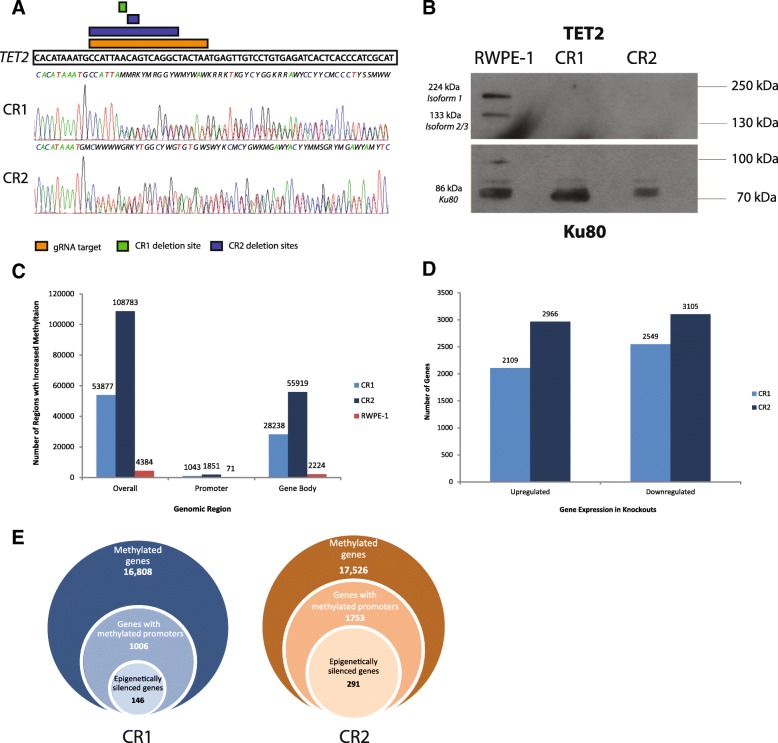
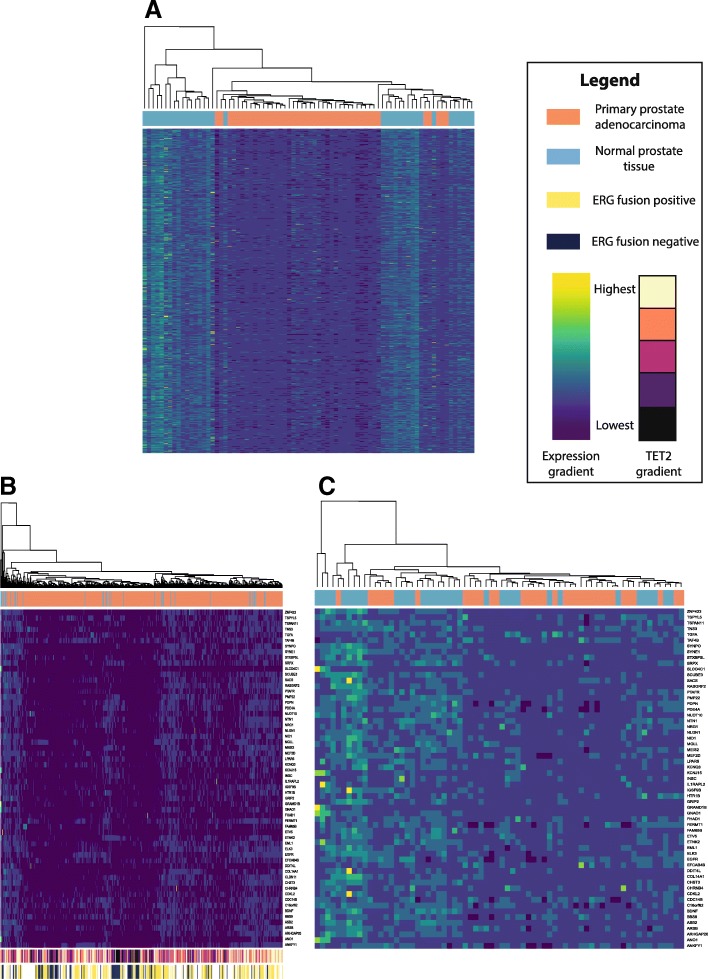
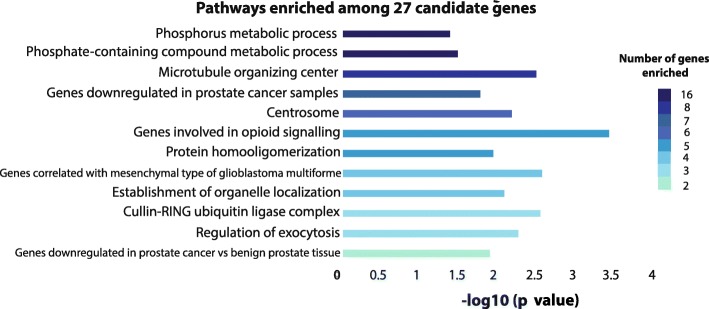
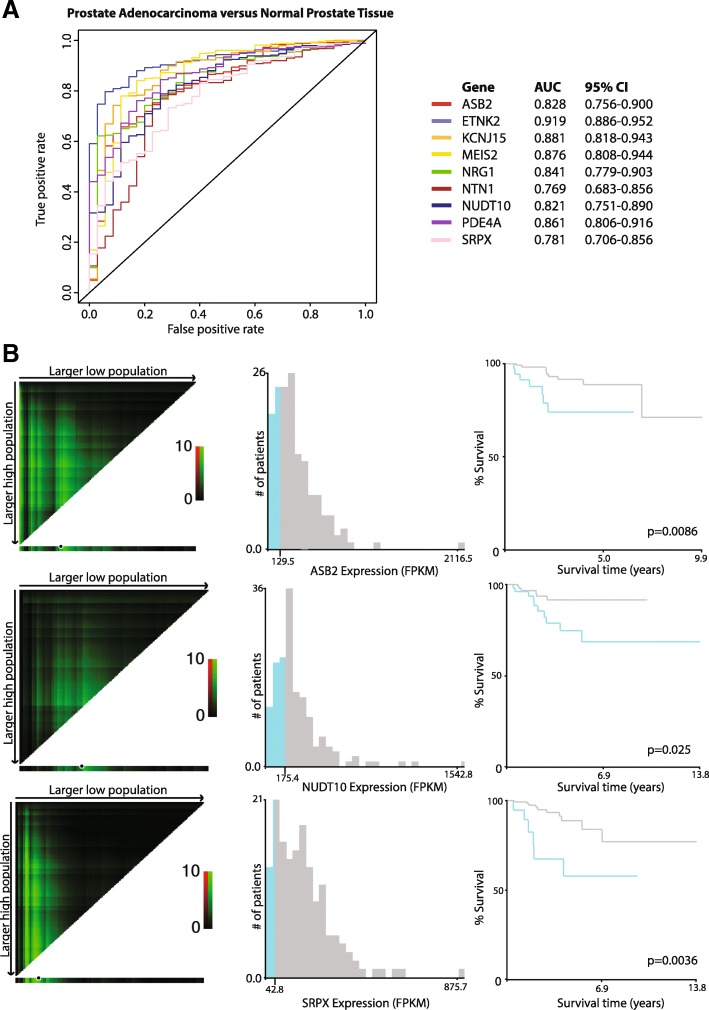
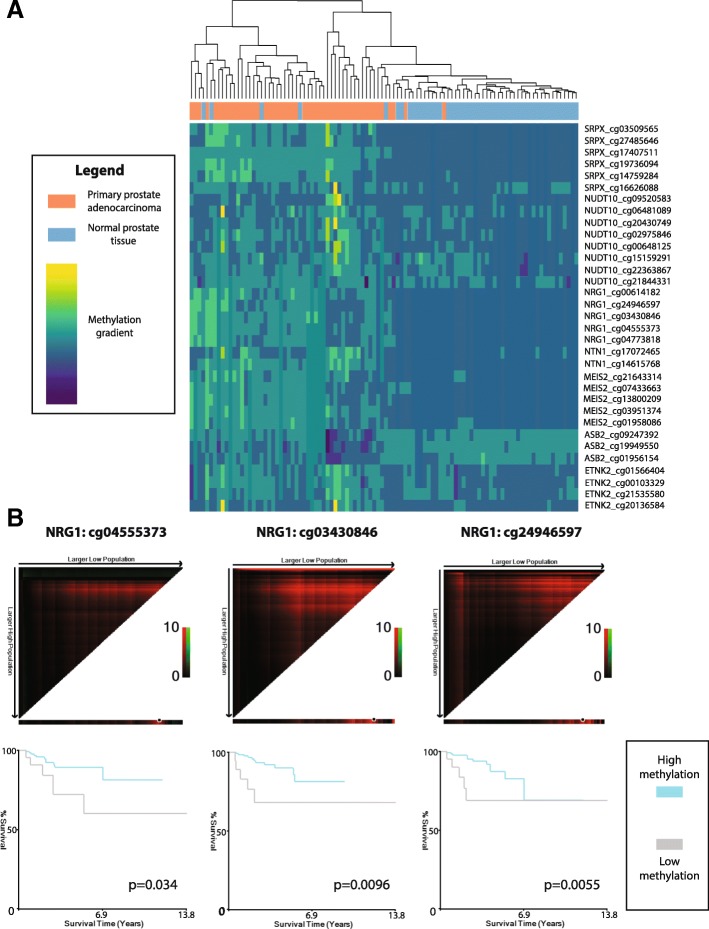
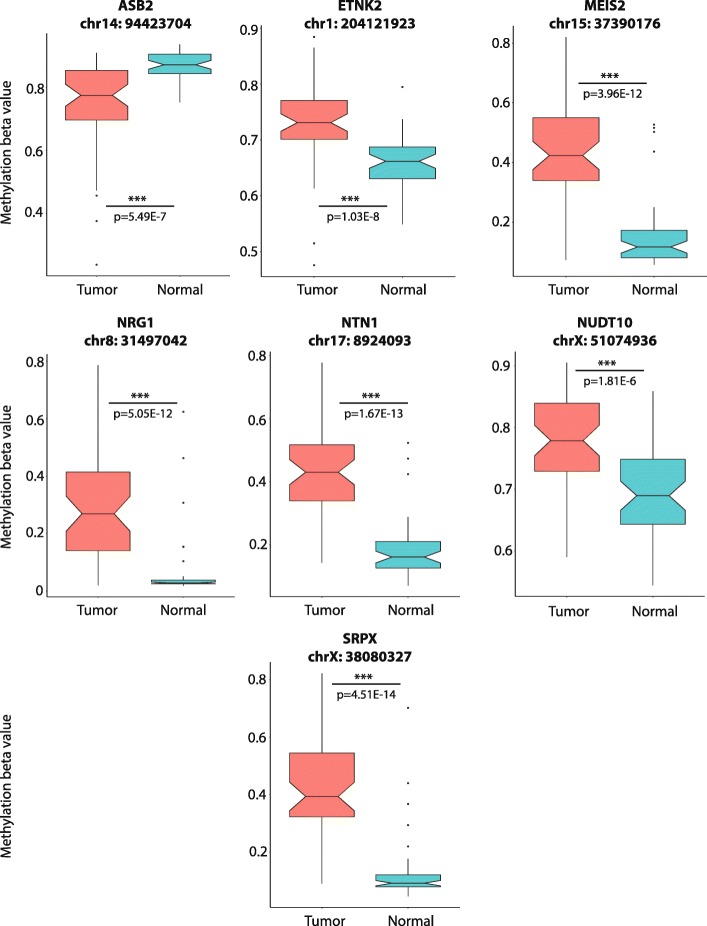
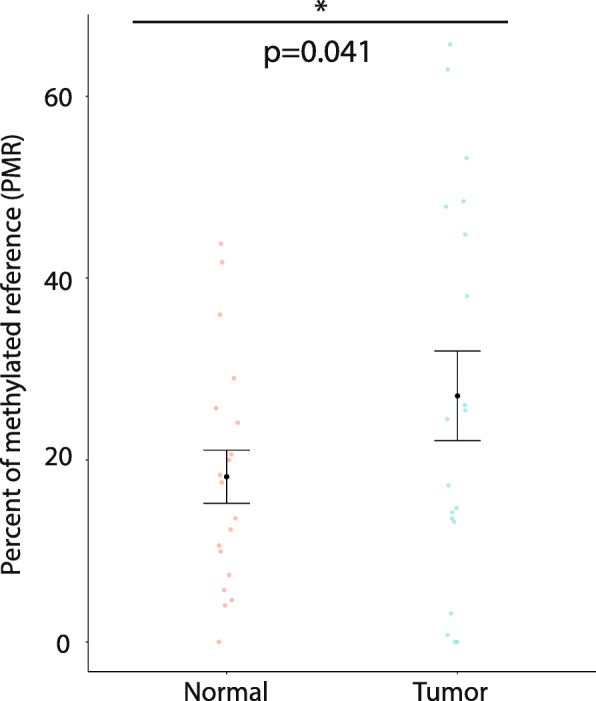
Results: Using a CRISPR/Cas9-derived TET2-knockout prostate cell line, and through whole-transcriptome and whole-methylome sequencing, we identified seven candidate genes-ASB2, ETNK2, MEIS2, NRG1, NTN1, NUDT10, and SRPX-exhibiting reduced expression and increased promoter methylation, a pattern characteristic of tumor suppressors. Decreased expression of these genes significantly discriminates between recurrent and non-recurrent prostate tumors from the Cancer Genome Atlas (TCGA) cohort (n = 423), and ASB2, NUDT10, and SRPX were significantly correlated with lower recurrence-free survival in patients by Kaplan-Meier analysis. ASB2, MEIS2, and SRPX also showed significantly lower expression in high-risk Gleason score 8 tumors as compared to low or intermediate risk tumors, suggesting that these genes may be particularly useful as indicators of PCa progression. Furthermore, methylation array probes in the TCGA dataset, which were proximal to the highly conserved, differentially methylated sites identified in our TET2-knockout cells, were able to significantly distinguish between matched prostate tumor and normal prostate tissues (n = 50 pairs). Except ASB2, all genes exhibited significantly increased methylation at these probes, and methylation status of at least one probe for each of these genes showed association with measures of PCa progression such as recurrence, stage, or Gleason score. Since ASB2 did not have any probes within the TET2-knockout differentially methylated region, we validated ASB2 methylation in an independent series of matched tumor-normal samples (n = 19) by methylation-specific qPCR, which revealed concordant and significant increases in promoter methylation within the TET2-knockout site.

Conclusions: Our study identifies seven genes governed by TET2 loss in PCa which exhibit an association between their methylation and expression status and measures of PCa progression. As differential methylation profiles and TET2 expression are associated with advanced PCa, further investigation of these specialized TET2 targets may provide important insights into patterns of carcinogenic gene dysregulation.

Keywords: Differential methylation profiling; Integrative analysis; Prostate cancer; TET2 knockout; Tumor progression.


Conflict of interest statement

Ethics approval and consent to participate

Matched human prostate tumor and normal tissue was obtained as per ethical approvals established by the Research Ethics Board of Mount Sinai Hospital, Toronto, Ontario (REB reference #140071-E).

Consent for publication

Not applicable

Competing interests

The authors declare that they have no competing interests.

Publisher’s Note

Springer Nature remains neutral with regard to jurisdictional claims in published maps and institutional affiliations.

Figures

Fig. 1
Fig. 1
Methylation and expression profiles of CRISPR-Cas9 TET2-knockout cells. a Sanger sequencing chromatograms depict deletion sites observed in CR1 (green bar; heterozygous knockout) or CR2 (blue bar; functional homozygous knockout) which occur within the CRISPR guide RNA target site (orange bar). Mutant sequences for each knockout are shown, compared to the parental TET2 sequence above. b Western blot shows complete loss of both TET2 isoforms in CR1 and CR2 knockouts as compared to parental RWPE-1 cells (top). Ku80 loading control is shown on the bottom. c Methylation levels are globally increased in TET2-knockout cells, with more differentially methylated regions (DMRs) in the promoter, gene body, and overall in both knockouts as compared to RWPE-1 (DiffBind, p < 0.05, n = 2). CR2 exhibits higher methylation levels as compared to CR1.The graph depicts the number of DMRs exhibiting increased methylation as compared to RWPE-1 (for CR1 and CR2) or as compared to either knockout (for RWPE-1). d Gene expression profiles show comparable levels of upregulation and downregulation in both knockouts, with 17.3% and 4.5% more genes showing significant downregulation than upregulation (1.5-fold change, p < 0.05). e Visual depiction of gene selection to identify genes exhibiting both significant methylation in the promoter region and significant loss of expression in either knockout (left, CR1; right, CR2) as compared to the total number of methylated genes
Fig. 2
Fig. 2
Genes exhibiting expression loss in TET2-knockout cell lines show discriminatory ability between normal prostate and prostate tumor based on expression status. Unsupervised heatmaps depict expression values normalized by gene for a 780 genes exhibiting significant loss of expression in both TET2-knockout cells (edgeR, p < 0.05) and a subset of tumors from the Cancer Genome Atlas (TCGA) within the lowest 10th percentile of TET2 expression (Mann-Whitney U, p < 1.193E−5), on this low-TET2 tumor subset; b 60 genes matching the above criteria and exhibiting increased promoter methylation in TET2 knockouts (DiffBind, p < 0.05), in all TCGA tumors with expression data available (n = 423) or c in matched tumor and normal pairs (n = 35). Expression gradient bar indicates normalized expression levels, ranging from highest (yellow) to lowest (dark blue). TET2 gradient bar indicates TET2 expression in the entire TCGA dataset, ranging from highest (cream) to lowest (black). ERG fusion status is annotated in the entire TCGA dataset where data is available. Dendrograms indicate clustering between tissue samples
Fig. 3
Fig. 3
Pathway analysis of candidate genes significantly altered by TET2-knockout. Selected, significant pathway enrichment annotations from GREAT for genes exhibiting significantly altered expression in both TET2-knockout cell lines and in tumor versus normal samples from the TCGA (binomial p value < 0.05). Bar coloration indicates the number of candidate genes enriched within each pathway
Fig. 4
Fig. 4
Candidate gene expression is indicative of tumor status and can predict worse recurrence-free survival in patients. a Receiver operating characteristic (ROC) curves for individual candidate gene expression, stratifying between benign (n = 35) and tumor (n = 423) patients in the TCGA cohort. AUCs and 95% confidence intervals for each gene are provided on the right. b X-tile analysis and Kaplan-Meier plots for prediction of biochemical recurrence-free survival in the TCGA cohort. Left: X-tile plots depict χ2 values for all possible data divisions, with brightness indicating strength of association and green coloration indicating a direct relationship. Black circles on the bottom bars for each graph depict automatically generated cut points maximizing the χ2 value in an auto-generated training set. Middle: Histogram depicting the number of patients in the auto-generated validation set below (blue) or above (gray) the cutoff point. Right: Kaplan-Meier plot showing recurrence-free survival in low-expressing (blue, below cutoff) or high-expressing (gray, above cutoff) groups for each gene. Log-rank p values are indicated on each graph
Fig. 5
Fig. 5
Tumor methylation comparison of candidate genes and predictive ability for recurrence. a Unsupervised heatmap depicting methylation beta values normalized by probe for seven genes exhibiting significantly altered expression and methylation in both knockouts and matched prostate tumor and normal samples (n = 50). Methylation gradient bar indicates normalized methylation levels, ranging from highest (yellow) to lowest (dark blue). Dendrograms indicate clustering between tissue samples. b X-tile analysis depicting methylation probes significantly associated with outcome. High-methylation probe status (gray, above cutoff) was indicative of worse recurrence-free survival as compared to patients with low-methylation probe status (blue, below cutoff) for the three probes shown. Log-rank p values are indicated on each graph
Fig. 6
Fig. 6
Methylation differences between tumor and normal samples for seven candidate genes. Notched boxplots show distribution of methylation beta values from 450 k methylation array for representative methylation probes within 500 bp surrounding the differentially methylated regions observed in candidate genes from our TET2 knockouts in matched tumor vs normal samples (n = 50). Notches indicate 95% confidence interval for medians. Significance for aggregated values determined by Mann-Whitney U test
Fig. 7
Fig. 7
Promoter ASB2 region gaining methylation in knockouts exhibits hypermethylation in prostate tumor samples compared to matched normal prostate. Scatterplot depicting increased methylation in matched tumor and normal samples (n = 18 per group), with mean and SEM depicted with error bars. Significance determined by paired Wilcoxon signed-rank test with continuity correction

References

    1. Ferlay J, Soerjomataram I, Dikshit R, Eser S, Mathers C, Rebelo M, et al. Cancer incidence and mortality worldwide: sources, methods and major patterns in GLOBOCAN 2012. Int J Cancer. 2015;136(5):E359–E386. - PubMed
    1. Wong MCS, Goggins WB, Wang HH, Fung FD, Leung C, Wong SY, et al. Global incidence and mortality for prostate cancer: analysis of temporal patterns and trends in 36 countries. Eur Urol. 2016;70(5):862–874. doi: 10.1016/j.eururo.2016.05.043. - DOI - PubMed
    1. Foley R, Hollywood D, Lawler M. Molecular pathology of prostate cancer: the key to identifying new biomarkers of disease. Endocr Relat Cancer. 2004;11(3):477–488. doi: 10.1677/erc.1.00699. - DOI - PubMed
    1. Fraser M, Sabelnykova VY, Yamaguchi TN, Heisler LE, Livingstone J, Huang V, et al. Genomic hallmarks of localized, non-indolent prostate cancer. Nature. 2017;541(7637):359–364. doi: 10.1038/nature20788. - DOI - PubMed
    1. Cancer Genome Atlas Research Network The molecular taxonomy of primary prostate cancer. Cell. 2015;163(4):1011–1025. doi: 10.1016/j.cell.2015.10.025. - DOI - PMC - PubMed

Publication types

MeSH terms