Clinical Trial
. 2019 May 1;202(9):2585-2608.
doi: 10.4049/jimmunol.1801350. Epub 2019 Mar 27.

Effector and Activated T Cells Induce Preterm Labor and Birth That Is Prevented by Treatment with Progesterone

Affiliations
Clinical Trial

Effector and Activated T Cells Induce Preterm Labor and Birth That Is Prevented by Treatment with Progesterone

Marcia Arenas-Hernandez et al. J Immunol. .

Abstract

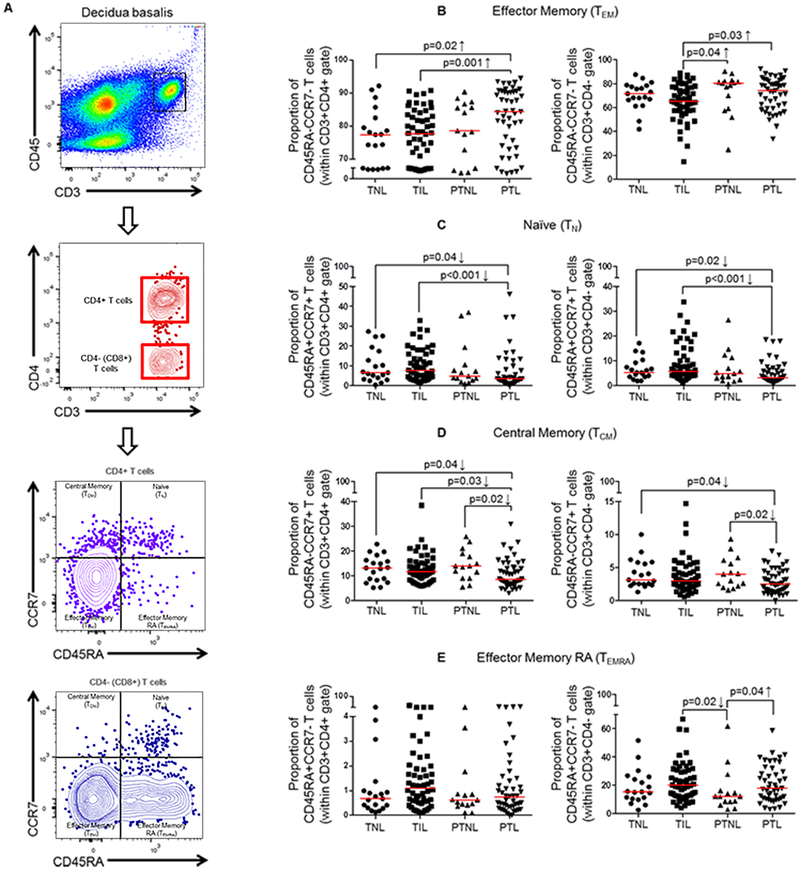
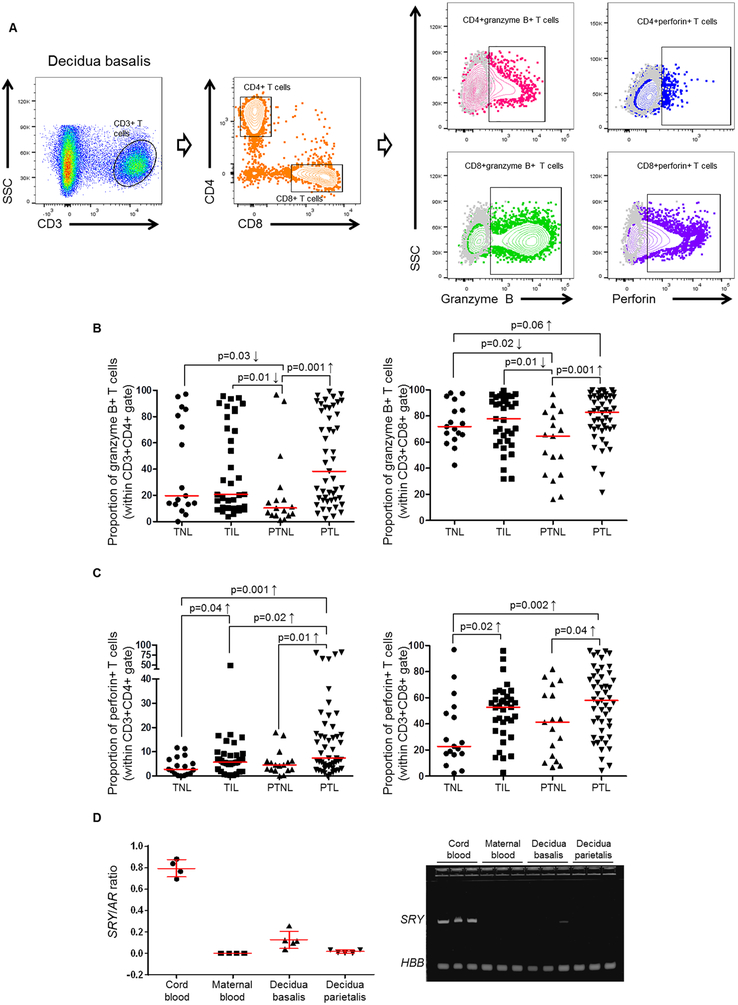
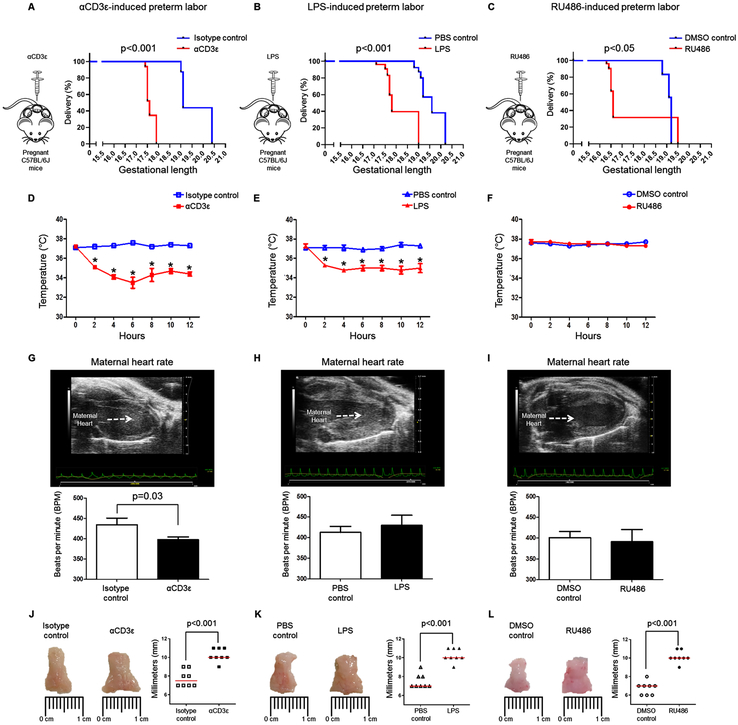
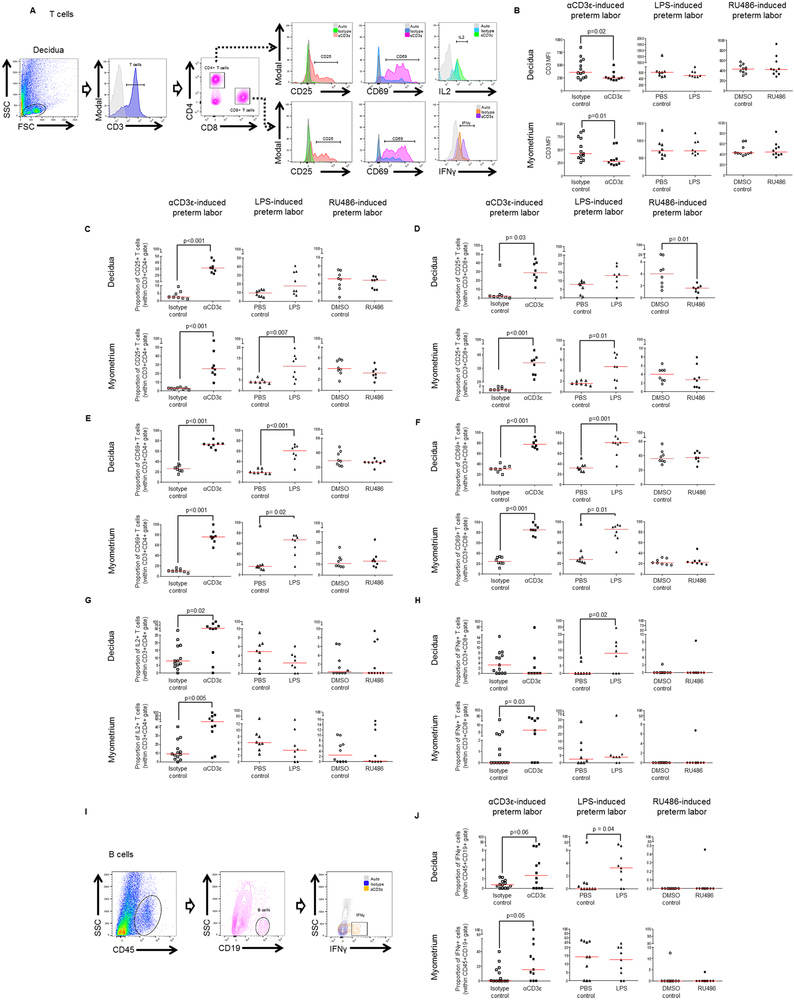
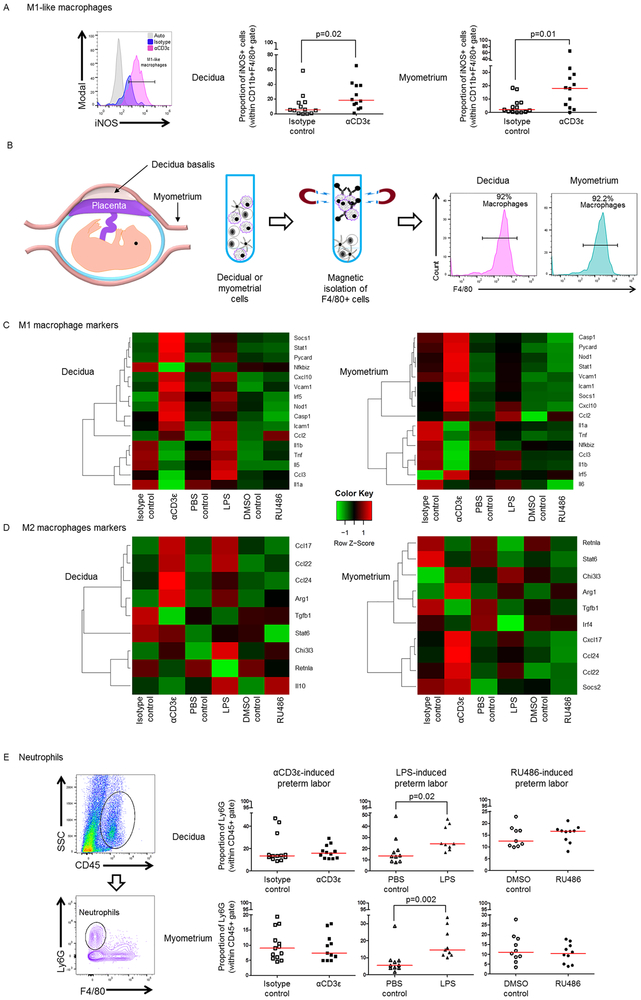
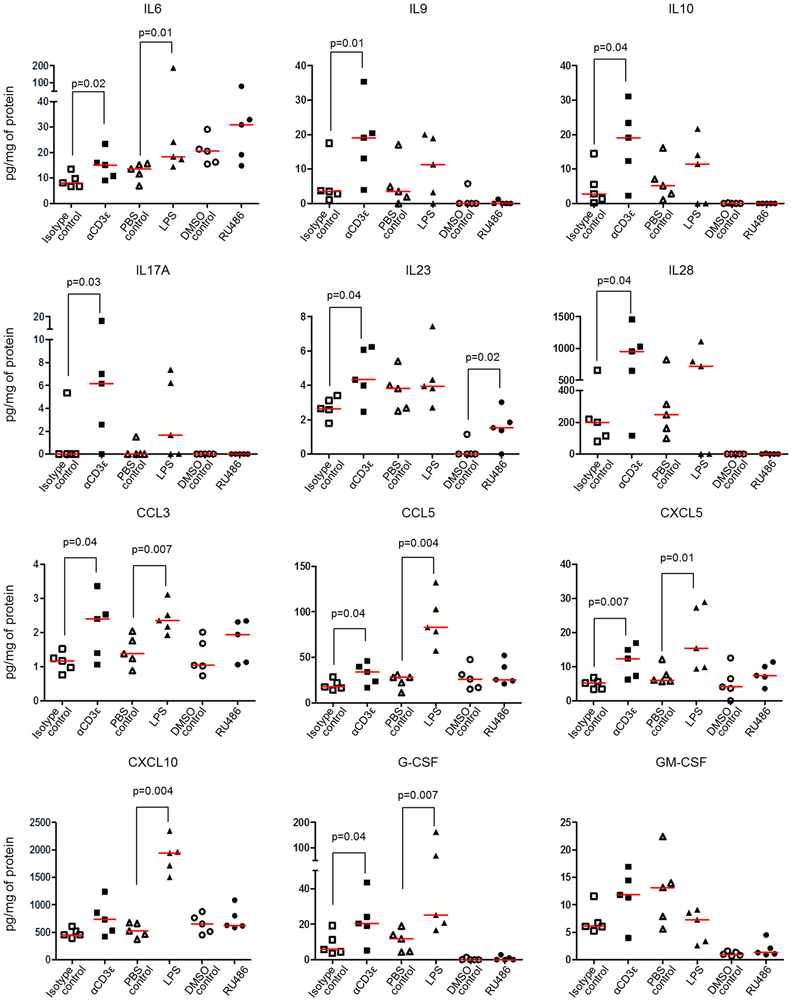
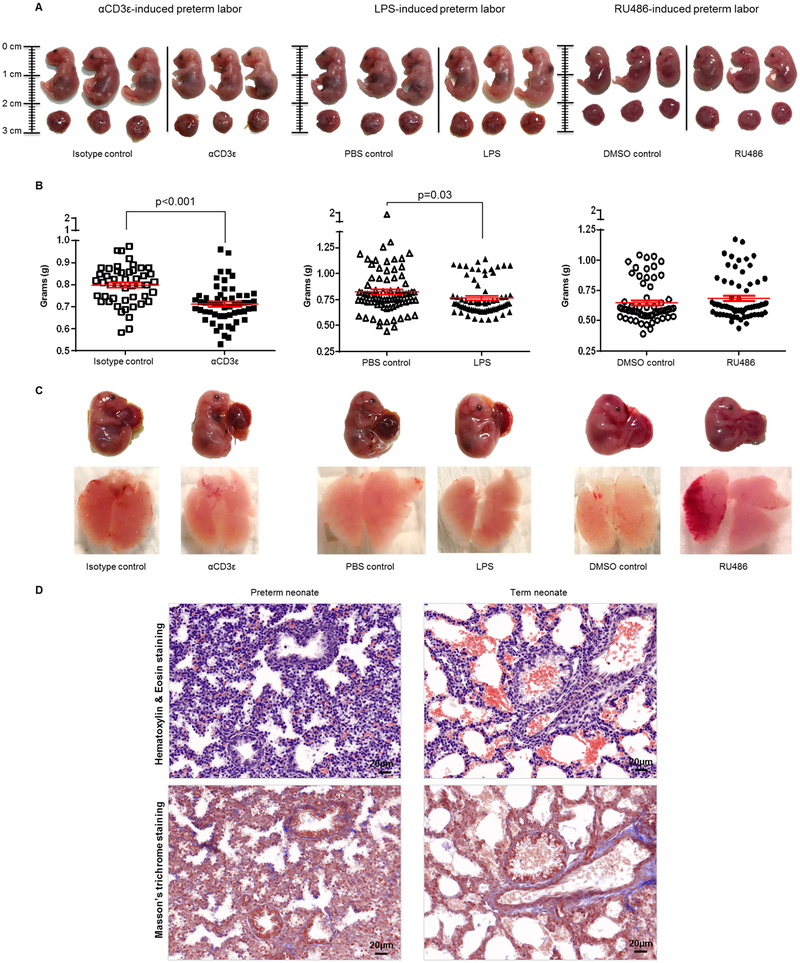
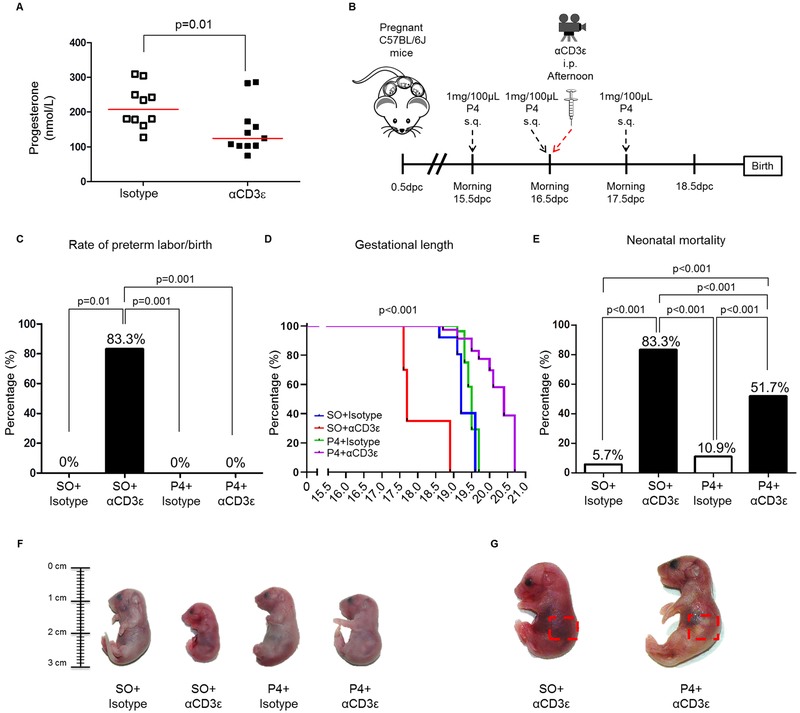
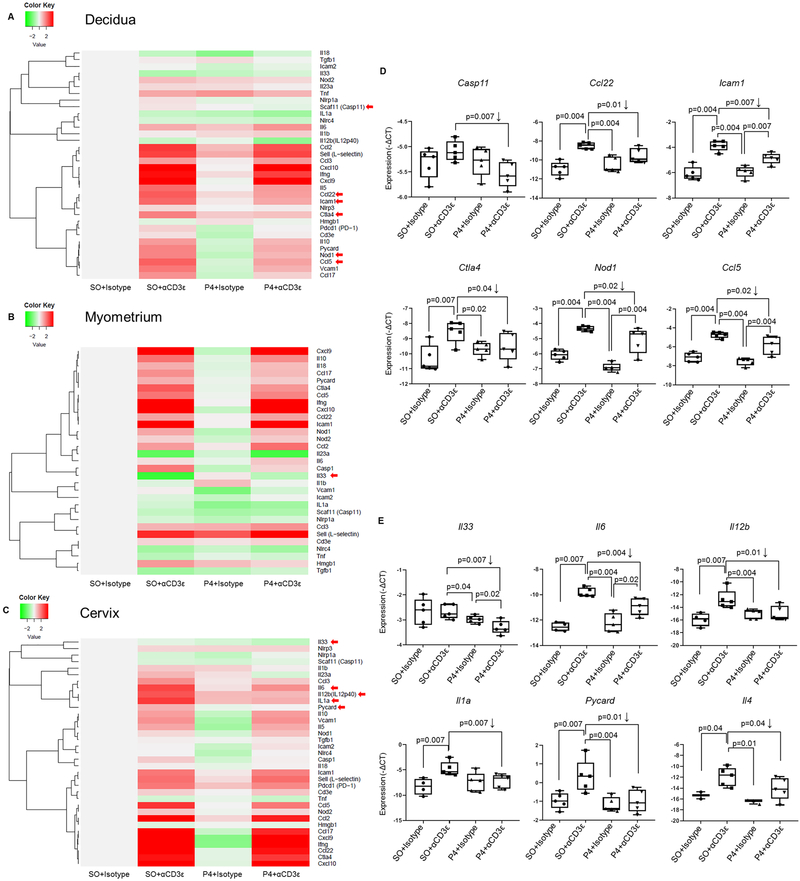
Preterm labor commonly precedes preterm birth, the leading cause of perinatal morbidity and mortality worldwide. Most research has focused on establishing a causal link between innate immune activation and pathological inflammation leading to preterm labor and birth. However, the role of maternal effector/activated T cells in the pathogenesis of preterm labor/birth is poorly understood. In this study, we first demonstrated that effector memory and activated maternal T cells expressing granzyme B and perforin are enriched at the maternal-fetal interface (decidua) of women with spontaneous preterm labor. Next, using a murine model, we reported that prior to inducing preterm birth, in vivo T cell activation caused maternal hypothermia, bradycardia, systemic inflammation, cervical dilation, intra-amniotic inflammation, and fetal growth restriction, all of which are clinical signs associated with preterm labor. In vivo T cell activation also induced B cell cytokine responses, a proinflammatory macrophage polarization, and other inflammatory responses at the maternal-fetal interface and myometrium in the absence of an increased influx of neutrophils. Finally, we showed that treatment with progesterone can serve as a strategy to prevent preterm labor/birth and adverse neonatal outcomes by attenuating the proinflammatory responses at the maternal-fetal interface and cervix induced by T cell activation. Collectively, these findings provide mechanistic evidence showing that effector and activated T cells cause pathological inflammation at the maternal-fetal interface, in the mother, and in the fetus, inducing preterm labor and birth and adverse neonatal outcomes. Such adverse effects can be prevented by treatment with progesterone, a clinically approved strategy.


Figures

Fig. 1.
Fig. 1.. Immunophenotyping of effector memory T cells in decidual tissues.
(A) Gating strategy used to identify CD4+ and CD4− (CD8+) effector memory (TEM; CD45RA−CCR7−), naïve (TN; CD45RA+CCR7+), central memory (TCM; CD45RA−CCR7+) and effector memory RA (TEMRA; CD45RA+ CCR7−) T cells in the decidua basalis from women who delivered at term without labor (TNL), term with labor (TIL), preterm without labor (PTNL), or preterm with labor (PTL). (B) Proportions of TEM cells. (C) Proportions of TN cells. (D) Proportions of TCM cells. (E) Proportions of TEMRA cells. The p-values were determined by 2-tailed Mann-Whitney U-test. Data are shown as scatter plots (median). Demographic and clinical characteristics of the study population are shown in Table I.
Fig. 2.
Fig. 2.. Immunophenotyping of activated T cells in decidual tissues.
(A) Gating strategy used to identify CD4+ and CD8+ T cells expressing granzyme B or perforin in the decidua basalis from women who delivered at term without labor (TNL), term with labor (TIL), preterm without labor (PTNL), or preterm with labor (PTL). (B) Proportions of CD4+granzyme B+ or CD8+granzyme B+ T cells. (C) Proportions of CD4+perforin+ or CD8+perforin+ T cells. The p-values were determined by 2-tailed Mann-Whitney U-test. Data are shown as scatter plots (median). Demographic and clinical characteristics of the study population are shown in Table II. (D) qPCR ratio of SRY (Y-chromosome) to AR (X-chromosome) expression in CD3+ T cells isolated from umbilical cord blood, maternal peripheral blood, the decidua basalis, and the decidua parietalis. Data are shown as scatter plots (median + interquartile range). Gel image of amplified PCR fragments shows SRY expression by CD3+ T cells isolated from umbilical cord blood, maternal peripheral blood, the decidua basalis, and the decidua parietalis. HBB = human β-globin (housekeeping gene).
Fig. 3.
Fig. 3.. Clinical parameters prior to preterm birth.
Kaplan-Meier survival curves showing the gestational length of dams injected with (A) αCD3ε (or isotype control), (B) LPS (or PBS control), or (C) RU486 (or DMSO control); n=3-8 each. The p-values were determined by Mantel-Cox test. The body temperature of the dams was recorded prior to and after the injection of (D) αCD3ε (■) or isotype control (□); (E) LPS (▲) or PBS control (∆); (F) RU486 (●) or DMSO control (○). The p-values were determined by 2-tailed Mann-Whitney U-test. Data are shown as mean ± SEM; n=5 each, *p<0.01. Doppler ultrasound was performed on dams just prior to (G) αCD3ε-induced, (H) LPS-induced, or (I) RU486-induced preterm labor/birth. Maternal heart rate was evaluated by the mean of three constant waves of the uterine artery. The p-values were determined by 2-tailed unpaired t-test. Data are shown as mean ± SEM; n=6-17 each. Representative images and widths of the cervices collected from dams after injection with (J) αCD3ε or isotype control; (K) LPS or PBS control; or (L) RU486 or DMSO control. The p-values were determined by 2-tailed Mann-Whitney U-test. Data are shown as medians; n=8 each.
Fig. 4.
Fig. 4.. Activation of T and B cells at the maternal-fetal interface and myometrium prior to preterm birth.
(A) Gating strategy used to identify activated CD4+ (CD3+CD4+ cells expressing CD25, CD69, or IL2) and CD8+ (CD3+CD8+ cells expressing CD25, CD69, or IFNγ) T cells at the maternal-fetal interface. Grey histograms represent autofluorescence controls, and colored histograms represent the expression of the CD3 molecule as well as CD25, CD69, IL2, or IFNγ. (B) Mean fluorescence intensity (MFI) of the CD3 molecule in decidual and myometrial tissues from dams injected with αCD3ε, isotype, LPS, PBS, RU486 or DMSO (n=8-13 each). Proportions of (C) CD4+ and (D) CD8+ T cells expressing CD25 in decidual and myometrial tissues from dams injected with αCD3ε, isotype, LPS, PBS, RU486, or DMSO (n=8 each). Proportions of (E) CD4+ and (F) CD8+ T cells expressing CD69 in decidual and myometrial tissues from dams injected with αCD3ε, isotype, LPS, PBS, RU486, or DMSO (n=8 each). (G) Proportion of CD4+ T cells expressing IL2 in decidual and myometrial tissues from dams injected with αCD3ε, isotype, LPS, PBS, RU486, or DMSO (n=8-13 each). (H) Proportion of CD8+ T cells expressing IFNγ in decidual and myometrial tissues from dams injected with αCD3ε, isotype, LPS, PBS, RU486 or DMSO (n=8-13). (I) Gating strategy used to identify activated B cells (CD45+CD19+IFNγ+) at the maternal-fetal interface. The grey contour plot represents the autofluorescence control and the colored contour plot represents the expression of IFNγ. (J) Proportion of B cells expressing IFNγ in decidual or myometrial tissues from dams injected with αCD3ε, isotype, LPS, PBS, RU486 or DMSO (n=9-13 each). The p-values were determined by 2-tailed Mann-Whitney U-test. Data are shown as scatter plots (median).
Fig. 5.
Fig. 5.. A pro-inflammatory macrophage polarization but not a neutrophilic influx at the maternal-fetal interface and myometrium prior to in vivo T-cell activation-induced preterm birth.
(A) Gating strategy used to identify M1-like (CD11b+F4/80+iNOS+ cells) macrophages at the maternal-fetal interface. Grey histograms represent autofluorescence controls and colored histograms represent the expression of iNOS at the maternal-fetal interface of dams injected with isotype control or αCD3ε, respectively. Proportions of M1-like macrophages in the decidual and myometrial tissues from dams injected with αCD3ε or isotype, (n=12-13 each). (B) Left to right: spatial localization of the murine decidua and myometrium. Workflow showing the magnetic isolation of macrophages from decidual and myometrial cells; macrophage purity (F4/80+ cells; >92%) was determined by flow cytometry. (C) Heat map visualization of the expression of M1 macrophage markers by F4/80+ cells isolated from the decidual and myometrial tissues of dams injected with αCD3ε, isotype, LPS, PBS, RU486 or DMSO (n=6-8 each). (D) Heat map visualization of the expression of M2 macrophage markers by F4/80+ cells isolated from the decidual and myometrial tissues of dams injected with αCD3ε, isotype, LPS, PBS, RU486 or DMSO (n=6-8 each). Negative (−)∆Ct values were calculated using Actb, Gusb, Gapdh and Hsp90ab1 as reference genes. (E) Gating strategy used to identify neutrophils (CD45+Ly6G+ cells) at the maternal-fetal interface. Proportion of neutrophils in decidual and myometrial tissues from dams injected with αCD3ε, isotype, LPS, PBS, RU486 or DMSO (n=9-13 each). The p-values were determined by 2-tailed Mann-Whitney U-test. Data are shown as scatter plots (median).
Fig. 6.
Fig. 6.. Inflammatory gene expression at the maternal-fetal interface and myometrium prior to preterm birth.
Decidual and myometrial tissues from dams injected with αCD3ε (or isotype control), LPS (or PBS control), or RU486 (or DMSO control). Heat map visualization of inflammatory and contractility-related gene expression in the (A) decidual and (B) myometrial tissues. (C&D) Messenger (m)RNA expression of selected genes in decidual and myometrial tissues. Negative (−)∆Ct values were calculated using Actb, Gusb, Gapdh and Hsp90ab1 as reference genes. Data are from individual dams (n=7-16 each). The p-values were determined by unpaired 2-tailed t-test. Data are shown as scatter plots (median).
Fig. 7.
Fig. 7.. The fetal inflammatory response prior to preterm birth.
Dams were injected with αCD3ε (or isotype control), LPS (or PBS control), or RU486 (or DMSO control). Concentrations of IL6, IL9, IL10, IL17A, IL23, IL28, CCL3, CCL5, CXCL5, CXCL10, G-CSF, and GM-CSF in amniotic fluid were determined using a cytokine multiplex assay (n=5 each). The p-values were determined by 2-tailed Mann-Whitney U-test. Data are shown as scatter plots (median).
Fig. 8.
Fig. 8.. Fetal growth parameters prior to preterm birth.
(A) Fetuses (with their placentas) from dams injected with αCD3ε, LPS, or RU486 or their respective controls prior to preterm birth. Data are representative of individual litters (n=3 each). (B) Weights of fetuses from dams injected with αCD3ε, LPS, or RU486 or their respective controls prior to preterm birth (n=7-10 each). The p-values were determined by 2-tailed unpaired t-test. Data are shown as scatter plots (mean ± SEM). (C) Fetal lungs collected from dams injected with αCD3ε, LPS, or RU486 or their respective controls prior to preterm birth (n=3 each). (D) Hematoxylin and eosin (H&E) and Masson’s trichrome staining of lungs from preterm and term neonates (n=3 each). Magnification 40x.
Fig. 9.
Fig. 9.. Progesterone prevents in vivo T-cell activation-induced preterm labor/birth and reduces adverse neonatal outcomes.
(A) Systemic progesterone (P4) concentration in dams injected with αCD3ε (or isotype control) (n=10-11 each). The p-value was determined by 2-tailed Mann-Whitney U-test. (B) Scheme of treatment with P4: dams were treated with either P4 or sesame oil (SO), injected with either αCD3ε or isotype control and video monitored until delivery(n= 5-10 each). (C) The rate of preterm birth in dams injected with SO+Isotype, SO+αCD3ε, P4+Isotype or P4+αCD3ε (n=5-10 each). The p-values were determined by 2-tailed Fisher’s exact test. (D) Gestational length and (E) the rate of neonatal mortality from pups born to dams injected with SO+Isotype, SO+αCD3ε, P4+Isotype or P4+αCD3ε (n=5-10 each). The p-values were determined by (D) Mantel-Cox test (all comparisons p≤0.001) or (E) 2-tailed Fisher’s exact test. (F) Representative images of neonates born to dams injected with SO+Isotype, SO+αCD3ε, P4+Isotype or P4+αCD3ε (n=3 each). (G) Representative images of neonates born to dams injected with SO+αCD3ε (left) or P4+αCD3ε (right). Red dashed rectangle indicates the location of the milk band (n=3 each).
Fig. 10.
Fig. 10.. Progesterone prevents in vivo T-cell activation-induced preterm labor/birth by downregulating inflammatory gene expression at the maternal-fetal interface and in the cervix.
Decidual, myometrial and cervical tissues from dams injected with sesame oil (SO)+Isotype, SO+αCD3ε, progesterone (P4)+Isotype or P4+αCD3ε (n=5 each). Heat map visualization of inflammatory gene expression in the (A) decidual, (B) myometrial, and (C) cervical tissues. The–ΔCt values of each group were centered on the −ΔCt value of the control group treated with sesame oil (SO) + Isotype. (D&E) Messenger (m)RNA expression of selected genes in decidual and cervical tissues. Negative (−)∆Ct values were calculated using Actb, Gusb, Gapdh and Hsp90ab1 as reference genes. Red arrows alongside the heat maps indicate the genes chosen for plotting. Data are from individual dams (n=5 each). The p-values were determined by one-tailed Mann Whitney U-test. Data are shown as scatter plots (median).
Fig. 11.
Fig. 11.. Conceptual framework.
Maternal effector and activated T cells expressing granzyme B and perforin can induce pathologic inflammation by initiating local immune responses at the maternal-fetal interface (decidua) (i.e. activation of B cells and an M1-like macrophage polarization without an increased influx of neutrophils) which, in turns, leads to preterm labor and birth. Activation of T cells also induces inflammatory responses in the maternal circulation and the amniotic cavity, inducing fetal damage prior to preterm labor and birth. These effects can be abrogated by treatment with the anti-inflammatory and clinically approved strategy, progesterone.

Similar articles

Cited by

References

    1. Blencowe H, Cousens S, Oestergaard MZ, Chou D, Moller AB, Narwal R, Adler A, Vera Garcia C, Rohde S, Say L, and Lawn JE. 2012. National, regional, and worldwide estimates of preterm birth rates in the year 2010 with time trends since 1990 for selected countries: a systematic analysis and implications. Lancet 379: 2162–2172. - PubMed
    1. Liu L, Oza S, Hogan D, Perin J, Rudan I, Lawn JE, Cousens S, Mathers C, and Black RE. 2015. Global, regional, and national causes of child mortality in 2000–13, with projections to inform post-2015 priorities: an updated systematic analysis. Lancet 385: 430–440. - PubMed
    1. Goldenberg RL, Culhane JF, Iams JD, and Romero R. 2008. Epidemiology and causes of preterm birth. Lancet 371: 75–84. - PMC - PubMed
    1. Romero R, and Lockwood CJ. 2009. Pathogenesis of Spontaneous Preterm Labor In Creasy and Resnik’s Maternal-Fetal Medicine: Principles and Practice, Sixth ed. Creasy RK, Resnik R, and Iams J, eds. Elsevier, Philadelphia: 521–543.
    1. Muglia LJ, and Katz M. 2010. The enigma of spontaneous preterm birth. N Engl J Med 362: 529–535. - PubMed

Publication types