. 2019 May 1;202(9):2636-2647.
doi: 10.4049/jimmunol.1801586. Epub 2019 Mar 27.

Diversity of KIR, HLA Class I, and Their Interactions in Seven Populations of Sub-Saharan Africans

Affiliations

Diversity of KIR, HLA Class I, and Their Interactions in Seven Populations of Sub-Saharan Africans

Neda Nemat-Gorgani et al. J Immunol. .

Abstract

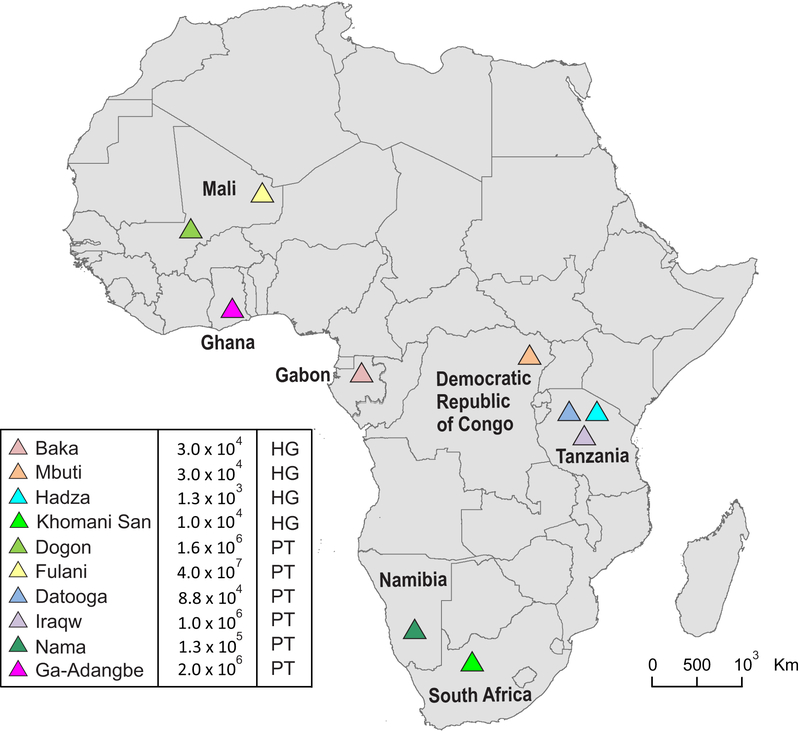
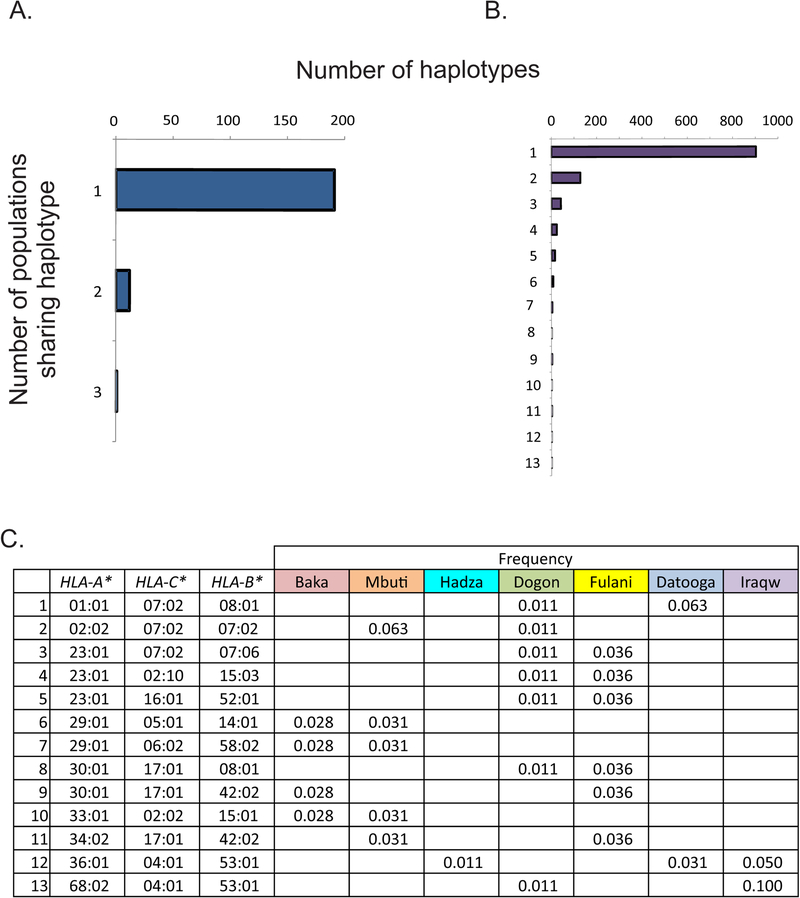
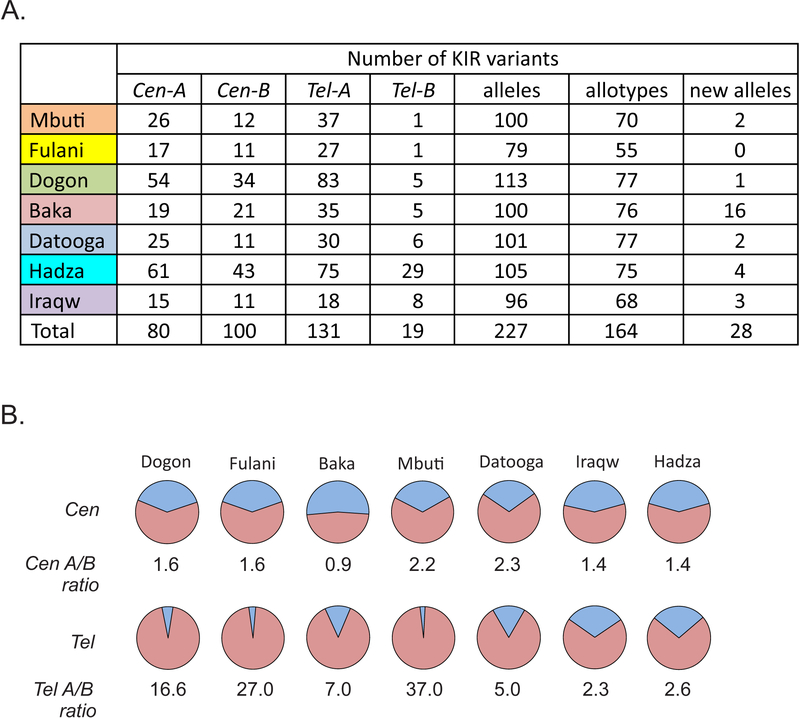
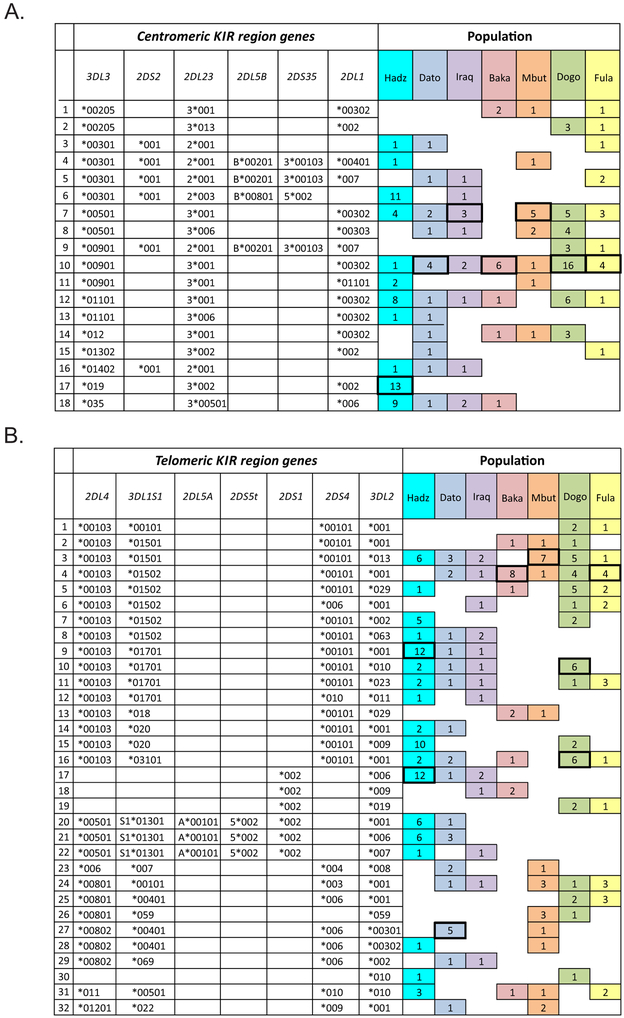
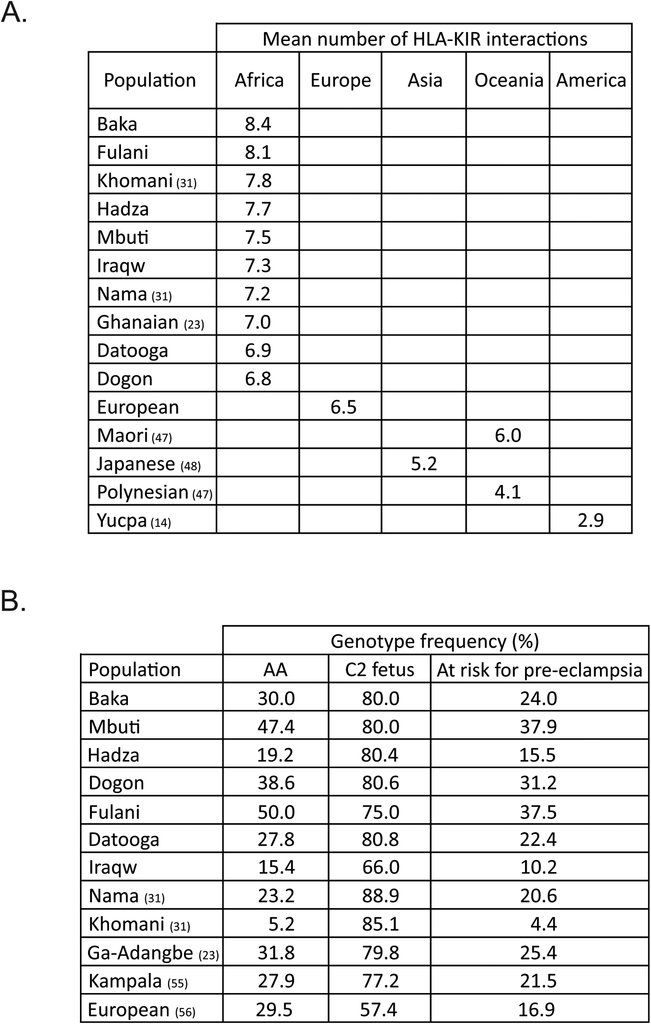
HLA class I and KIR sequences were determined for Dogon, Fulani, and Baka populations of western Africa, Mbuti of central Africa, and Datooga, Iraqw, and Hadza of eastern Africa. Study of 162 individuals identified 134 HLA class I alleles (41 HLA-A, 60 HLA-B, and 33 HLA-C). Common to all populations are three HLA-C alleles (C1+C*07:01, C1+C*07:02, and C2+C*06:02) but no HLA-A or -B Unexpectedly, no novel HLA class I was identified in these previously unstudied and anthropologically distinctive populations. In contrast, of 227 KIR detected, 22 are present in all seven populations and 28 are novel. A high diversity of HLA A-C-B haplotypes was observed. In six populations, most haplotypes are represented just once. But in the Hadza, a majority of haplotypes occur more than once, with 2 having high frequencies and 10 having intermediate frequencies. The centromeric (cen) part of the KIR locus exhibits an even balance between cenA and cenB in all seven populations. The telomeric (tel) part has an even balance of telA to telB in East Africa, but this changes across the continent to where telB is vestigial in West Africa. All four KIR ligands (A3/11, Bw4, C1, and C2) are present in six of the populations. HLA haplotypes of the Iraqw and Hadza encode two KIR ligands, whereas the other populations have an even balance between haplotypes encoding one and two KIR ligands. Individuals in these African populations have a mean of 6.8-8.4 different interactions between KIR and HLA class I, compared with 2.9-6.5 for non-Africans.


Figures

FIGURE 1.
FIGURE 1.. African populations studied
This map of Africa shows the locations of the ten sub-Saharan African populations that have been allele-level genotyped for KIR and HLA class I. Previously studied were the Ga-Adangbe from Ghana in West Africa (23) and two KhoeSan hunter-gatherer (HG) populations, the Nama and the Khomani San, from southern Africa (15, 31). Of the seven populations, on which KIR and HLA class I are first reported here, the Baka and Mbuti Pygmies and the Hadza are hunter gatherers, and the Dogon, Fulani, Datooga and Iraqw are pastoralists (PT). The estimated size of each population is given in the key (https://en.wikipedia.org/wiki/Iraqw_people, https://en.wikipedia.org/wiki/Dogon_people, https://en.wikipedia.org/wiki/Mbuti_people, https://en.wikipedia.org/wiki/Datooga_people, https://en.wikipedia.org/wiki/Baka_people_(Cameroon_and_Gabon)), https://en.wikipedia.org/wiki/Hadza_people, https://en.wikipedia.org/wiki/Fula_people, https://en.wikipedia.org/wiki/Nama_people, https://en.wikipedia.org/wiki/Ga-Adangbe_people.
FIGURE 2.
FIGURE 2.. HLA class I diversity in seven sub-Saharan African populations
(A). Shown is the variation (k) and heterozygosity (H) for HLA class I alleles and haplotypes. (B) The frequency of HLA-A, -B and -C allotypes within each category of KIR ligand is shown for each population.
FIGURE 3.
FIGURE 3.. Distribution of HLA class I haplotypes among seven sub-Saharan African populations
(A). Shown are the numbers of HLA class I haplotypes observed in one, two or three of the seven populations. (B) The numbers of haplotypes present in one, two, three etcetera up to 13 are given for all African HLA class I haplotypes present in the database. (C) Shown are HLA class I haplotypes found in more than one population ordered by their HLA-A alleles.
FIGURE 4.
FIGURE 4.. HLA class I haplotype diversity in seven sub-Saharan African populations
Shown for each SSA population, is the frequency distribution of all HLA class I haplotypes. Also given are the frequency distributions of HLA class I haplotypes in three non-African populations: North Americans (NAM), South East Asians (SEA) and West Asians (WAS). For each population the total number of haplotypes (2N) is indicated.
FIGURE 5.
FIGURE 5.. HLA class I diversity in Africans and other populations
(A). Heat map showing frequencies of 231 HLA class I haplotypes common to African populations. In the color key on the right, red denotes the highest and blue the lowest frequency haplotype. (B). Shown for each population are the number of HLA-A, HLA-B and HLA-C alleles, as well as the total number of HLA-A, -B and -C alleles, present in the seven sub-Saharan African populations (SSA), Yucpa (South America: SA) (14), Maori and Polynesians (Oceana: OCE) (47), Japanese (East Asia: EA) (48), Europeans (45), Khomani San (31), Nama (31) and Ghanaians (23). For each population the total number of HLA-A, -B and -C alleles is given.
FIGURE 6.
FIGURE 6.. KIR diversity in seven sub Saharan African populations
(A). Shown are the number of cenA, cenB, telA and telB haplotypes identified in each population. Also shown are the numbers of different KIR alleles, KIR allotypes and new KIR alleles characterized in this study. (B). Shown are the frequencies of the centromeric (cenA) and telomeric (telA) KIR A haplotypes (red) and the centromeric (cenB) and telomeric (telB) KIR B haplotypes (blue) in each population ordered by their A/B haplotype ratio.
FIGURE 7.
FIGURE 7.. KIR haplotypes segregating in seven populations of sub-Saharan Africans
Shown on the left are 18 centromeric KIR haplotypes (A) and 32 telomeric KIR haplotypes (B). Included are the most common KIR haplotypes present in each population and all of the KIR haplotypes present in two or more populations. Shown on the right are the distributions of the 50 KIR haplotypes among the seven SSA populations (colored boxes) and the occurrence of each haplotype in each population (the number in each box). The boxes corresponding to the most frequent centromeric and telomeric KIR haplotypes have bold outlines.
FIGURE 8.
FIGURE 8.. HLA class I allele frequency spectra for seven sub Saharan African populations
Venn diagrams (pie charts) give the frequencies of HLA-A, -B and -C alleles for each population. ‘n’ denotes the number of different alleles for each gene. The frequencies of allotypes having epitopes recognized by KIR are color-coded: yellow, the A3/11 epitope; green, the Bw4 epitope; red, the C1 epitope and blue, the C2 epitope. The column on the right gives the relative frequencies of HLA class I haplotypes, encoding one (yellow), two (orange) or three (red) KIR ligands.
FIGURE 9.
FIGURE 9.. Diversity in the functional potential of KIR-HLA interactions in human populations
(A). For sub-Saharan Africans (23, 31) and other populations (14, 47, 48) the combined KIR and HLA class I genotype was used to define, for each individual, the total number of different pairs of interacting KIR and HLA class I ligands. Averaging the number of such interactions over the population gives the ‘Mean number of HLA-KIR interactions’. (B). Pregnancies in which the mother is homozygous for C1 and KIR A, and the fetus expresses C2, are at risk for pre-eclampsia. Shown are the predicted frequencies of such pregnancies in sub-Saharan African populations and Europeans (23, 31, 55, 56).

References

    1. Trowsdale J, and Knight JC. 2013. Major histocompatibility complex genomics and human disease. Annu. Rev. Genomics Hum. Genet 14: 301–323. - PMC - PubMed
    1. Cruz FM, Colbert JD, Merino E, Kriegsman BA, and Rock KL. 2017. The biology and underlying mechanisms of cross-presentation of exogenous antigens on MHC-I molecules. Annu. Rev. Immunol 35: 149–176. - PMC - PubMed
    1. King A, Boocock C, Sharkey AM, Gardner L, Beretta A, Siccardi AG, and Loke YW. 1996. Evidence for the expression of HLAA-C class I mRNA and protein by human first trimester trophoblast. J. Immunol 156: 2068–2076. - PubMed
    1. Parham P, and Moffett A. 2013. Variable NK cell receptors and their MHC class I ligands in immunity, reproduction and human evolution. Nat. Rev. Immunol 13: 133–144. - PMC - PubMed
    1. Robinson J, Guethlein LA, Cereb N, Yang SY, Norman PJ, Marsh SGE, and Parham P. 2017. Distinguishing functional polymorphism from random variation in the sequences of >10,000 HLA-A, -B and -C alleles. PLoS Genet. 13: e1006862. - PMC - PubMed

Publication types