. 2019 Jun;60(6):1069-1077.
doi: 10.1194/jlr.M090928. Epub 2019 Mar 27.

PNPLA2 influences secretion of triglyceride-rich lipoproteins by human hepatoma cells

Affiliations

PNPLA2 influences secretion of triglyceride-rich lipoproteins by human hepatoma cells

Apostolos Taxiarchis et al. J Lipid Res. 2019 Jun.

Abstract

Patatin-like phospholipase domain-containing proteins (PNPLAs) are involved in triglyceride hydrolysis and lipid-droplet homeostasis in mice, but the physiological significance of the PNPLAs for triglyceride metabolism in human hepatocytes is unclear. Here, we investigate the roles of PNPLA2, PNPLA3, and PNPLA4 in triglyceride metabolism of human Huh7 and HepG2 hepatoma cells using gene-specific inhibition methods. siRNA inhibition of PNPLA3 or PNPLA4 is not associated with changes in triglyceride hydrolysis, secretion of triglyceride-rich lipoproteins (TRLs), or triglyceride accumulation. However, PNPLA2 siRNA inhibition, both in the absence and presence of oleate-containing medium, or treatment with the PNPLA2 inhibitor Atglistatin reduced intracellular triglyceride hydrolysis and decreased TRL secretion. In contrast, PNPLA2 inhibition showed no effects on lipid-droplet homeostasis, which is the primary physiological function of PNPLA2 in nonhepatic tissues. Moreover, confocal microscopy analysis found no clear evidence for the localization of PNPLA2 around lipid droplets. However, significant colocalization of PNPLA2 with the endoplasmic reticulum marker protein disulfide-isomerase was found in HepG2 and Huh7 cells with Rcoloc values of 0.61 ± 0.06 and 0.81 ± 0.05, respectively. In conclusion, PNPLA2 influences TRL secretion, but is not involved in lipid-droplet homeostasis in human hepatoma cells, a physiological role that is quite distinct from the metabolic function of PNPLA2 in nonhepatic tissues.

Keywords: confocal microscopy; endoplasmic reticulum; lipid droplets; lipolysis and fatty acid metabolism; liver; nonalcoholic fatty liver disease; triglycerides/diacylglycerol.


Figures

Fig. 1.
Fig. 1.
Effect of gene-specific siRNA silencing on mRNA levels of selected genes. A: Effect of gene-specific siRNA silencing on the PNPLA2, PNPLA3, and PNPLA4 mRNA levels in human hepatoma Huh7 (left) and HepG2 (right) cells (n = 4–7). B: Representative Western blot images of PNPLA2 from HepG2 cells treated with either control or PNPLA2 siRNA probe obtained after 24 h (left) and 48 h (right) incubations. C: Representative Western blot images of PNPLA3 from HepG2 cells treated with either control siRNA or the independent PNPLA3 siRNA probes A and B. D: Effect of gene-specific siRNA silencing on mRNA levels of selected genes involved in lipid metabolism in human hepatoma cells (n = 3–6). The values in A and D are expressed as percent of control experiments, indicated with a dotted line. Values represent mean ± SD (A) or mean ± SEM (D). Differences were determined using unpaired Student’s t-test, followed by Bonferroni post hoc analysis (D). * P < 0.05; *** P < 0.001.
Fig. 2.
Fig. 2.
PNPLA2 inhibition reduces triglyceride-hydrolase activity and TRL secretion. A: Four and 8 h analysis of triglyceride (TG) hydrolysis in Huh7 (left) and HepG2 (right) cells treated with control siRNA or PNPLA2 siRNA. Values are expressed as percentage reduction of cellular 14C-TG radioactivity compared with the 0 h time point (n = 3). B: Effect of gene-specific siRNA silencing on 8 h TG hydrolysis in Huh7 and HepG2 cells (n = 3–6). C: Effect of gene-specific siRNA silencing on the secretion of triglyceride (TG; left) and APOB (right) by Huh7 and HepG2 cells (n = 3–9). Note that the results obtained by the two PNPLA2 siRNA probes A and B are presented separately. D: Effect of gene-specific siRNA silencing on cellular TG content of Huh7 and HepG2 cells (n = 3–5). The results obtained by the two PNPLA2 siRNA probes A and B are shown separately. The values in B–D are expressed as percent of control experiments, indicated with a dotted line. Values represent mean ± SD. Differences were determined using unpaired Student’s t-test. * P < 0.05; ** P < 0.01.
Fig. 3.
Fig. 3.
PNPLA2 inhibition does not influence hepatic lipid droplets. A: Representative confocal microscopy images of Huh7 cells treated with control siRNA (left) or PNPLA2 siRNA (right) and stained with DAPI and BODIPY 493/503. B: Effect of PNPLA2 inhibition on lipid-droplet (LD) area per cell in Huh7 cells (n = 5). C: Effect of PNPLA2 inhibition on the size distribution of LDs in Huh7 cells (n = 5). D: Representative confocal microscopy images of HepG2 cells treated with control siRNA (left) or PNPLA2 siRNA (right) and stained with DAPI and BODIPY 493/503. E: Effect of PNPLA2 inhibition on LD area per cell in HepG2 cells (n = 5). F: Effect of PNPLA2 inhibition on the size distribution of LDs in HepG2 cells (n = 5). Values represent mean ± SD. Differences were determined using unpaired Student’s t-test. ns, not significant.
Fig. 4.
Fig. 4.
Oleate treatment does not influence the effects of PNPLA2 inhibition on hepatic triglyceride metabolism. A: Effect of 0.2 mM oleate-supplemented medium on secretion of triglyceride (TG; left) and APOB (right) by Huh7 and HepG2 (n = 4) cells. The effect of 0.2 mM oleate-supplemented medium on cellular triglyceride concentration (n = 3 or 4) is shown in right. B: Effects of PNPLA2 inhibition on PNPLA2 mRNA levels (left), secretion of triglycerides (middle), and accumulation of cellular triglycerides (right) by Huh7 and HepG2 cells (n = 3–5) cultured in 0.2 mM oleate-supplemented medium. The values are expressed as percent of control experiments, indicated with a dotted line. Values represent mean ± SD. Differences were determined using unpaired Student’s t-test. ** P < 0.01; *** P < 0.001; **** P < 0.0001.
Fig. 5.
Fig. 5.
Atglistatin treatment and PNPLA2 siRNA inhibition generate comparable effects on triglyceride metabolism in human hepatoma cells. A: Effects of PNPLA2 siRNA silencing, Atglistatin treatment, or the combination of PNPLA2 siRNA silencing and Atglistatin treatment on 8 h triglyceride (TG) hydrolysis by Huh7 and HepG2 cells (n = 3–6). B: Effects of Atglistatin treatment or the combination of PNPLA2 siRNA silencing and Atglistatin treatment on mRNA levels of PNPLA2 and selected genes involved in lipid metabolism in human hepatoma Huh7 and HepG2 cells (n = 3). C: Effects of PNPLA2 siRNA silencing, Atglistatin treatment, or the combination of PNPLA2 siRNA silencing and Atglistatin treatment on the secretion of TG (left) and APOB (right) by Huh7 and HepG2 cells (n = 3–6). D: Effects of PNPLA2 siRNA silencing, Atglistatin treatment, or the combination of PNPLA2 siRNA silencing and Atglistatin treatment on cellular TG content of Huh7 and HepG2 cells (n = 4–8). The values are expressed as percent of control experiments, indicated with a dotted line. Values represent mean ± SD (A, C, D) or mean ± SEM (B). Differences were determined using unpaired Student’s t-test, followed by Bonferroni post hoc analysis (B). * P < 0.05; ** P < 0.01; *** P < 0.001.
Fig. 6.
Fig. 6.
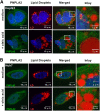
No clear evidence for colocalization of PNPLA2 on the surface of lipid droplets. Representative confocal microscopy images of HepG2 (A) and Huh7 (B) cells cultured in the absence or presence of 0.4 mM oleic acid in the cell-culture medium and stained for PNPLA2 (monoclonal PNPLA2-Ab followed by Alexa Fluor 488 secondary Ab) and lipid droplets (LipidTOX Red).
Fig. 7.
Fig. 7.
Colocalization of PNPLA2 with PLIN2 and PDI in HepG2 cells. Representative confocal microscopy images depicting colocalization of PNPLA2 with PLIN2 (A) and PNPLA2 with PDI (B) in HepG2 and Huh7 cells are shown. Cells were stained with Alexa Fluor 488- or Alexa Fluor 594-labeled mAbs.

References

    1. Brunt E. M., Wong V. W., Nobili V., Day C. P., Sookoian S., Maher J. J., Bugianesi E., Sirlin C. B., Neuschwander-Tetri B. A., and Rinella R. E.. 2015. Nonalcoholic fatty liver disease. Nat. Rev. Dis. Primers. 1: 15080. - PubMed
    1. Fabbrini E., Sullivan S., and Klein S.. 2010. Obesity and nonalcoholic fatty liver disease: biochemical, metabolic, and clinical implications. Hepatology. 51: 679–689. - PMC - PubMed
    1. Mellinger J. L., Pencina K. M., Massaro J. M., Hoffmann U., Seshadri S., Fox C. S., O’Donnell C. J., and Speliotes E. K.. 2015. Hepatic steatosis and cardiovascular disease outcomes: an analysis of the Framingham Heart Study. J. Hepatol. 63: 470–476. - PMC - PubMed
    1. Gluchowski N. L., Becuwe M., Walther T. C., and Farese R. V. Jr.. 2017. Lipid droplets and liver disease: from basic biology to clinical implications. Nat. Rev. Gastroenterol. Hepatol. 14: 343–355. - PMC - PubMed
    1. Yang L. Y., Kuksis A., Myher J. J., and Steiner G.. 1995. Origin of triacylglycerol moiety of plasma very low density lipoproteins in the rat: structural studies. J. Lipid Res. 36: 125–136. - PubMed

Publication types

MeSH terms

LinkOut - more resources