. 2019 Jun;17(6):1235-1240.
doi: 10.1158/1541-7786.MCR-18-1101. Epub 2019 Mar 27.

Whole-Genome and Transcriptional Analysis of Treatment-Emergent Small-Cell Neuroendocrine Prostate Cancer Demonstrates Intraclass Heterogeneity

Affiliations

Whole-Genome and Transcriptional Analysis of Treatment-Emergent Small-Cell Neuroendocrine Prostate Cancer Demonstrates Intraclass Heterogeneity

Rahul R Aggarwal et al. Mol Cancer Res. 2019 Jun.

Abstract

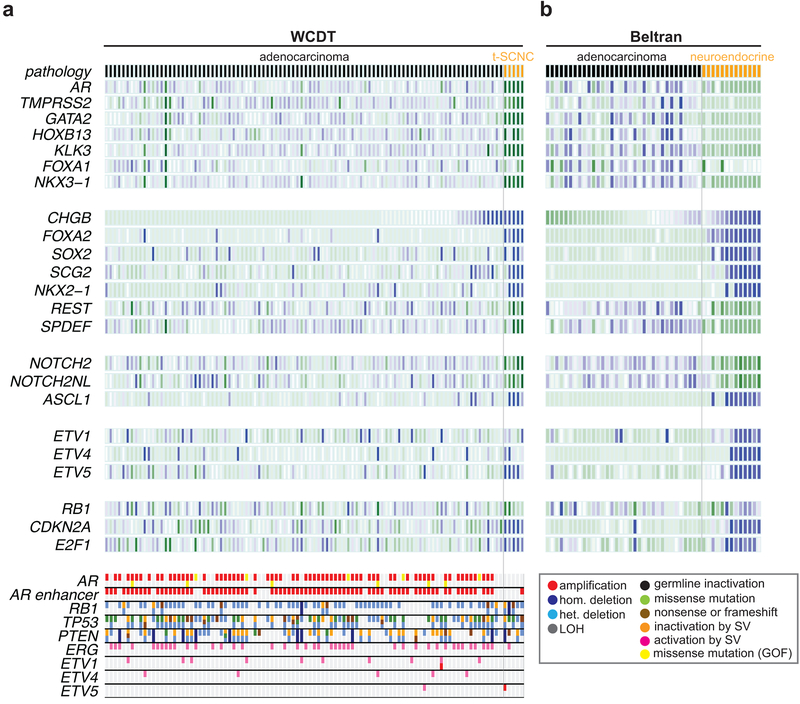
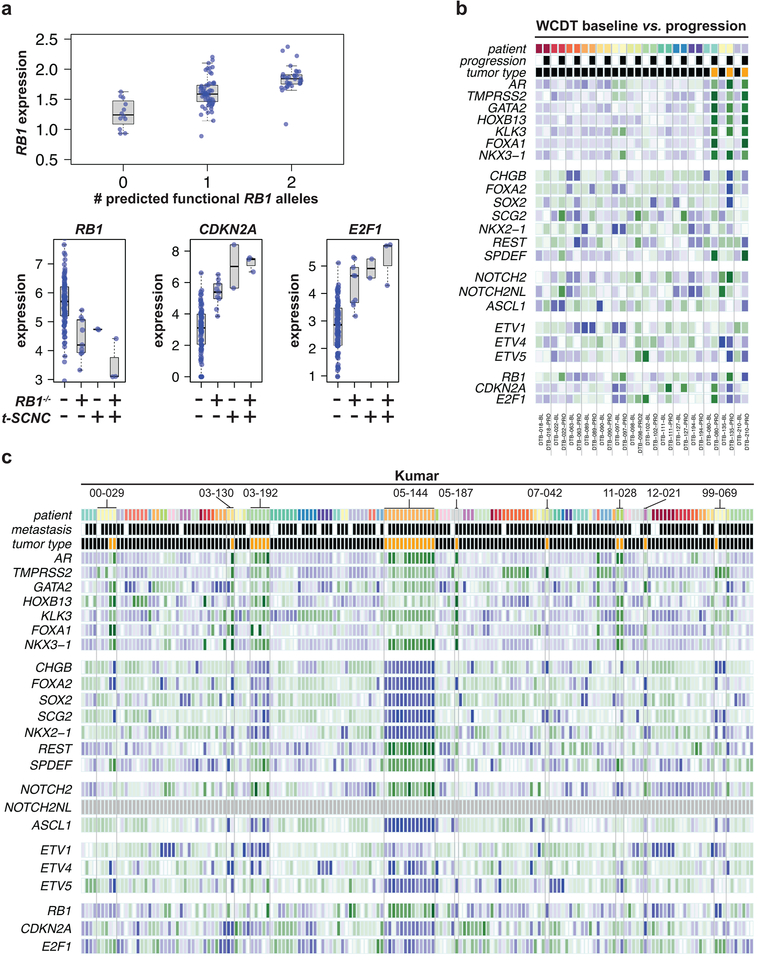
Therapeutic resistance in metastatic castration-resistant prostate cancer (mCRPC) can be accompanied by treatment-emergent small-cell neuroendocrine carcinoma (t-SCNC), a morphologically distinct subtype. We performed integrative whole-genome and -transcriptome analysis of mCRPC tumor biopsies including paired biopsies after progression, and multiple samples from the same individual. t-SCNC was significantly less likely to have amplification of AR or an intergenic AR-enhancer locus, and demonstrated lower expression of AR and its downstream transcriptional targets. Genomic and transcriptional hallmarks of t-SCNC included biallelic loss of RB1, elevated expression levels of CDKN2A and E2F1, and loss of expression of the AR and AR-responsive genes including TMPRSS2 and NKX3-1. We identified three tumors that converted from adenocarcinoma to t-SCNC and demonstrate spatial and temporal intrapatient heterogeneity of metastatic tumors harboring adenocarcinoma, t-SCNC, or mixed expression phenotypes, with implications for treatment strategies in which dual targeting of adenocarcinoma and t-SCNC phenotypes may be necessary. IMPLICATIONS: The t-SCNC phenotype is characterized by lack of AR enhancer gain and loss of RB1 function, and demonstrates both interindividual and intraindividual heterogeneity.Visual Overview: http://mcr.aacrjournals.org/content/molcanres/17/6/1235/F1.large.jpg.


Conflict of interest statement

Conflicts of interest: The authors declare no potential conflicts of interest.

Figures

Figure 1:
Figure 1:. Expression correlates of t-SCNC status
A) Top: heatmap showing expression of selected genes in the WGS cohort differentially expressed between t-SCNC and adenocarcinoma expression phenotypes, where darker blue / green indicate higher / lower expression. Adenocarcinoma / t-SCNC status assessed by gene expression profile is indicated by black / orange bar in top row. Bottom: somatic variants detected by WGS in key prostate cancer driver and tumor suppressor genes. The frequency of AR enhancer amplification was lower, and RB1 bi-allelic loss higher, in t-SCNC versus adenocarcinoma samples (P < 0.05 for both comparisons). B) Heatmap showing expression of genes in panel A in the Beltran data set. Samples designated CRPC-ADENO / CRPC-NEPC in that publication are indicated by black / orange bar in top row.
Figure 2:
Figure 2:. RB pathway expression is associated with t-SCNC status.
A) Top: expression of RB1 is significantly associated with the number of predicted functional alleles. Bottom: expression of RB1, CDKN2A, and E2F1 were significantly different in RB1−/− and t-SCNC tumors compared to RB1+/+ tumors with adenocarcinoma expression phenotype. B) Heatmap showing expression of NEPC genes in paired WCDT baseline and progression mCRPC samples. Tumors from the same patient are indicated by a common color on the top line and set off by vertical lines. Baseline / progression status is indicated by white / black bar in second row. Adenocarcinoma / t-SCNC status assessed by gene expression profile is indicated by black / orange bar in third row. C) Heatmap showing expression of NEPC genes in primary, localized, and mCRPC samples from Kumar data set. All tumors from the same patient are indicated by a common color on the top line. Samples derived from primary / metastatic lesions are indicated by white / black on the second line. Adenocarcinoma / t-SCNC status assessed by gene expression profile is indicated by black / orange bar in third row.

References

    1. Robinson D et al. Integrative Clinical Genomics of Advanced Prostate Cancer. Cell 161, 1215–1228, doi:10.1016/j.cell.2015.05.001 (2015). - DOI - PMC - PubMed
    1. Ryan CJ et al. Abiraterone in metastatic prostate cancer without previous chemotherapy. The New England journal of medicine 368, 138–148, doi:10.1056/NEJMoa1209096 (2013). - DOI - PMC - PubMed
    1. Aparicio AM et al. Combined Tumor Suppressor Defects Characterize Clinically Defined Aggressive Variant Prostate Cancers. Clin Cancer Res 22, 1520–1530, doi:10.1158/1078-0432.CCR-15-1259 (2016). - DOI - PMC - PubMed
    1. Beltran H et al. Molecular characterization of neuroendocrine prostate cancer and identification of new drug targets. Cancer Discov 1, 487–495, doi:10.1158/2159-8290.CD-11-0130 (2011). - DOI - PMC - PubMed
    1. Beltran H et al. Divergent clonal evolution of castration-resistant neuroendocrine prostate cancer. Nat Med 22, 298–305, doi:10.1038/nm.4045 (2016). - DOI - PMC - PubMed

Publication types

MeSH terms