. 2019 Mar 27;10(1):1396.
doi: 10.1038/s41467-019-09111-2.

Myoglobinopathy is an adult-onset autosomal dominant myopathy with characteristic sarcoplasmic inclusions

Affiliations

Myoglobinopathy is an adult-onset autosomal dominant myopathy with characteristic sarcoplasmic inclusions

Montse Olivé et al. Nat Commun. .

Abstract

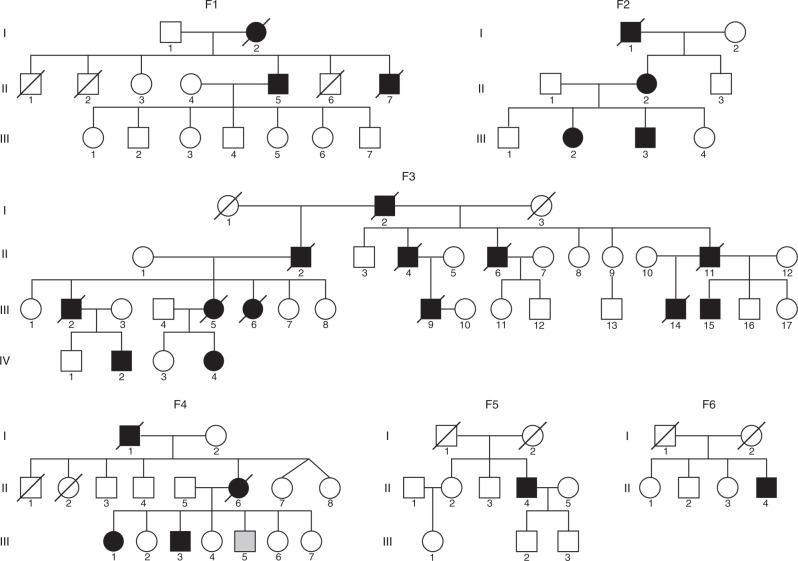
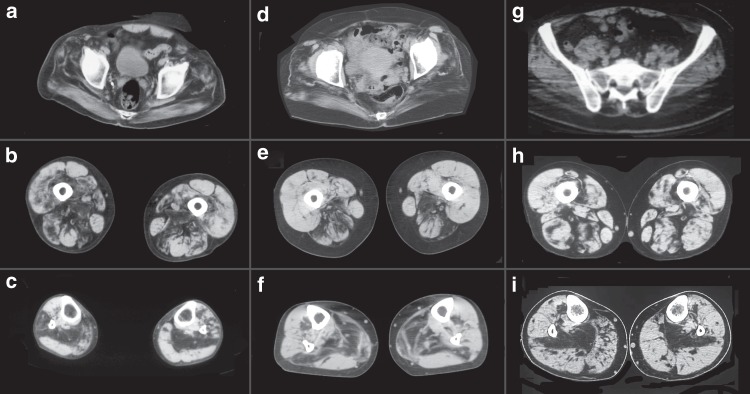
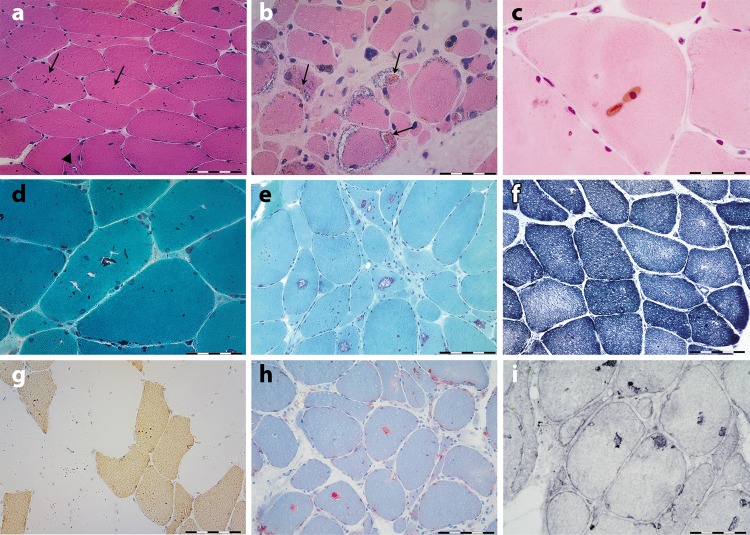
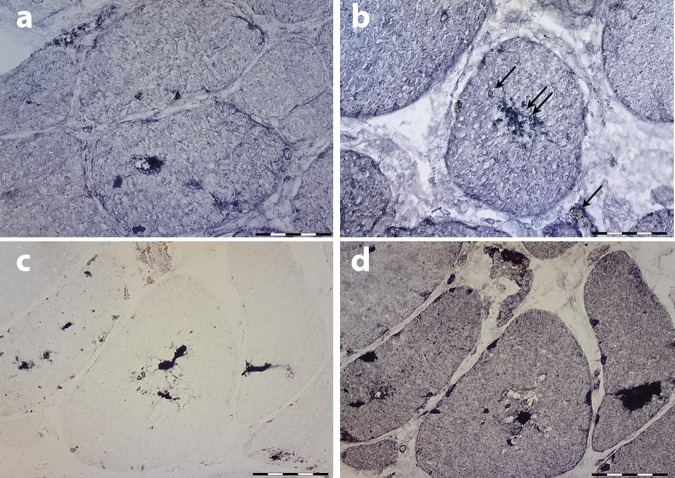
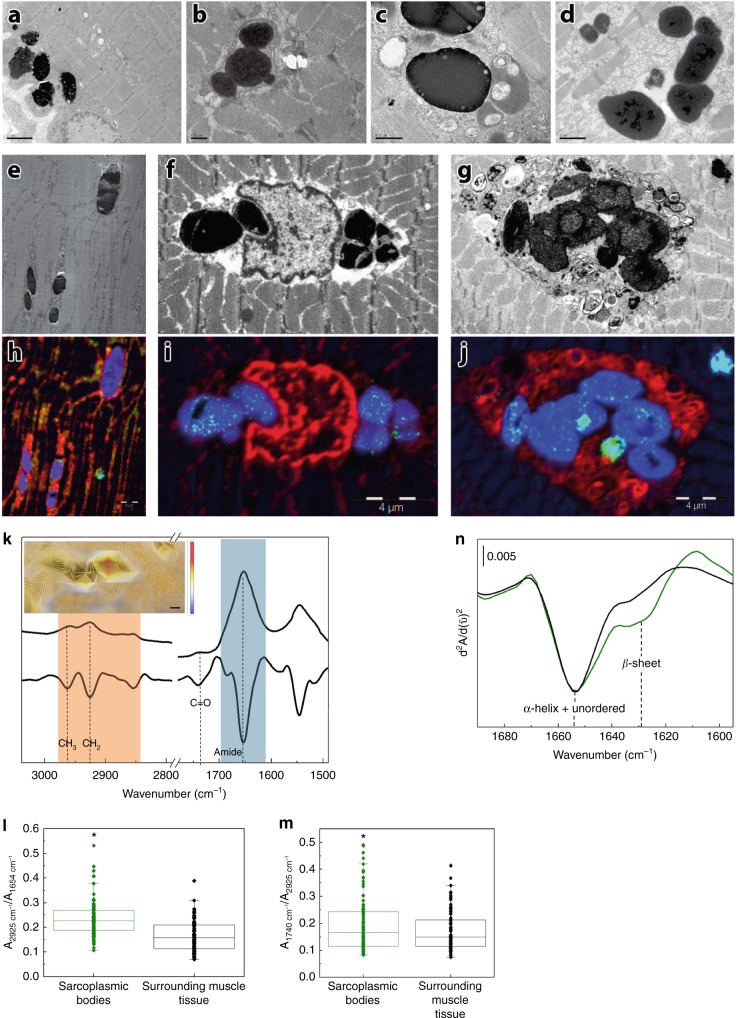
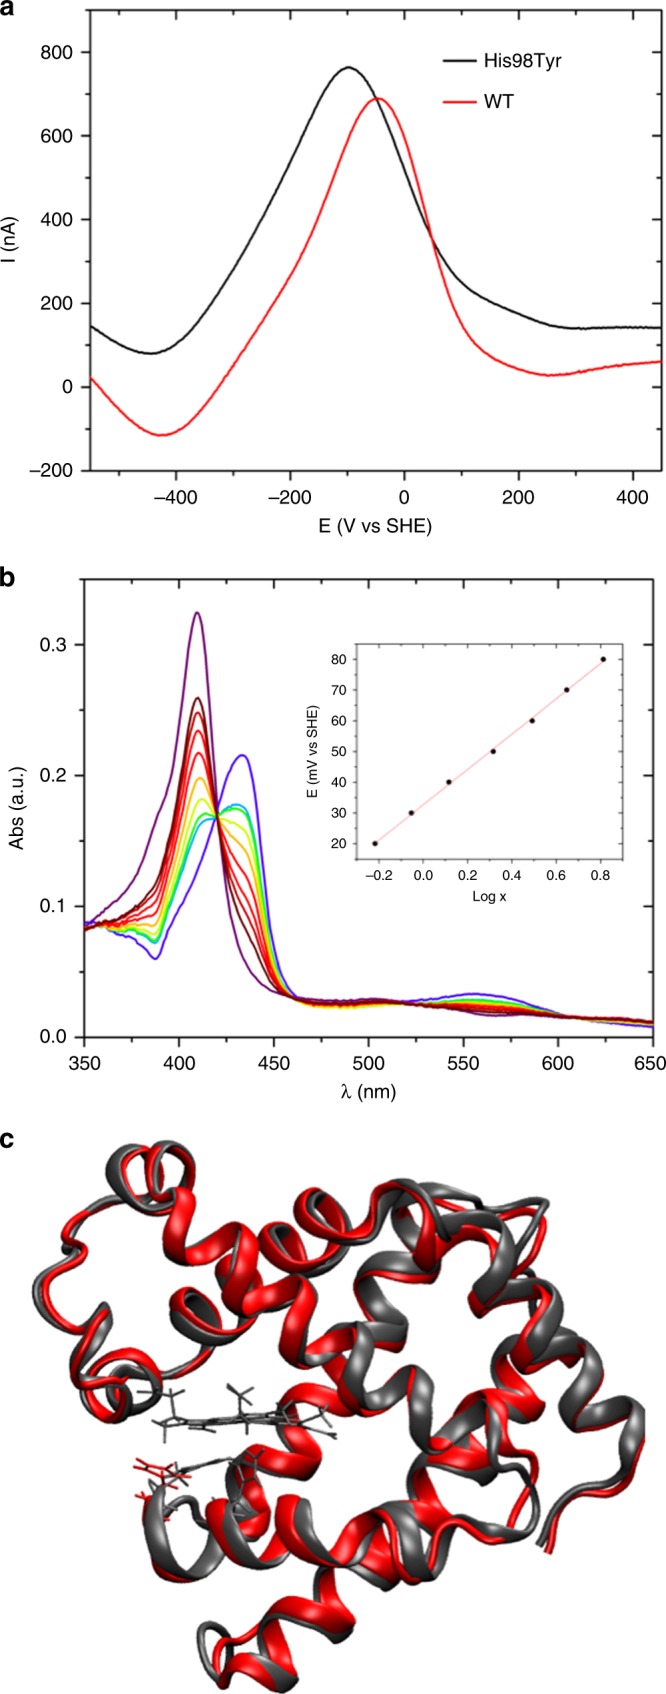
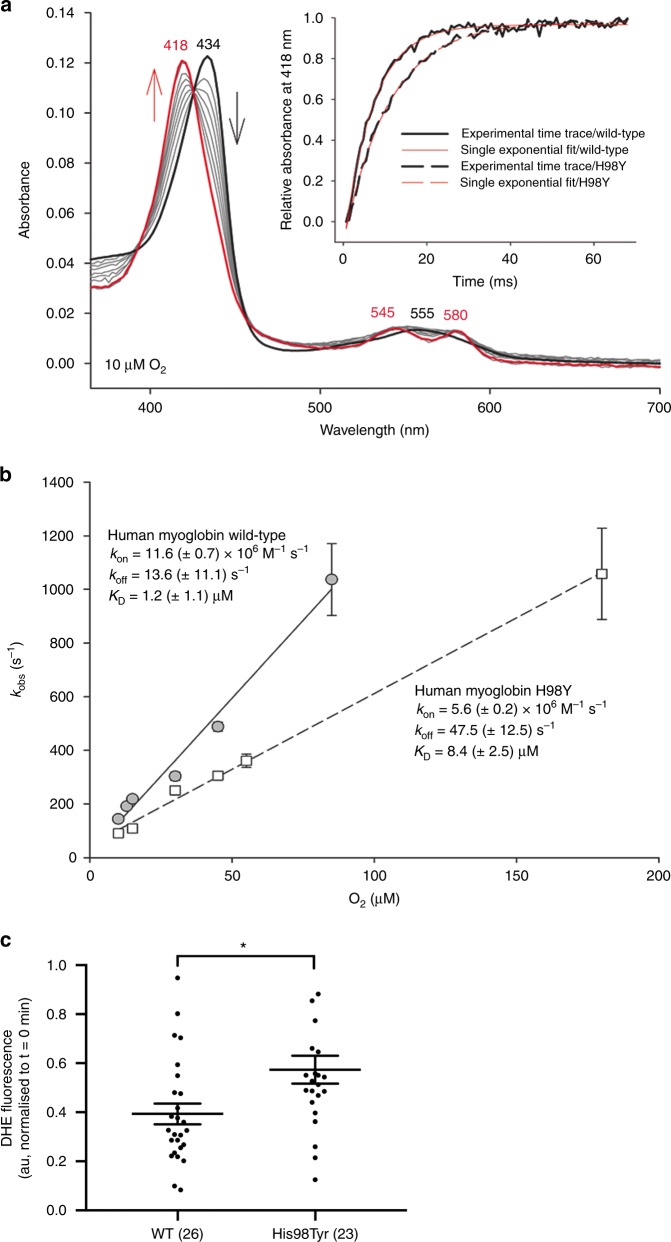
Myoglobin, encoded by MB, is a small cytoplasmic globular hemoprotein highly expressed in cardiac myocytes and oxidative skeletal myofibers. Myoglobin binds O2, facilitates its intracellular transport and serves as a controller of nitric oxide and reactive oxygen species. Here, we identify a recurrent c.292C>T (p.His98Tyr) substitution in MB in fourteen members of six European families suffering from an autosomal dominant progressive myopathy with highly characteristic sarcoplasmic inclusions in skeletal and cardiac muscle. Myoglobinopathy manifests in adulthood with proximal and axial weakness that progresses to involve distal muscles and causes respiratory and cardiac failure. Biochemical characterization reveals that the mutant myoglobin has altered O2 binding, exhibits a faster heme dissociation rate and has a lower reduction potential compared to wild-type myoglobin. Preliminary studies show that mutant myoglobin may result in elevated superoxide levels at the cellular level. These data define a recognizable muscle disease associated with MB mutation.


Conflict of interest statement

The authors declare no competing interests.

Figures

Fig. 1
Fig. 1
Pedigrees from the six families affected with myoglobinopathy. F1 and F2 Spanish, F3: Swedish, F4 and F5: French, F6: Dutch. Squares represent males; circles, females; filled black symbols indicate affected individuals; filled gray symbol, clinically affected, but not molecularly tested individuals; and slash, deceased
Fig. 2
Fig. 2
Muscle imaging in myoglobinopathy. Muscle CT scan from individuals F1, II: 7 (ac); F4, II: 4 (df); and F5, II: 6 (gi) at the pelvic (a, d and g), mid-thigh (b, e, and h), and mid-leg (c, f, and i). At the pelvis, there is involvement of the gluteus maximus, medius, and minimus. At mid-thigh, there is preferential involvement of the posterior compartment, specially, of the adductor magnus, biceps femoris, and semimembranosus. At the mid-leg, the soleus is the first and most-affected muscle
Fig. 3
Fig. 3
Histochemical features of myoglobinopathy. a Anterior tibialis muscle biopsy from individual F3, III: 15, 10 years prior to the onset of symptoms, stained with hematoxylin and eosin, showing several rounded brown inclusions (arrows) (sarcoplasmic bodies) in the majority of myofibers and very small vacuoles in some myofibers (arrowhead in a). b, c Biceps brachii from individual F1, II: 7, 15 years after disease onset. b Note the presence of collections of sarcoplasmic bodies within the rimmed vacuoles. d, e Sarcoplasmic bodies appear red on modified Gomori trichrome stain. e In muscle biopsies with more advanced pathological lesions, large numbers of rimmed vacuoles are observed. f No major architectural changes are seen on NADH reaction, apart from lack of oxidative activity at the site of vacuoles. g Fast myosin immunohistochemistry demonstrate the presence of sarcoplasmic bodies in both type 1 (slow) and 2 (fast) myofibers. h Myofiber regions containing vacuoles display strong phosphatase activity, and LAMP1 i immunoreactivity. Scale bar in a, e, f, g, and h = 50 µm; scale bar in b, c, d, and i = 20 µm
Fig. 4
Fig. 4
Immunohistochemical features of myoglobinopathy. a, b Small myoglobin aggregates are observed in some myofiber regions and in some sarcoplasmic bodies (double arrow in b), but not in others (arrow in b). c p62 and ubiquitin d immunoreactivity is observed in some myofiber regions, and in some, but not in all sarcoplasmic bodies indicating protein aggregates. Scale bars = 20 µm
Fig. 5
Fig. 5
Characterization of sarcoplasmic bodies, the morphological hallmark of myoglobinopathy. Electron micrographs ad showing collections of highly electron-dense bodies with some less dense material at their periphery. The sarcoplasmic bodies are seen under the sarcolemma (a) and often next to the nuclei. Some sarcoplasmic bodies are surrounded by a membrane (b). Sarcoplasmic bodies of different electron densities near several vesicular structures (c). Sarcoplasmic bodies observed in the cardiac muscle obtained post mortem from individuals F1, II:7 (d) and F3, III:5. Electron micrographs (eg) and the corresponding NanoSIMS images (hj). Blue indicates sulfur (32S), red phosphorus (31P), and green (56Fe), respectively. Sarcoplasmic bodies interspersed between the myofibrils (e), next to nuclei (f), or inside an autophagic vacuole (g). Note the high-sulfur signal in the sarcoplasmic bodies (hj), and the iron signal (green dots within the sarcoplasmic bodies in i, j). Scale bar in a = 2 µm, b  = 5 µm, c = 0.5 µm, d = 1 µm, hj = 4 µm. k Typical µFTIR spectra and their second derivative of the muscle tissue where the lipid region has been highlighted in orange and the protein region in blue; the inset shows the lipid/protein ratio (calculated from the Infrared spectra) on an optical image of a tissue section with sarcoplasmic bodies. The color bar represents intensity of the ratio: blue and red mean low and high lipid content, respectively. The scale bar is four microns. l Box plot graphic of lipid/protein ratio (2925 cm−1/1654 cm−1). m Box plot graphics representing COOH/CH2 ratio indicating lipid oxidation (1739 cm−1/2925 cm−1). Ratios were calculated from the second derivative of the spectra of three different samples from three different patients (at least 10 sarcoplasmic bodies per patient). Boxplots denote the median (center line), interquartile range (box), whiskers that represents the most extreme data that are not >1.5x IQR from the edge of the box and outliers that are the points outside this range. T-tests were used to compare the sarcoplasmic body ratios with the surrounding tissue ratios and determine the p value (*p<0.005). n Infrared second derivative spectrum of the amide region of one sarcoplasmic body (green) showing an increase of β-sheet structures, indicating protein aggregation. Second derivative of the amide region corresponding to the tissue surrounding the sarcoplasmic bodies (black)
Fig. 6
Fig. 6
In vitro and in silico studies of WT and mutant MB. a Typical square wave voltammograms recorded for WT (black) and p.His98Tyr mutant (red) human myoglobin immobilized on a Au electrode in 20 mm phosphate buffer, pH 7.0, 25 °C. b Electronic spectra of p.His98Tyr mutant of human myoglobin obtained at various applied potentials E in spectroelectrochemical experiments carried out with an optical thin-layer electrochemistry cell at pH 7.0, 25 °C. The corresponding Nernst plot is shown in the inset, where x = [(Amaxλred−Aλred)−(Amaxλox−Aλox). c Overlay of cartoon representations of representative structures sampled within the MD simulations for native (red) and p.His98Tyr mutant (black) human myoglobin. His98 is also shown as stick with the same color coding. The heme group and Fe-ligand residue His94 is shown only for WT for sake of clarity
Fig. 7
Fig. 7
Kinetics of dioxygen binding to wild-type human myoglobin and the variant His98Tyr. a Spectral changes upon reaction of 1 µm ferrous wild-type hMb (black line) with 10 µm O2. The final spectrum represents oxymyoglobin (red line, 68 ms after mixing). Gray lines represent spectra obtained at 0.68, 2.72, 4.08, 6.12, 8.84, 12.24, 34.00, and 51.00 ms after mixing. The inset depicts experimental time traces at 418 nm of wild-type hMb (solid black line) and p.His98Tyr MB (dashed black line) mixed with 10 µm O2 and corresponding single-exponential fits (solid red line, wild-type MB; dashed red line, His98Tyr MB). b Linear dependence of kobs values from the O2 concentration for wild-type MM (gray circles, solid line) and p.His98Tyr MB (white squares, dashed line). c Basal intracellular superoxide levels in HEK293FT cells expressing WT or mutant MB-EGFP. Data presented as individual data points and the mean ± SEM, numbers in parenthesis represent n. *indicates p = 0.007 (Mann–Whitney test, two-tailed)

References

    1. Ordway GA, Garry DJ. Myoglobin: an essential hemoprotein in striated muscle. J. Exp. Biol. 2004;207:3441–3446. doi: 10.1242/jeb.01172. - DOI - PubMed
    1. Wittenberg JB, Wittenberg BA. Myoglobin function reassessed. J. Exp. Biol. 2003;206:2011–2020. doi: 10.1242/jeb.00243. - DOI - PubMed
    1. Kanatous SB, Garry DJ. Gene deletional strategies reveal novel physiological roles for myoglobin in striated muscle. Respir. Physiol. Neurobiol. 2006;51:151–158. doi: 10.1016/j.resp.2005.12.001. - DOI - PubMed
    1. Flögel U, Gödecke A, Klotz LO, Schrader J. Role of myoglobin in the antioxidant defense of the heart. FASEB J. 2004;18:1156–1158. doi: 10.1096/fj.03-1382fje. - DOI - PubMed
    1. Richards MP. Redox reactions of myoglobin. Antioxid. Redox Signal. 2013;18:2342–2351. doi: 10.1089/ars.2012.4887. - DOI - PMC - PubMed

Publication types

MeSH terms