. 2019 Mar 27;9(1):5244.
doi: 10.1038/s41598-019-41706-z.

Influence of p53 Isoform Expression on Survival in High-Grade Serous Ovarian Cancers

Affiliations

Influence of p53 Isoform Expression on Survival in High-Grade Serous Ovarian Cancers

Katharina Bischof et al. Sci Rep. .

Abstract

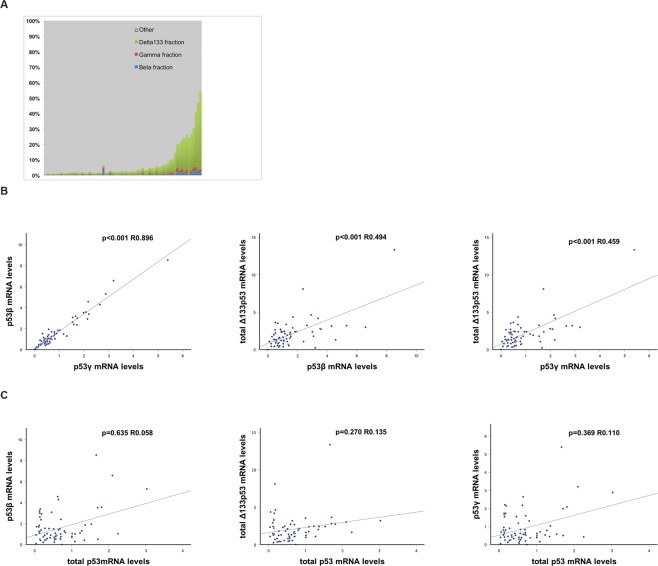
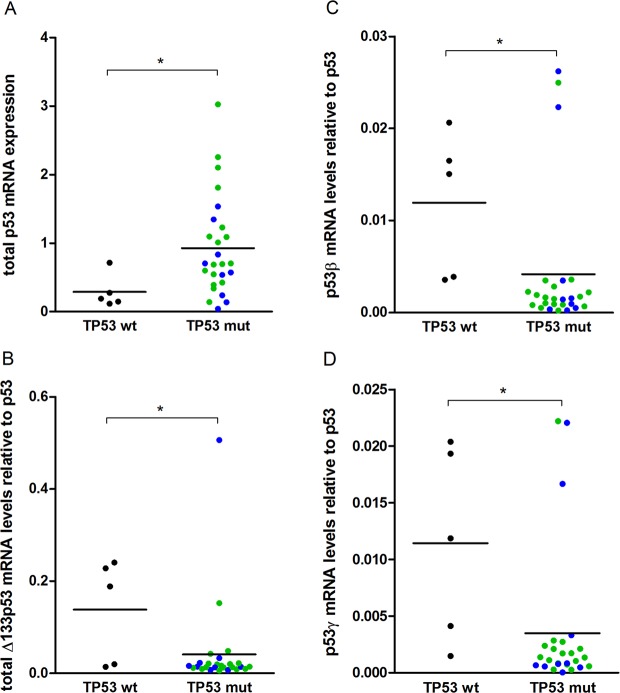
High-grade serous ovarian carcinoma (HGSOC) is characterised by alterations in the p53 pathway. The expression levels of p53 isoforms have been shown to be associated with patient survival in several cancers. This study examined the predictive and prognostic effects of the expression levels of TP53 pre-mRNA splicing isoforms and TP53 mutations in tumour tissues in 40 chemotherapy responders and 29 non-responders with HGSOC. The mRNA expression levels from total p53, and total Δ133p53, p53β, p53γ isoforms were determined by RT-qPCR, and TP53 mutation status by targeted massive parallel sequencing. The results from these analyses were correlated with the clinical outcome parameters. No differential expression of p53 isoforms could be detected between the chemosensitive and chemoresistant subgroups. In a multivariate Cox regression model, high levels of total Δ133p53 were found to be an independent prognosticator for improved overall survival (HR = 0.422, p = 0.018, 95% CI: 0.207-0.861) and reached borderline significance for progression-free survival (HR = 0.569, p = 0.061, 95% CI: 0.315-1.027). TP53 mutations resulting in loss of function or located at known hotspots were predictive of tumour characteristics and disease progression. These findings suggest that total Δ133p53 mRNA can be a biomarker for survival in HGSOC.


Conflict of interest statement

The authors declare no conflicts of interest.

Figures

Figure 1
Figure 1
(A) Overview of FIGO disease stages represented by the series for this study and illustration of sample collection and extraction of DNA and RNA. (B) Structure of the human TP53 gene comprising 11 exons. P1 = proximal promoter encoding full-length p53, P2 = internal promoter resulting in Δ133p53 product. Alternative splicing sites (^). Primer location is indicated by coloured arrows and is indexed on the lower left. (C) Provides a more detailed schematic illustration of the distinct functional and structural domains of the 393 amino acid long p53 protein. TA1 and TA2 form the transactivation domain, followed by the proline rich domain (PD) and the DNA binding domain, where the three most frequently found point mutations in high-grade serous gynaecological cancers are indicated. The tetramerization domain (TET) and basic region (BR) form the C-terminus. (D) Illustrates the exon composition of canonical p53 and relevant p53 isoforms. Abbreviations: Transactivation domain (TA), DNA binding domain (DBD), C-terminal oligomerization domain (OD). The N-terminally truncated isoform Δ133p53 is a product of the regulation of an internal promoter in intron 4 (P2). The C-terminally altered p53β and p53γ isoforms have alternative sequences after amino acid 332. Molecular weight indicated in kilodalton (kd) on the right side.
Figure 2
Figure 2
mRNA expression of p53 isoforms in tumour samples illustrated as (A). Histogram displaying fractions of p53 isoforms to total p53 mRNA in individual specimens. (B) Expression of p53 isoforms between each other; p53γ versus p53β, p53β versus Δ133p53, p53γ versus Δ133p53. (C) Expression levels of total p53, together with individual p53β, Δ133p53 and p53γ isoforms.
Figure 3
Figure 3
mRNA expression levels in individual tumour samples stratified for TP53 mutation status for (A). Total p53 mRNA, (B) p53β mRNA relative to total p53, (C) Δ133p53 mRNA relative to total p53, (D) p53γ mRNA relative to total p53. *Denotes significance level p ≤ 0.05 blue colour indicates unclassified TP53 mutation, green colour denominates the LOF/hot spot TP53 mutation category.
Figure 4
Figure 4
Kaplan-Meier survival plots for differential survival in patients expressing. (A) Higher vs. lower than median levels of Δ133p53 relative to total p53. (B) Illustration of PFS in patients, divided by median expression of Δ133p53 mRNA. (C) Kaplan-Meier survival plot for patients carrying cancers classified as TP53 wild-type, LOF and hotspot mutations vs. other TP53 mutations.

References

    1. Kandoth C, et al. Mutational landscape and significance across 12 major cancer types. Nature. 2013;502(7471):333–339. doi: 10.1038/nature12634. - DOI - PMC - PubMed
    1. Patch AM, et al. Whole-genome characterization of chemoresistant ovarian cancer. Nature. 2015;521(7553):489–94. doi: 10.1038/nature14410. - DOI - PubMed
    1. Cancer Genome Atlas Research Network. Integrated genomic analyses of ovarian carcinoma. Nature. 2011;474(7353):609–15. doi: 10.1038/nature10166. - DOI - PMC - PubMed
    1. Ahmed AA, et al. Driver mutations in TP53 are ubiquitous in high grade serous carcinoma of the ovary. J Pathol. 2010;221(1):49–56. doi: 10.1002/path.2696. - DOI - PMC - PubMed
    1. Brosh R, Rotter V. When mutants gain new powers: news from the mutant p53 field. Nat Rev Cancer. 2009;9(10):701–13. doi: 10.1038/nrc2693. - DOI - PubMed

Publication types