. 2019 Apr;568(7752):410-414.
doi: 10.1038/s41586-019-1062-1. Epub 2019 Mar 27.

Syndecan 1 is a critical mediator of macropinocytosis in pancreatic cancer

Affiliations

Syndecan 1 is a critical mediator of macropinocytosis in pancreatic cancer

Wantong Yao et al. Nature. 2019 Apr.

Abstract

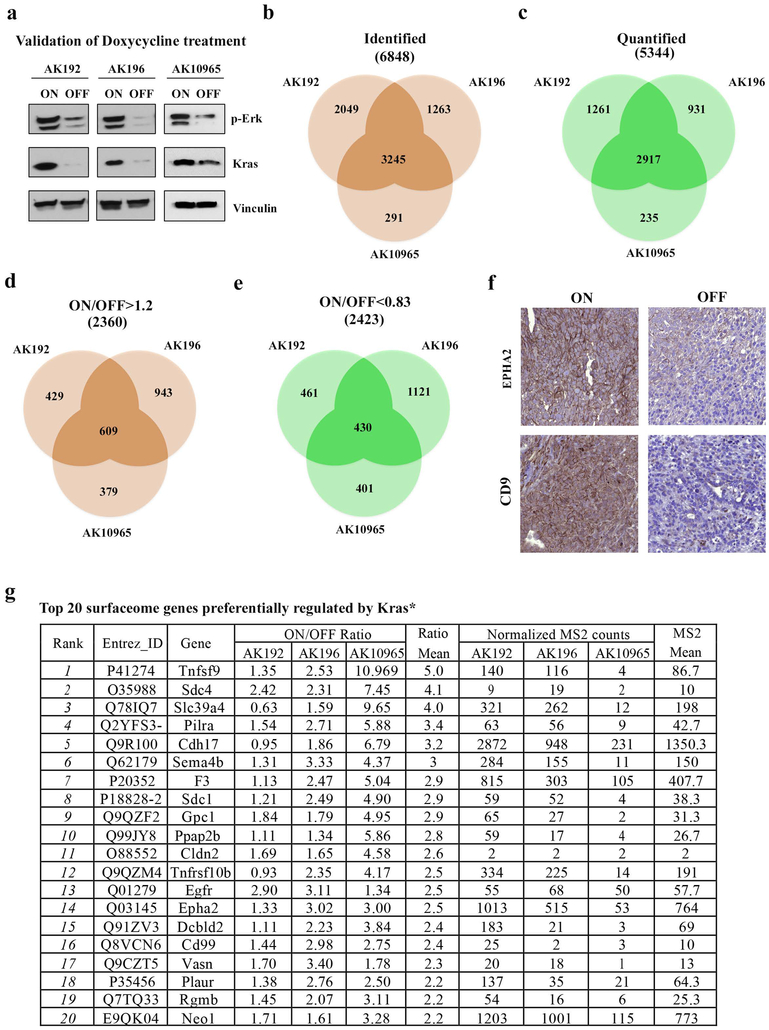
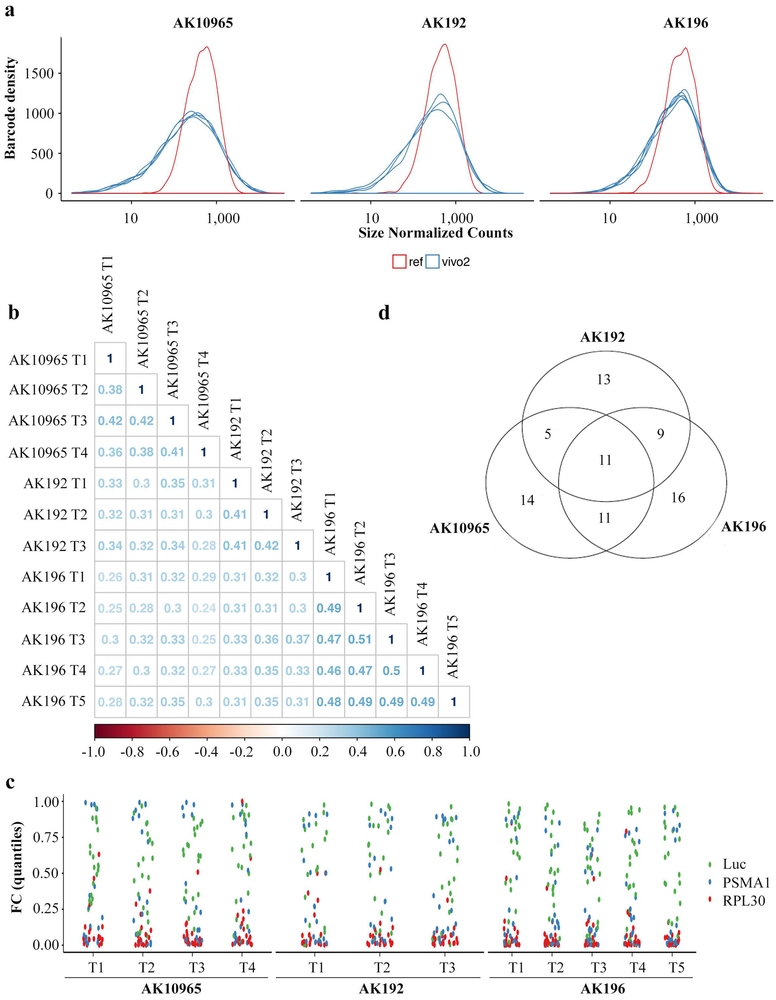
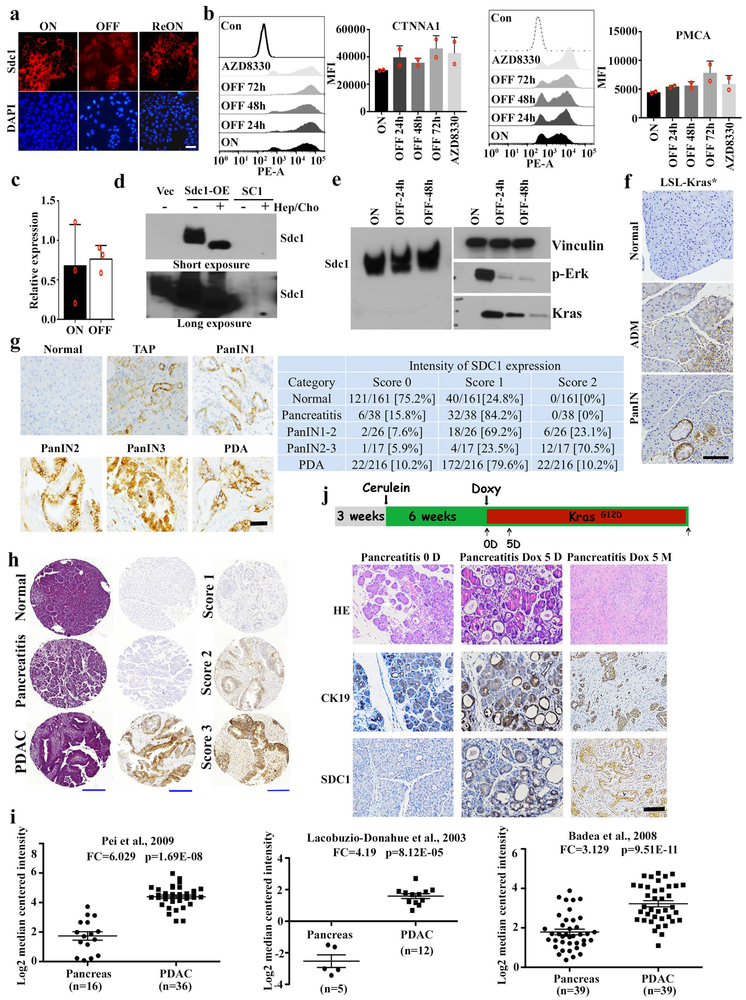
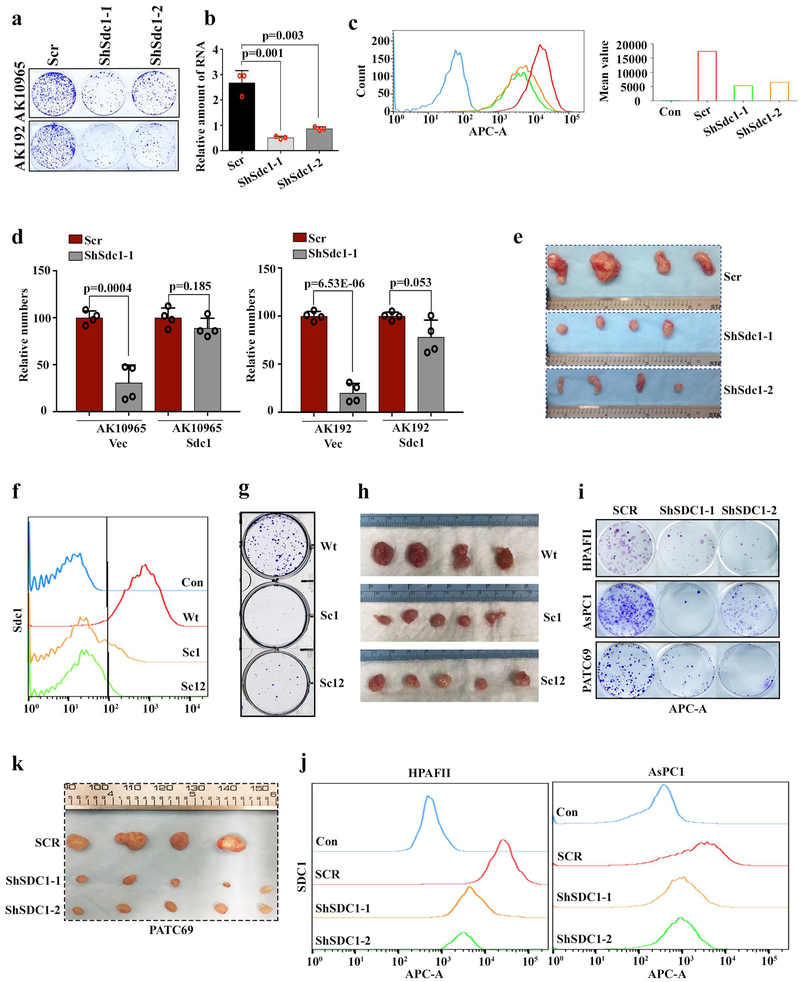
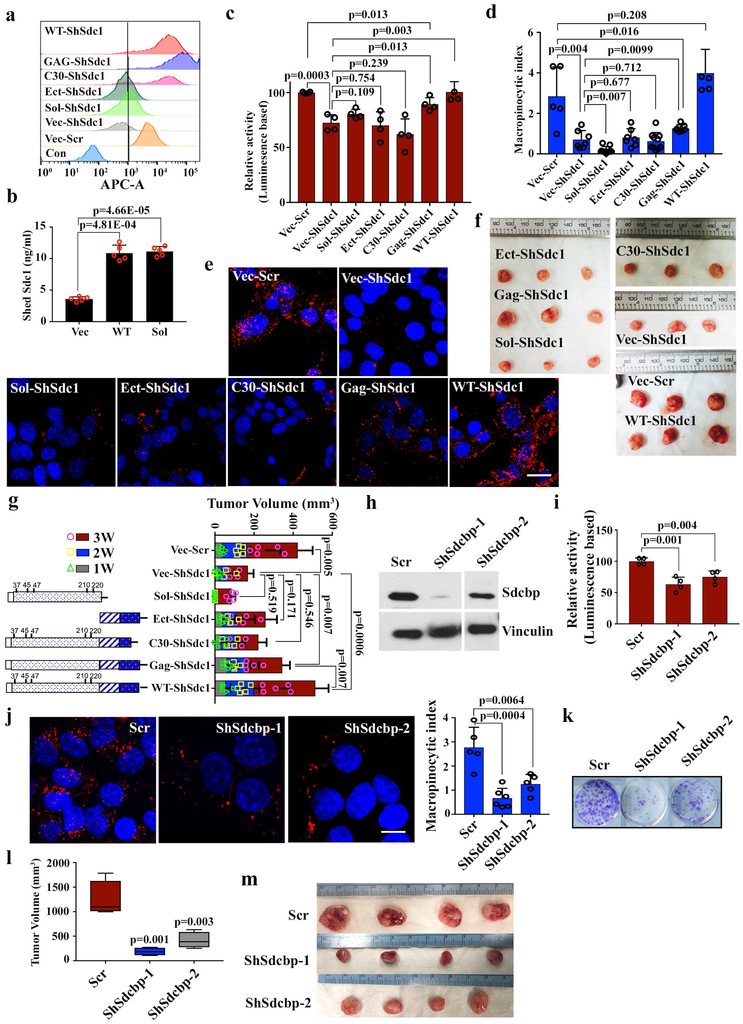
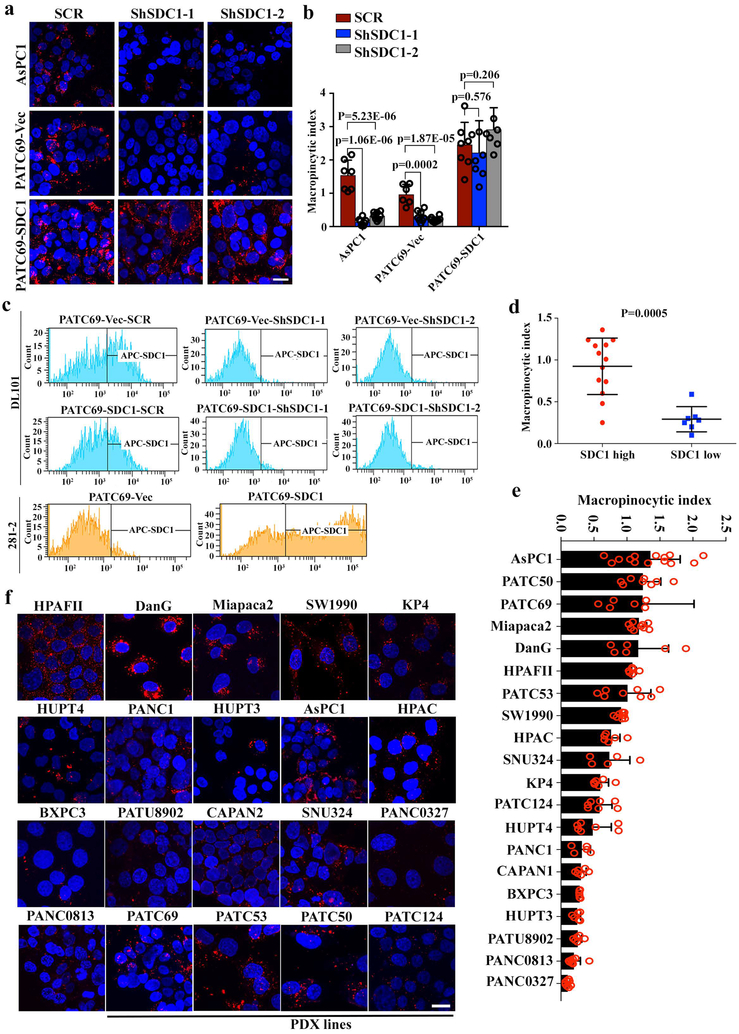
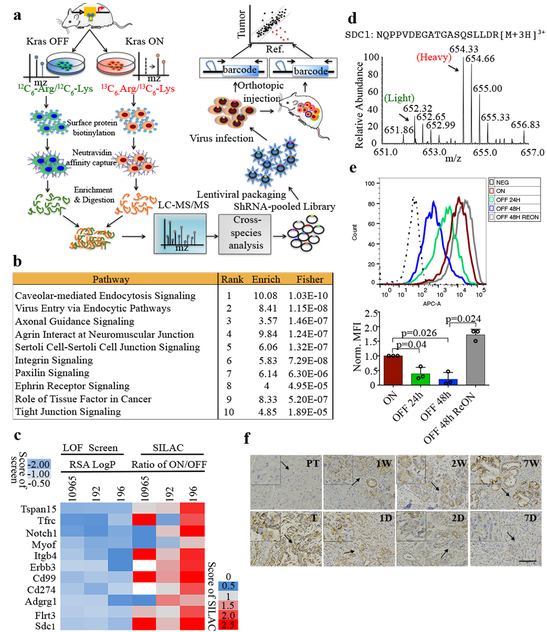
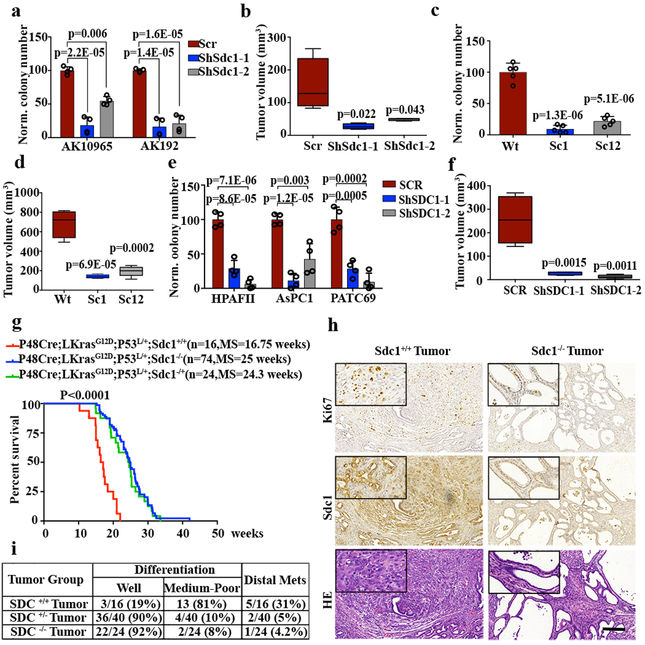
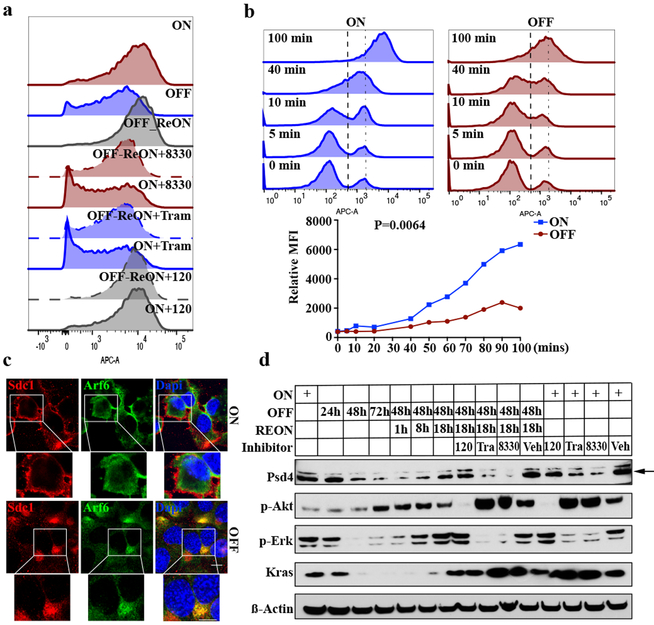
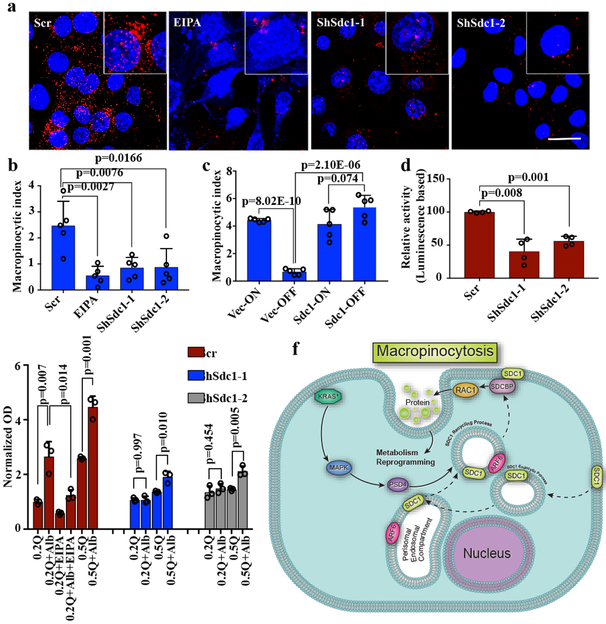
Pancreatic ductal adenocarcinoma (PDAC) remains recalcitrant to all forms of cancer treatment and carries a five-year survival rate of only 8%1. Inhibition of oncogenic KRAS (hereafter KRAS*), the earliest lesion in disease development that is present in more than 90% of PDACs, and its signalling surrogates has yielded encouraging preclinical results with experimental agents2-4. However, KRAS*-independent disease recurrence following genetic extinction of Kras* in mouse models anticipates the need for co-extinction strategies5,6. Multiple oncogenic processes are initiated at the cell surface, where KRAS* physically and functionally interacts to direct signalling that is essential for malignant transformation and tumour maintenance. Insights into the complexity of the functional cell-surface-protein repertoire (surfaceome) have been technologically limited until recently and-in the case of PDAC-the genetic control of the function and composition of the PDAC surfaceome in the context of KRAS* signalling remains largely unknown. Here we develop an unbiased, functional target-discovery platform to query KRAS*-dependent changes of the PDAC surfaceome, which reveals syndecan 1 (SDC1, also known as CD138) as a protein that is upregulated at the cell surface by KRAS*. Localization of SDC1 at the cell surface-where it regulates macropinocytosis, an essential metabolic pathway that fuels PDAC cell growth-is essential for disease maintenance and progression. Thus, our study forges a mechanistic link between KRAS* signalling and a targetable molecule driving nutrient salvage pathways in PDAC and validates oncogene-driven surfaceome annotation as a strategy to identify cancer-specific vulnerabilities.


Figures

Extended Data Figure 1.
Extended Data Figure 1.. Interrogation of surfaceome changes upon Kras* signaling by SILAC based proteomic analysis.
a, Western blot for p-Erk and Kras in iKras p53L/+ cells in the presence (ON) or absence (OFF) of doxycycline for 24 hours. The experiment was repeated twice with similar results. b-c, Venn diagram shows the total number of identified (b) and quantified (c) proteins with SILAC-based proteomic analysis upon Kras* inactivation in three independent iKras p53L/+ cells. d-e, Venn diagram shows the number of decreased (Kras* ON/OFF ratio >1.2) (d) or increased Kras* ON/OFF ratio <0.83) (e) proteins quantified with normalized MS2 counts >2 from the SILAC-based proteomic analysis upon Kras* inactivation in three independent iKras p53L/+ cell cultures. f, IHC staining for EPHA2 and CD9 in orthotopic xenograft tumors from iKras p53L/+ model in the presence (ON) or absence (OFF) of doxycycline for 24 hours (scale bar: 100μm). The experiment was repeated twice with similar results. g, Top 20 surfaceome genes preferentially regulated by Kras*.
Extended Data Figure 2.
Extended Data Figure 2.. Functional surfaceome analysis identified SDC1 as a KRAS*-dependent surface candidate.
a, Normalized counts showing the distribution of reference and tumor barcodes to establish library coverage in vivo in three independent iKras p53L/+ tumor cells cultures, which show similar results. In vivo screens were conducted in 3-5 mice for for each cell culture. b, Correlation matrix among replicates of orthotopic xenograft-derived AK192, AK196, and AK10965 tumors screened with the surfacome-targeting shRNA library (barcode level fold-change comparison, Pearson correlation coefficient). c, Positive (Psma, Rpl30) and negative (Luc) controls were plotted applying the RSP/LogP score. d, Venn diagram shows the number of hits identified from three independent iKras p53L/+ tumor cell cultures.
Extended Data Figure 3.
Extended Data Figure 3.. SDC1 membrane expression is elevated in KRAS*-driven PDAC.
a, iKras p53L/+ tumor cells were grown in the presence (ON) or absence (OFF) of doxycycline for 48 hours and subjected to IF staining for SDC1 (red) and DAPI (blue) (scale bar: 20 μm). For REON sample, cells were grown in the absence of doxycycline for 48 hours followed by doxycycline treatment for 24 hours. Representative images were shown, which were repeated three times with similar results. b, iKras p53L/+ tumor cells were grown in the presence (ON) or absence (OFF) of doxycycline for indicated time periods or treated with MEK inhibitor (AZD8330, 100nM) for 16-18 hours and surface protein levels of CTNNA1 and PMCA were measured by FACS analysis. The quantification of fluorescence intensity is shown. Representative figures and data from biological duplicates are shown. c, iKras p53L/+ tumor cells were grown in the presence (ON) or absence (OFF) of doxycycline for 24 hours and Sdc1 mRNA level was measured with qPCR (n=3, Data are mean + s.d.). Experiments were repeated twice with similar results. d, iKras p53L/+ tumor cells stably overexpressing Sdc1 (Sdc1-OE) or empty vector (Vec) and a stable single clone with double nickase-mediated Sdc1 deletion (SC1) derived from iKras p53L/+ tumor cells were blotted to validate SDC1 expression. Some samples were also treated with heparinase (Hepa) and chondroitinase (Cho) before Western blot analysis. Experiments were repeated twice with similar results. e, iKras p53L/+ tumor cells grown in the presence (ON) or absence (OFF) of doxycycline for indicated time periods were processed for Western blot analysis to detect Sdc1, Vinculin, p-Erk and Kras. Experiments were repeated twice with similar results. f, Representative IHC images of SDC1 staining from the LSL-Kras PDAC mouse model showing membrane Sdc1 level in normal pancreas, acinar-to-ductal metaplasia (ADM), and PanIN. Experiments were repeated twice with similar results. Scale bar: 200 μm. g, Representative IHC images of SDC1 staining (lef) in normal pancreas, tumor adjacent pancreatitis (TAP), PanINs and invasive tumors (PDA) from the human PDAC TMA. Quantification of the TMA scores is shown in the right panel. Scale bar: 50 μm. h, Representative HE and IHC images of SDC1 staining from the TMA analysis. Representative images of SDC1 IHC showing staining classified as low (Score 1), intermediate (Score 2) and high (Score 3). Scale bar: 200 μm. i, mRNA expression of SDC1 in public microarray datasets. Data are mean ± s.d.; P-values were determined by unpaired two-sided Student’s t-test. j, Outline of experimental design for sequential cerulein and doxycycline treatment in iKras* mice (Top). Chronic pancreatitis was induced in iKras* mice with cerulein injection for 6 weeks. The animals were then treated with doxycycline for indicated times. Pancreatic or tumor tissues were subjected to HE or IHC staining for CK19 and SDC1 (scale bar: 100 μm) (Bottom). Experiments were repeated twice with similar results.
Extended Data Figure 4.
Extended Data Figure 4.. SDC1 is required for tumorigenic activity of KRAS*-driven PDAC.
a, Representative pictures of clonogenic assay for two independent iKras p53L/+ PDAC cells infected with scrambled (Scr) shRNA or shRNA against Sdc1. Experiments were repeated 3 times with similar results. b-c, Validation of Sdc1 knockdown by qPCR (l) and FACS analysis with anti-Sdc1 antibody (c) in iKras p53L/+ PDAC cells infected with scrambled (Scr) shRNA or shRNA against Sdc. b: n=3; Data are mean + s.d.; P-values were determined by unpaired two-sided Student’s t-test. c: Experiments were repeated 3 times with similar results. d, Two independent iKras p53L/+ tumor cells stably expressing Sdc1 or empty vector (Vec) were infected with scrambled (Scr) or shRNA against Sdc1. Quantification of clonogenic assay is displayed (n=4 biological replicates; Data are mean + s.d.). P-values were determined by unpaired two-sided Student’s t-test. e, Digital photographs of dissected tumors from mice implanted with iKras p53L/+ tumor cells harboring scrambled (Scr) or shRNA against Sdc1. f, Validation of double nickase-mediated Sdc1 deletion in iKras p53L/+ PDAC cells using 281-2 anti-Sdc1 antibody and FACS analysis. Experiments were repeated twice with similar results. g, Representative figure of clonogenic assay for iKras p53L/+ PDAC cells with wild type Sdc1 or double nickase-mediated Sdc1 deletion. Experiments were repeated twice with similar results. h, Digital photographs of dissected tumors from mice implanted with iKras p53L/+ tumor cells with wild type Sdc1 or double nickase-mediated Sdc1 deletion. i, Representative figure of clonogenic assay for human PDAC cells infected with scrambled (SCR) shRNA or shRNA against human SDC1. Experiments were repeated twice with similar results. j, Validation of SDC1 knockdown by shRNA in human PDAC cell lines from (i) using DL-101 anti-SDC1 antibody and FACS analysis. Experiments were repeated twice with similar results. k, Digital photographs of dissected tumors from subcutaneous xenografts of mice implanted with PATC69 cells infected with scrambled (SCR) shRNA or shRNA against human SDC1.
Extended Data Figure 5.
Extended Data Figure 5.. Sdc1 loss leads to changes in tumor microenvironment.
a, Validation of Sdc1 level by FACS analysis in primary cultures derived from the PDAC mouse model with indicated Sdc1 genotypes. Experiments were repeated twice with similar results. b-c, Quantification (a) and representative images (b) of immuno-profiling of Sdc1 wild type and knockout (KO) tumors from GEM model by IHC or IF staining (n=20 random images from 4 biological replicates). P-values were determined by unpaired two-sided Student’s t-test.
Extended Data Figure 6.
Extended Data Figure 6.. KRAS* induces SDC1 membrane expression through MAPK pathway.
a-b, iKras p53L/+ PDAC cells were grown in presence (ON) or absence (OFF) of doxycycline for 48 hours. REON: cells were grown in absence of doxycycline for 48 hours followed by doxycycline treatment for 24 hours. Treatment of ON or REON samples with trametinib (50 nM) or BKM120 (100 nM) for 16-18 hours is indicated. (a) Cells were stained with anti-Sdc1 antibody and surface Sdc1 was measured via FACS. The quantification of fluorescence intensity from biological duplicates is shown as mean + s.d.. (b) Cell lysates were blotted for phospho-Erk, phospho-Akt, Kras and Vinculin as loading controls. Experiments were repeated twice with similar results. c-f, iKras p53L/+ PDAC cells were treated with different concentrations of MEK inhibitor Tramatinib (c, d) and AZD8330 (e, f) for overnight (16-18h), and then the live cells were prepared for FACS analysis for SDC1 (c, e) (Data is shown as mean + s.d.); cell lysates were blotted for phospho-ERK, phospho-MEK, KRAS and Vinculin as loading control (d, f). Experiments were repeated twice with similar results. g, Outline of experimental design to measure Sdc1 shedding (Left). iKras p53L/+ PDAC cells were grown in the presence (ON) or absence (OFF) of doxycycline for 24 or 48 hours. Medium was collected and shed Sdc1 was measured by anti-Sdc1 ELISA (Right) (n=4 biological replicates; Data is shown as mean + s.d.). h, Outline of experimental design to measure surface Sdc1 internalization (Left). iKras p53L/+ PDAC cells were grown in the presence (ON) or absence (OFF) of doxycycline for 48 hours. Cells were then incubated at 37° C for indicated times and surface Sdc1 was labeled with anti-Sdc1 antibody at 4° C after internalization for indicated times. FACS was performed to detect remaining Sdc1 on the cell membrane (Right) (n=2 biological replicates; data is shown as mean + s.d.). i-j, Outline of experimental design to measure surface Sdc1 recycling (i, left). iKras p53L/+ PDAC cells were grown in the presence (ON) or absence (OFF) of doxycycline for 48 hours (Left). Surface Sdc1 was labeled with anti-Sdc1 at 4° C. Cells were then incubated at 37° C for 30 minutes to allow Sdc1 internalization. This was followed by incubating cells on ice to halt internalization; subsequently, cells were returned to 37° C for indicated times to allow Sdc1 recycling. Recycled Sdc1 was measured via FACS (i, right). The histograms of FACS analysis illustrating the recycled cell surface Sdc1 at the indicated detecting time points were shown in j. Experiments were repeated twice with similar results.
Extended Data Figure 7.
Extended Data Figure 7.. MAPK-PSD4-ARF6 axis mediates KRAS*-dependent SDC1 membrane localization.
a, Cells were grown in presence (ON) or absence (OFF) of doxycycline or treated with AZD8330 (100 nM) for 16-18 hours. (Top) ARF6 activity was measured with GGA3-PBD pull down assay. GTP and GDP used as positive and negative controls, respectively. (Bottom insert) ARF6 activity was calculated as ratio of captured Arf6:input Arf6/vinculin. b, iKras p53L/+ tumor cells were grown in the presence (ON) or absence (OFF) of doxycycline, or treated with AZD8330 (100 nM) for 16-18 hours. Cell lysates were used for measurement of PIPK activity (n=3 biological replicates; Data are mean + s.d.). P-values were determined by unpaired two-sided Student’s t-test. c, Representative images of morphology change in iKras p53L/+ tumor cells with dominant negative Arf6 (ArfT27N) or constitutively active Arf6 (ArfQ67L). Experiments were repeated 3 times with similar results. d, iKras p53L/+ tumor cells stably expressing Arf6Q67L or its empty vector (Vec) were grown in the presence (ON) or absence (OFF) of doxycycline for 48 hours and surface Sdc1 were measured with FACS using anti-Sdc1 antibody (Top). The fluorescence intensity of surface SDC1 is shown (Bottom) (n=4 biological replicates; Data are mean + s.d.). P-values were determined by paired two-sided Student’s t-test. e, iKras p53L/+ tumor cells stably expressing Arf6T27N or empty vector (Vec) were grown in the presence (ON) or absence (OFF) of doxycycline for 48 hours and surface Sdc1 were measured with FACS using anti-Sdc1 antibody. Representative histograms (top) and bar figure of fluorescence intensity were shown (bottom) (n=3 biological replicates; Data are mean + s.d.). P-values were determined by paired two-sided Student’s t-test. f, mRNA expression of GAPs and GEFs of Arf6 in iKras p53L/+ tumor cell microarray dataset upon KrasG12D inactivation (n=4 biological replicates). P-values were determined by unpaired two-sided Student’s t-test. g, iKras p53L/+ tumor cells were grown in the presence (ON) or absence (OFF) of doxycycline, or treated with Trametinib (50 nM) for 16-18 hours and Psd4 mRNA level was measured by qPCR (n=3). P-values were determined by unpaired two-sided Student’s t-test. h, MiaPaCa2 cells harboring doxycycline-inducible shRNA targeting human KRAS were grown in the absence (OFF) or presence (ON) of doxycycline, or treated with Trametinib (50 nM), AZD8330 (50 nM), or BKM120 (100 nM) for 18 hours. Cell lysates were blotted for PSD4, phosphor-ERK and KRAS. Arrow: band for PSD4. Experiments were repeated twice with similar results. i, iKras p53L/+ tumor cells stably expressing Psd4 or its empty vector were grown in the presence (ON) or absence (OFF) of doxycycline for 48 hours. ARF6 activity was measured by GGA3-PBD pull down assay. Input lysates were immunoblotted to validate expression of Arf6, p-Erk, p-Mek, Psd4, and Kras. Experiments were repeated twice with similar results. j, iKras p53L/+ tumor cells stably expressing Psd4 or its empty vector (Vec) were grown in the presence (ON) or absence (OFF) of doxycycline for 48 hours and surface Sdc1 was measured by FACS using anti-Sdc1 antibody. Representative histograms of FACS analysis (top) and bar figure of fluorescence intensity of surface Sdc1 (bottom) were shown in the plot (n=3 biological replicates; Data are mean + s.d.). P-values were determined by paired two-sided Student’s t-test.
Extended Data Figure 8.
Extended Data Figure 8.. SDC1 mediates macropinocytosis in KRAS*-driven mouse PDAC cells.
a-b, iKras p53L/+ tumor cells were grown in the presence (ON) or absence (OFF) of doxycycline for 24 hours. For a positive control, cells grown in the presence of doxycycline were treated with EIPA (50 μM) for 16 hours. Macropinocytosis was visualized with TMR-dextran (scale bar: 20 μm) (a) and quantified (b) (n=8 random areas for ON/OFF groups and n=5 for EIPA group; data are mean + s.d.). Data are representative of three independent experiments with similar results. c, Validation of Sdc1 knocking down by qPCR in iKras p53L/+ tumor cells (n=3; data are mean + s.d.). d, Macropinocytosis index in LSL-Kras p53L/+ tumor cells harboring scrambled (Scr) shRNA or shRNA against Sdc (n=6 random areas; data are mean + s.d.). e-f, iKras p53L/+ tumor cells stably expressing Psd4 or empty vector (Vec) were grown in the presence (ON) or absence (OFF) of doxycycline for 48 hours. Macropinocytosis was visualized with TMR-dextran (scale bar: 20 μm) and quantified (n=6 random areas for Vec-ON, Psd4-ON and Psd4-OFF groups and n=8 for Vec-OFF group; data are mean + s.d.). Data are representative of two independent experiments with similar results. g, iKras p53L/+ tumor cells stably expressing Sdc1 or empty vector (Vec) were grown in the presence (Kras* ON) or absence (Kras* OFF) of doxycycline for 48 hours. Macropinocytosis was visualized with TMR-dextran (scale bar: 20 μm). Experiments were repeated twice with similar results. h, RhoA activity of iKras p53L/+ tumor cells harboring scrambled (Scr) shRNA or shRNA against Sdc1 was measured with G-LISA activation assay (n=2 biological replicates; data are mean + s.d.). i, Rac1 activity in iKras p53L/+ tumor cells harboring Rac1Q61L or empty vector (Vec) was measured with G-LISA activation assay (n=2 biological replicates; data are mean + s.d.). j-k, iKras p53L/+ tumor cells stably expressing Rac1Q61L or its empty vector were infected with scrambled (Scr) shRNA or shRNA against Sdc1. Macropinocytosis was visualized with TMR-dextran (scale bar: 20 μm) (j) and quantified (k) (n=8 random areas; data are mean + s.d.). Data are representative of two independent experiments with similar results. l, iKras p53L/+ tumor cells were cultured in medium with serial concentrations of glutamine. Growth rate was measured and the timelapse graph was generated by Incucyte Live Cell Analysis System (n=3 technical replicates; data are mean + s.d.). Data is representative of two independent experiments with similar results.
Extended Data Figure 9.
Extended Data Figure 9.. SDCBP1 is required for SDC1-mediated macropinocytosis.
a, iKras p53L/+ tumor cells harboring wild type or different mutant constructs of Sdc1 or empty vector (Vec) were infected with scrambled (Scr) shRNA or shRNA against Sdc1 and surface expression of Sdc1 was measured by FACS; representative histograms are shown. Experiments were repeated twice with similar results. b, Shed Sdc1 from iKras p53L/+ tumor cells stably expressing wild type (WT), soluble mutant Sdc1 (Sol), or empty vector (Vec) was measured by anti-Sdc1 ELISA (n=5 biological replicates; data are mean + s.d.). c-e, iKras p53L/+ tumor cells harboring wild type (WT) or different mutant constructs of Sdc1 or empty vector (Vec) were infected with scrambled (Scr) shRNA or shRNA against Sdc to measure Rac1 activity using G-LISA activation assay (c) (n=4 biological replcates) or macropinocytosis index by visualizing with TMR-dextran (scale bar: 20 μm) and subsequent quantification (d, e). Data are mean + s.d.. Experiments were repeated twice with similar results. f-g, iKras p53L/+ tumor cells harboring wild type (WT) or different mutant constructs of Sdc1 or empty vector (Vec) were infected with scrambled (Scr) shRNA or shRNA against Sdc1 and subcutaneously injected into nude mice. Digital photographs of dissected tumors (f) and tumor volume at indicated time points (g) were shown (n=5 for Vec Scr, Sol-ShSdc1, Ect-ShSdc1, Gag-ShSdc1 and WT-ShSdc1 groups; n=4 for Vec-ShSdc1 and C30-ShSdc1 groups; data are mean + s.d.). h-m, iKras p53L/+ tumor cells were infected with scrambled (Scr) shRNA or shRNA against Sdcbp. (h) Sdcbp knockdown was validated with Western blot. Image of ShSdcbp-2 was cropped from the same picture as Scr and ShSdcbp-1. Experiments were repeated twice with similar results. (i) Rac1 activity was measured by G-LISA activation assay (n=4 biological replicates; data are mean + s.d.). (j) Macropinocytosis was visualized with TMR-dextran (scale bar: 20 μm) and quantified (n=5 random areas for Scr and ShSdcbp-2; n=6 random areas for ShSdcbp-1 group; data are mean + s.d.). Data are representative of two independent experiments with similar results. (k) Representative images of clonogenic assay are shown from two independent experiments with similar results. (l) Cells were subcutaneously injected into nude mice (n=4 for Scr and ShSdcbp-1 groups and n=5 for ShSdcbp-2 group) and tumor size were measured with digital photographs of dissected tumors shown in (m). P-values were determined by unpaired two-sided Student’s t-test.
Extended Data Figure 10.
Extended Data Figure 10.. SDC1 is critical for macropinocytosis in KRAS*-dependent human PDAC
a-c, ASPC1 or PATC69 PDAC cells expressing mouse SDC1 or empty vector (Vec) were infected with scrambled (SCR) shRNA or shRNA against SDC1. Macropinocytosis was visualized with TMR-dextran (scale bar: 20 μm) (a) and quantified (b) (data are mean + s.d.). Data are representative of two independent experiments with similar results. P-values were determined by unpaired two-sided Student’s t-test. (c) Surface SDC1 evaluated by FACS using human anti-SDC1 antibody DL101 or mouse anti-Sdc1 antibody 281-2. Histograms show representative images from two independent experiments with similar results. d, Macropinocytic index of 20 human PDAC cell lines with high (n=13) or low (n=7) SDC1 membrane expression, as determined by FACS analysis. P-value was determined by Mann-Whitney test. e-f, Macropinocytic index was quantified in 20 different PDAC cell lines (e) (Data are mean + s.d.). Representative images of TMR-Dextran (red) staining are shown in f (scale bar: 20 μm). Data are representative of two independent experiments with similar results.
Figure 1.
Figure 1.. Functional surfaceome analysis identified SDC1 as a KRAS*-dependent surface protein important for tumor maintenance.
a, Experimental design for the functional surfaceome analysis. Differentially expressed surface proteins upon KrasG12D inactivation were identified via SILAC-based proteomic analysis. In vivo loss-of-function screening was subsequently conducted with a custom barcoded lentiviral shRNA library targeting the Kras*-dependent surfaceome. Depletion was observed relative to reference population. b, Top 10 canonical signaling pathways identified with IPA analysis of differentially expressed surface proteins upon Kras* activation; n=3 biologically independent samples, enrichment score (Enrich) and P-value (two-sided Fisher) reported. c, Rank of common top-scoring hits from three independent iKras p53L/+ tumor cell lines: RSA/LogP-based cutoff is heatmapped against corresponding quantification rank from SILAC-based proteomic analysis. d, Heavy and light spectra of representative SDC1 peptide show membrane SDC1 in presence (Heavy) or absence (Light) of KrasG12D in iKras p53L/+ tumor cells. e, SDC1 levels of iKras p53L/+ tumor cells in presence (ON) or absence (OFF) of doxycycline were measured by FACS analysis (Top) and quantification of fluorescence intensity is shown (Bottom). REON: cells were grown in absence of doxycycline for 48 hours followed by doxycycline treatment for 24 hours (n=3 biological replicates; data are mean + s.d.; P-values were determined by paired two-sided Student’s t-test). f, Three-week-old iKras p53L/+ mice received doxycycline-containing water for 1/3/7 weeks (W) to induce premalignant lesions or for 9 weeks to induce invasive PDAC (T), then doxycycline was withdrawn for 1/2/7 days (D). SDC1 in pancreatic or tumor tissues was analyzed by IHC (scale bar: 200 μm). Arrows indicate areas magnified in the inserts. d-f: Representative experiments from three independent experiments.
Figure 2.
Figure 2.. SDC1 is required for tumorigenic activity of KRAS*-driven pancreatic cells.
a, Quantification of representative clonogenic assay for two independent iKras p53L/+ PDAC cells infected with Sdc1-targeting or scrambled (Scr) shRNA. b, iKras p53L/+ cells were infected with Sdc1-targeting or SCR shRNA and subcutaneously injected into nude mice (n=4). Tumor volumes were measured. c-d, Clonogenic assay (c) and subcutaneous tumor growth in nude mice (n=5) for two independent clones of iKras p53L/+ PDAC cells with Double Nickase-mediated Sdc1 deletion. e, Quantification of representative clonogenic assay of HPAFII, ASPC1, or PATC69 (PDX) infected with SDC1-targeting or SCR shRNA. f, Subcutaneous tumor growth in nude mice injected with PATC69 harboring SDC1-targeting (n=5) or SCR shRNA (n=4). g, Kaplan–Meier survival analysis for mice of indicated genotypes. Cohort size is indicated. P-value was calculated with Log-rank (Mantel-Cox) test (conservative). h-i, Gross image, HE staining, IHC staining (Sdc1 and Ki67) (h) and pathological features as well as metastasis frequencies (i) from pancreatic tumors of indicated genotypes (scale bar: 200 μm). Experiments in (h) were repeated ≥2 times independently with similar results. a, c, e: Experiments were repeated at least twice with similar results; mean + s.d. was plotted; b, d, f: data are mean + s.d.; P-values were determined by unpaired two-sided Student’s t-test.
Figure 3.
Figure 3.. KRAS* induces SDC1 membrane recycling through MAPK-PSD4-ARF6 axis.
a-d, iKras p53L/+ PDAC cells were grown in presence (ON) or absence (OFF) of doxycycline for 48 hours or indicated times. REON: cells were grown in absence of doxycycline for 48 hours followed by doxycycline treatment for 24 hours. Treatment of ON or REON samples with trametinib (50 nM), AZD8330 (100 nM), or BKM120 (100 nM) for 16-18 hours is indicated. (a) Surface Sdc1 was measured via FACS. (b) Cells were detached with trypsin to remove Sdc1 ectodomain and re-suspended in culture medium. (Top) Surface Sdc1 was labeled with anti-Sdc1 antibody at indicated times following re-suspension and measured via FACS. (Bottom) Mean Sdc1 levels. (c) Cells grown in presence (ON) or absence (OFF) of doxycycline for 48 hours were subjected to IF staining for Sdc1 (red), Arf6 (green) and DAPI (blue) (scale bar: 20 μm). (d) Cell lysates were immunoblotted for Psd4, phosphor-Akt, phosphor-Erk, Kras and ß-Actin. a-d: Data are representative of two independent experiments with similar results.
Figure 4.
Figure 4.. SDC1 is critical for macropinocytosis in KRAS*-driven PDAC cells.
a-b, Macropinocytosis was visualized with TMR-dextran (scale bar: 20 μm) (a) and quantified (b) (n=5 random areas) in iKras* p53L/+ tumor cells infected with Sdc1-targeting or scrambled (Scr) shRNA. EIPA (50 μM) treatment served as positive control. Data are representative of three independent experiments with similar results. c, iKras p53L/+ tumor cells stably expressing SDC1 or empty vector were grown in the presence (ON) or absence (OFF) of doxycycline for 48 hours. Macropinocytosis index was visualized with TMR-dextran and quantified (n=5 random areas). d, Rac1 activity was measured by G-LISA activation assay in iKras* p53L/+ PDAC cells infected with Sdc1-targeting or scrambled (Scr) shRNA (n=4 biological replicates). e, iKras* p53L/+ PDAC cells were infected with Sdc1-targeting or scrambled (Scr) shRNA and grown in medium containing 0.2 or 0.5 mM glutamine, in the presence or absence of albumin. Cell proliferation was monitored for 10 days; data presented as relative percentage of remaining cells (n=3 biological replicates). f, Proposed mechanism of KRAS-MAPK-PSD4-ARF6 driven recycling pathway to mediate SDC1 membrane localization and macropinocytosis in KRAS*-dependent PDAC cells. b-e. Data are mean + s.d.; P-values were determined by unpaired two-sided Student’s t-test.

References

    1. Siegel RL, Miller KD & Jemal A Cancer Statistics, 2017. CA Cancer J Clin 67, 7–30, doi:10.3322/caac.21387 (2017). - DOI - PubMed
    1. Mann KM, Ying H, Juan J, Jenkins NA & Copeland NG KRAS-related proteins in pancreatic cancer. Pharmacol Ther 168, 29–42, doi:10.1016/j.pharmthera.2016.09.003 (2016). - DOI - PubMed
    1. Pettazzoni P et al. Genetic events that limit the efficacy of MEK and RTK inhibitor therapies in a mouse model of KRAS-driven pancreatic cancer. Cancer Res 75, 1091–1101, doi:10.1158/0008-5472.CAN-14-1854 (2015). - DOI - PMC - PubMed
    1. Shimizu T et al. The clinical effect of the dual-targeting strategy involving PI3K/AKT/mTOR and RAS/MEK/ERK pathways in patients with advanced cancer. Clin Cancer Res 18, 2316–2325, doi:10.1158/1078-0432.CCR-11-2381 (2012). - DOI - PubMed
    1. Kapoor A et al. Yap1 activation enables bypass of oncogenic Kras addiction in pancreatic cancer. Cell 158, 185–197, doi:10.1016/j.cell.2014.06.003 (2014). - DOI - PMC - PubMed

MeSH terms