. 2019 Apr;568(7752):391-394.
doi: 10.1038/s41586-019-1050-5. Epub 2019 Mar 27.

Mapping changes in housing in sub-Saharan Africa from 2000 to 2015

Affiliations

Mapping changes in housing in sub-Saharan Africa from 2000 to 2015

Lucy S Tusting et al. Nature. 2019 Apr.

Abstract

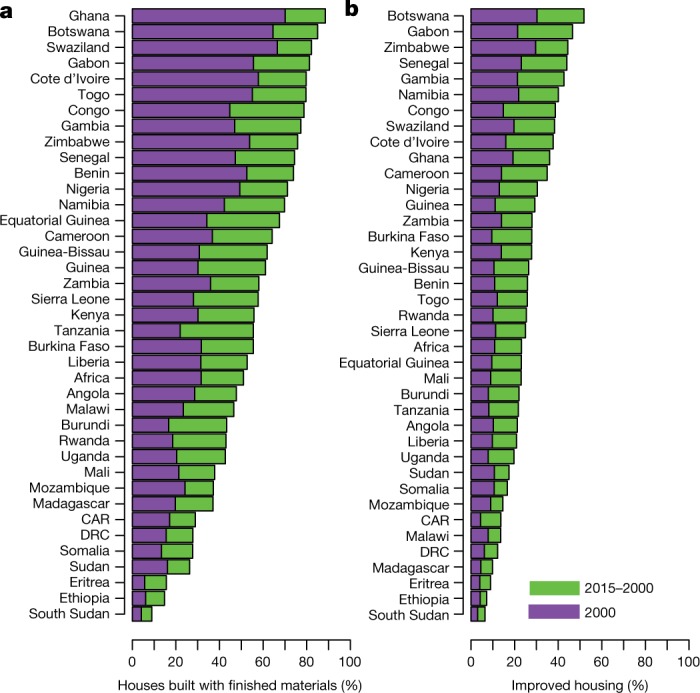
Access to adequate housing is a fundamental human right, essential to human security, nutrition and health, and a core objective of the United Nations Sustainable Development Goals1,2. Globally, the housing need is most acute in Africa, where the population will more than double by 2050. However, existing data on housing quality across Africa are limited primarily to urban areas and are mostly recorded at the national level. Here we quantify changes in housing in sub-Saharan Africa from 2000 to 2015 by combining national survey data within a geostatistical framework. We show a marked transformation of housing in urban and rural sub-Saharan Africa between 2000 and 2015, with the prevalence of improved housing (with improved water and sanitation, sufficient living area and durable construction) doubling from 11% (95% confidence interval, 10-12%) to 23% (21-25%). However, 53 (50-57) million urban Africans (47% (44-50%) of the urban population analysed) were living in unimproved housing in 2015. We provide high-resolution, standardized estimates of housing conditions across sub-Saharan Africa. Our maps provide a baseline for measuring change and a mechanism to guide interventions during the era of the Sustainable Development Goals.


Conflict of interest statement

The authors declare no competing interests.

Figures

Fig. 1
Fig. 1. Changes in housing in sub-Saharan Africa between 2000 and 2015.
a, Prevalence of improved housing across sub-Saharan Africa in 2000 predicted at 5 × 5-km2 resolution. b, Prevalence of improved housing in 2015 predicted at 5 × 5-km2 resolution. c, Absolute difference in the prevalence of improved housing in 2000 and 2015. d, Prevalence of houses built with finished materials in 2000 predicted at 5 × 5-km2 resolution. e, Prevalence of houses built with finished materials in 2015 predicted at 5 × 5-km2 resolution. f, Absolute difference in prevalence of houses built with finished materials in 2000 and 2015. g, Increase in prevalence of improved housing (red line; shading, 95% confidence intervals) and housing built with finished materials (blue line) from 2000 to 2015. Results are derived from a geospatial model fitted to 62 surveys that represent 661,945 households (house construction materials) and 59 surveys that represent 629,298 households (house type). Houses were classified as improved if they had all of the following characteristics: improved water supply, improved sanitation, three or fewer people per bedroom and house made of finished materials (Extended Data Table 1 and Supplementary Methods). Maps were produced using the raster package (version 2.6-7) in R. The images were plotted using the rasterVis package (version 3.4).
Fig. 2
Fig. 2. National-level changes in housing between 2000 and 2015.
a, b, Plots show predicted population-weighted mean prevalence of houses built with finished materials (a) and improved housing (b). Bars represent each country in 2000 (purple) and 2015 (purple and green combined). Houses were classified as improved if they had all of the following characteristics: improved water supply, improved sanitation, three or fewer people per bedroom and house made of finished materials (Extended Data Table 1 and Supplementary Methods). CAR, Central African Republic; Congo, Republic of the Congo; DRC, Democratic Republic of the Congo.
Fig. 3
Fig. 3. Association between house type, education and household wealth.
a, Association between house type and education level. The pooled increase in odds of living in an improved house when the household head reported having completed more than primary education, compared to having primary education or less, is shown by the diamond and dashed red vertical line. The solid blue vertical line represents the null value (no difference between groups). Odds ratios (OR) are adjusted for wealth index, age of the household head and geographical cluster. Error bars show 95% confidence intervals. b, Association between house type and household wealth. The pooled increase in odds of living in an improved house among households in the upper 75% wealth quartile compared to all other households is shown. Odds ratios are adjusted for education level, age of the household head and geographical cluster. Data are from 48 Demographic and Health Surveys, two Malaria Indicator Surveys and one AIDS Indicator Survey, conducted between 1996 and 2015 (Supplementary Table 2).
Extended Data Fig. 1
Extended Data Fig. 1. Availability of national survey data for the period 1990–2016 for the variables that are required to determine house construction materials and house type in sub-Saharan Africa.
a, Availability of surveys for the determination of house construction materials. b, Availability of surveys for the determination of house type. Maps were produced using ArcGIS.
Extended Data Fig. 2
Extended Data Fig. 2. The continuous ranked probability scores for the models of house type and house construction material.
Continuous ranked probability scores (CRPS) are shown for the house type model (left; mean = 0.11) and the house construction material model (right; mean = 0.08). Both distributions indicate well-calibrated confidence intervals with clustering towards zero; that is, a low error with regards to the distribution of the prediction.
Extended Data Fig. 3
Extended Data Fig. 3. Prevalence of main roof, wall and floor material of houses in sub-Saharan Africa in 2000 and 2015.
a, Prevalence of houses built with finished (versus natural or unfinished) roof material in 2000 predicted at 5 × 5-km2 resolution. b, Prevalence of houses built with finished (versus natural or unfinished) roof material in 2015 predicted at 5 × 5-km2 resolution. c, Prevalence of houses built with finished (versus natural or unfinished) wall material in 2000 predicted at 5 × 5-km2 resolution. d, Prevalence of houses built with finished (versus natural or unfinished) wall material in 2015 predicted at 5 × 5-km2 resolution. e, Prevalence of houses built with finished (versus natural or unfinished) floor material in 2000 predicted at 5 × 5-km2 resolution. f, Prevalence of houses built with finished (versus natural or unfinished) floor material in 2015 predicted at 5 × 5-km2 resolution. Results are derived from a geospatial model fitted to 66 surveys for roof material, 96 surveys for floor material and 62 surveys for wall material. Maps were produced using the raster package (v.2.6-7) in R. The images were plotted using the rasterVis package (v.3.4).
Extended Data Fig. 4
Extended Data Fig. 4. Association between house type and age of the household head.
The pooled increase in odds of living in an improved house when the age of the household head is over 55 years, compared to 55 years or less, is shown to the right of the vertical line representing the null value (no difference between groups). Odds ratios are adjusted for wealth index, education level of the household head and geographical cluster. Error bars show 95% confidence intervals. Data are from 48 DHS, 2 MIS and 1 AIS conducted between 1996 and 2015 (Supplementary Table 2).
Extended Data Fig. 5
Extended Data Fig. 5. Prevalence of improved housing in rural and urban survey clusters.
Data are from 59 national household surveys from 31 countries in sub-Saharan Africa conducted between 1994 and 2015.
Extended Data Fig. 6
Extended Data Fig. 6. Prevalence of house types in relation to survey-level prevalence of urban clusters.
Left, house construction materials (adjusted R2 = 0.46, P < 0.001). Right, house type (adjusted R2 = 0.35, P < 0.001). Points represent each national survey included in the analysis.
Extended Data Fig. 7
Extended Data Fig. 7. Changes in housing in sub-Saharan Africa from 2000 to 2015 relative to the 2000 baseline.
Points represent countries stratified by urban (blue) and rural (red) areas.
Extended Data Fig. 8
Extended Data Fig. 8. Number of households per survey that lack the characteristics of improved houses.
Characteristics shown are improved water source (blue), improved sanitation facilities (red), sufficient living area (purple) and finished house construction materials (brown). Data are from 1 AIS, 15 MIS and 53 DHS that had data on all four of these variables, conducted between 1993 and 2015. Out of a total of 69 surveys, households most frequently lacked improved sanitation facilities (52 surveys; 75%) and finished materials (16 surveys; 23%).
Extended Data Fig. 9
Extended Data Fig. 9. Observed versus predicted prevalence of improved housing aggregated to district level (administrative division 1 level).
Fit predictions for both observed and predicted prevalence were aggregated to the district level and plotted.

References

    1. United Nations. Progress towards the Sustainable Development Goals. Report of the Secretary-General. (UN Economic and Social Council, 2016).
    1. United Nations. New Urban Agenda. In The United Nations Conference on Housing and Sustainable Urban Development Habitat III. (United Nations, 2016).
    1. United Nations. Indicators for Monitoring the Millennium Development Goals: 7.10 Proportion of Urban Population Living in Slums. (United Nations, 2012).
    1. United Nations. World Population Prospects, 2015 Revision. (United Nations Department of Economic and Social Affairs, 2015).
    1. Rek JC, et al. Rapid improvements to rural Ugandan housing and their association with malaria from intense to reduced transmission: a cohort study. Lancet Planet. Health. 2018;2:e83–e94. doi: 10.1016/S2542-5196(18)30010-X. - DOI - PMC - PubMed

MeSH terms

LinkOut - more resources