. 2019 Apr;568(7750):98-102.
doi: 10.1038/s41586-019-1066-x. Epub 2019 Mar 27.

A gut-to-brain signal of fluid osmolarity controls thirst satiation

Affiliations

A gut-to-brain signal of fluid osmolarity controls thirst satiation

Christopher A Zimmerman et al. Nature. 2019 Apr.

Abstract

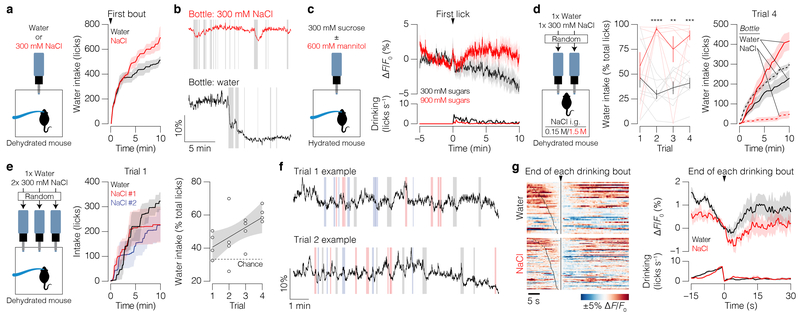
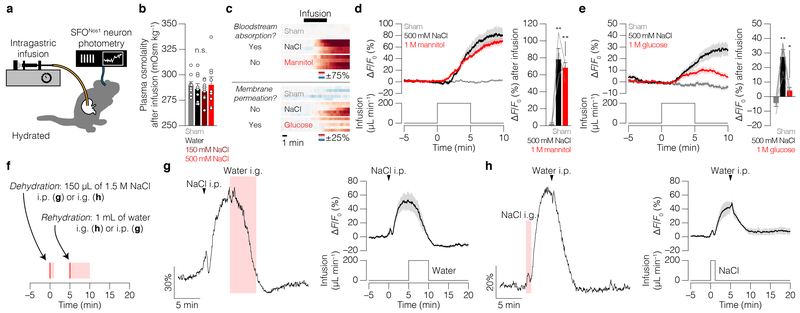
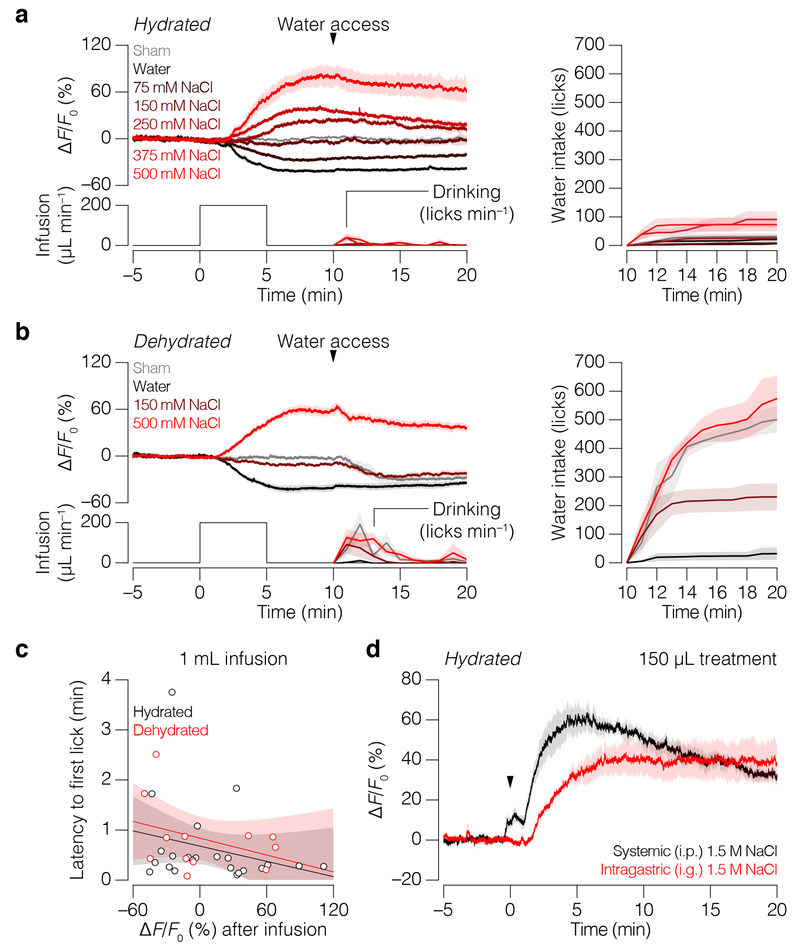
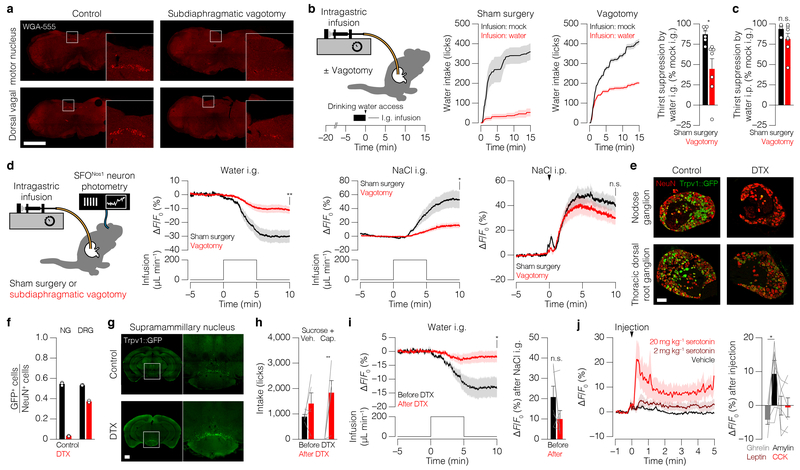
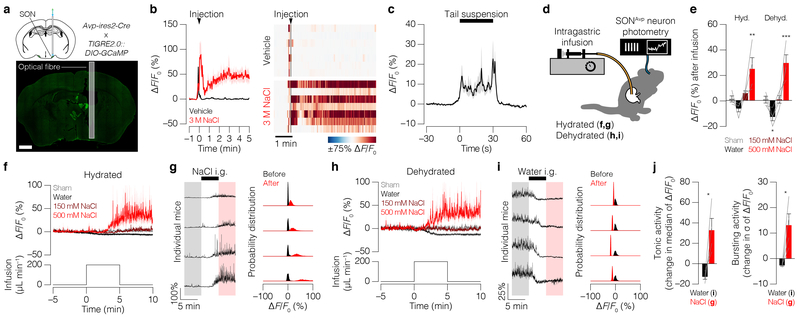
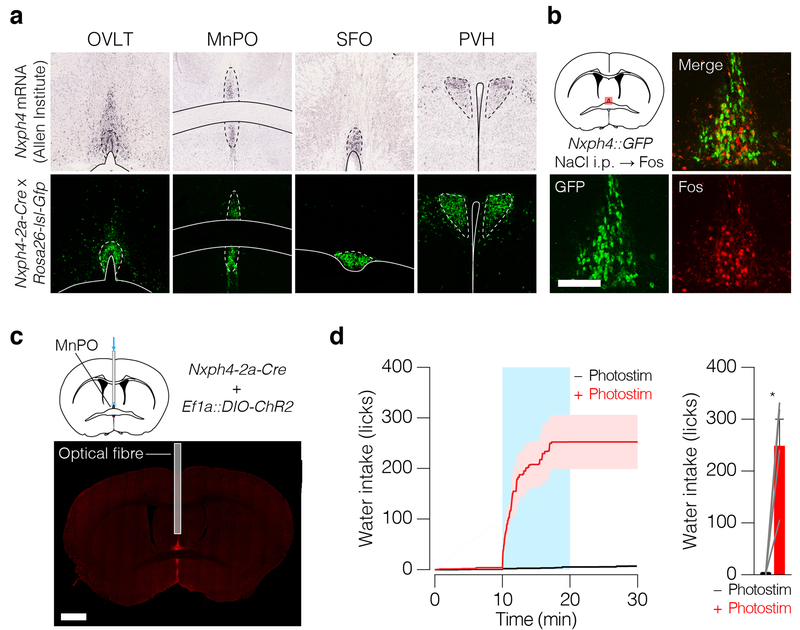
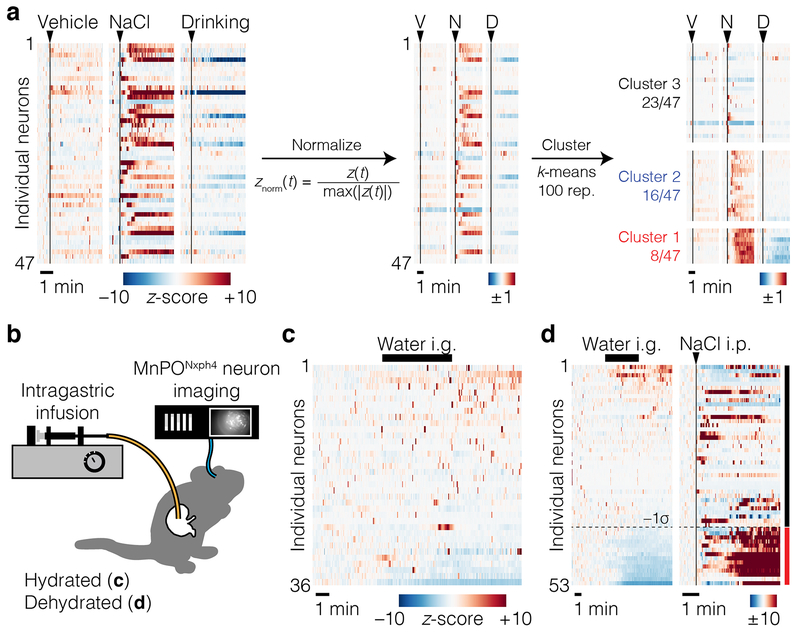
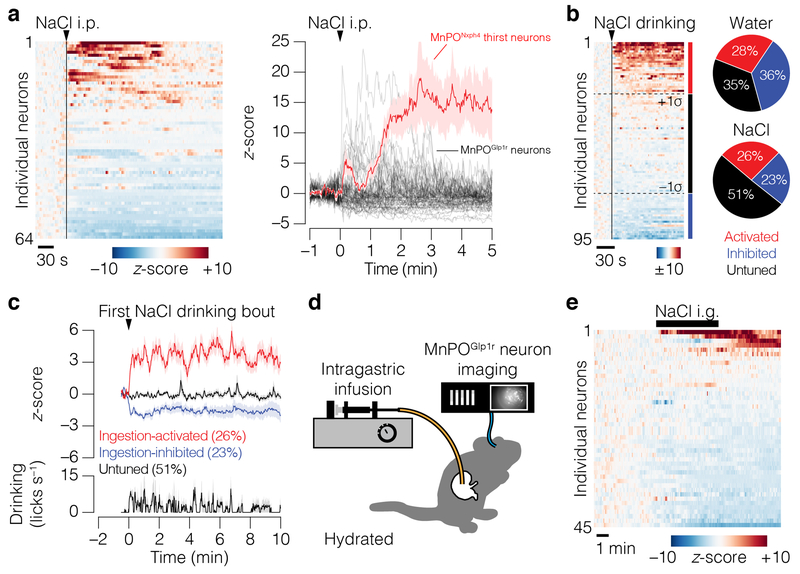
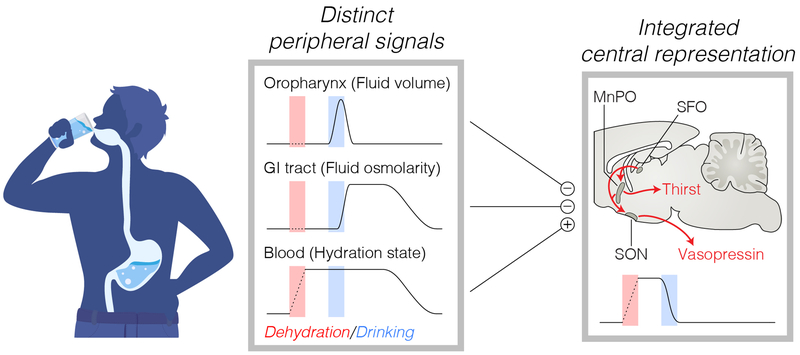
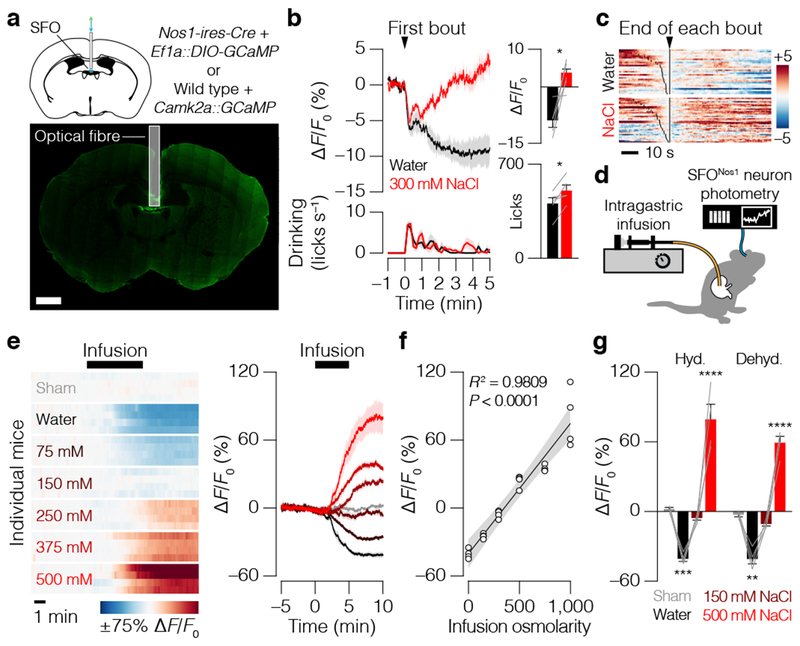
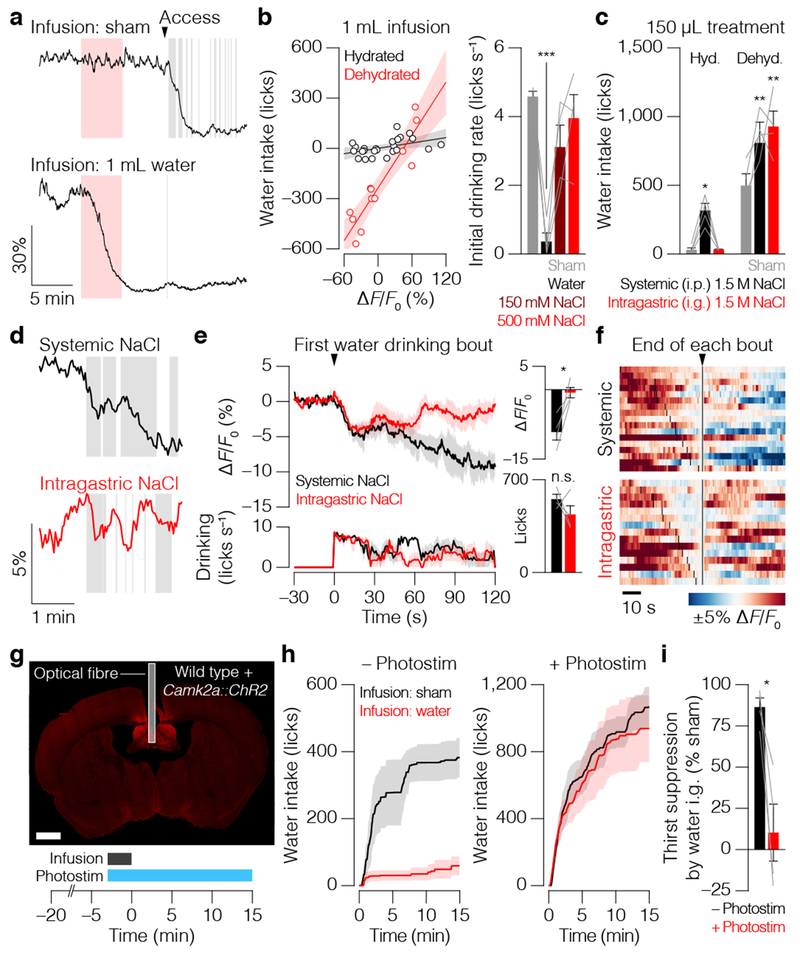
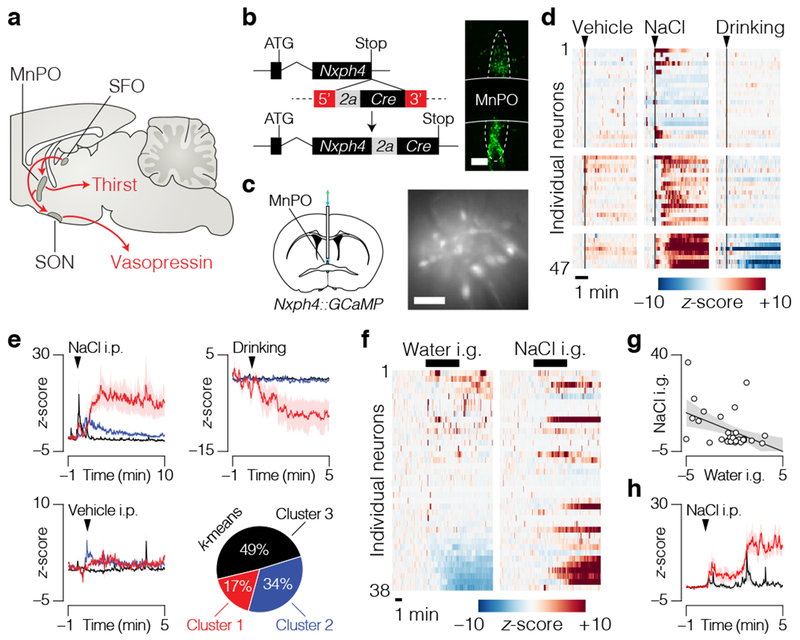
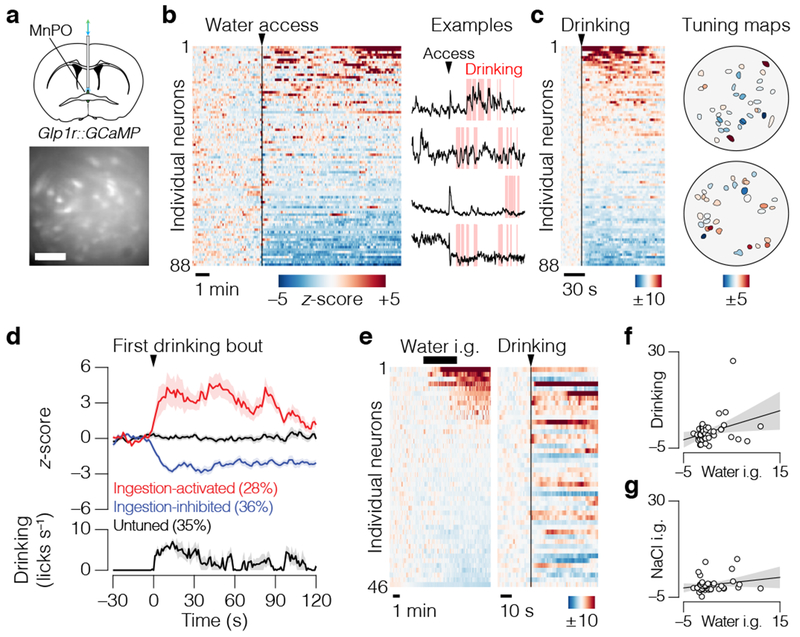
Satiation is the process by which eating and drinking reduce appetite. For thirst, oropharyngeal cues have a critical role in driving satiation by reporting to the brain the volume of fluid that has been ingested1-12. By contrast, the mechanisms that relay the osmolarity of ingested fluids remain poorly understood. Here we show that the water and salt content of the gastrointestinal tract are precisely measured and then rapidly communicated to the brain to control drinking behaviour in mice. We demonstrate that this osmosensory signal is necessary and sufficient for satiation during normal drinking, involves the vagus nerve and is transmitted to key forebrain neurons that control thirst and vasopressin secretion. Using microendoscopic imaging, we show that individual neurons compute homeostatic need by integrating this gastrointestinal osmosensory information with oropharyngeal and blood-borne signals. These findings reveal how the fluid homeostasis system monitors the osmolarity of ingested fluids to dynamically control drinking behaviour.


Conflict of interest statement

The authors declare no competing interests.

Figures

Extended Data Figure 1.
Extended Data Figure 1.. GI osmolarity influences drinking behavior and biases salt preference.
Panels a,b present additional data related to Fig. 1b,c. a, Cumulative water or 300 mM NaCl intake after dehydration (n = 5 mice). b, Example SFO neuron dynamics during drinking after dehydration. Panel c shows that ingestion of hypertonic fluids activates SFO neurons regardless of hydration state. c, Average SFO activity and drinking behavior of hydrated mice given ad libitum access to isotonic (300 mM sucrose) or hypertonic (300 mM sucrose + 600 mM mannitol) sugar solutions of similar sweetness (n = 5 mice). Panel d shows that increases in GI osmolarity bias salt/water preference. d, Preference in a two-bottle test after i.g. treatment with hypertonic (red; n = 8 mice) or isotonic (black; n = 9 mice) NaCl (left; two-way ANOVA, Holm-Šídák correction). Cumulative water (solid lines) and 300 mM NaCl (dashed lines) intakes in the same two-bottle test (right). Panels e–g show that post-ingestive SFO neuron activity does not reflect the delayed consequences of taste or sensorimotor experience associated with an individual drinking bout. e, Mice initially do not distinguish between bottles containing water or 300 mM NaCl in a three-bottle test after dehydration (n = 4 mice, linear regression, R = 0.3163, P = 0.0233). f, Example SFO neuron dynamics during drinking from water (black) and 300 mM NaCl (blue, red) bottles after dehydration. g, SFO neuron dynamics during individual water (42 bouts) or NaCl (71 bouts) drinking bouts in trials 1 and 2 of the three-bottle test (left). Average SFO activity after individual drinking bouts (right; n = 4 mice). In this experiment (panels e–g), GI osmolarity quickly becomes hypertonic as the dehydrated mice alternate between drinking from water and NaCl bottles such that SFO neuron activity “rebounds” even after water drinking bouts, which suggests that the stabilization signal that either quenches or re-activates SFO neurons after ingestion reflects GI osmolarity. Error bars represent mean ± s.e.m. Shaded areas in a,c,d,e,g represent mean ± s.e.m.; in b represent individual licks; in the linear regression (right) in e represent 95% confidence interval of the line-of-best-fit; in f represent individual drinking bouts. **P < 0.01, ***P < 0.001.
Extended Data Figure 2.
Extended Data Figure 2.. The GI→SFO osmosensory signal depends on fluid tonicity but not osmolyte identity.
Panels a,b show that i.g. infusion does not rapidly alter the state of the blood. a, Schematic. b, Plasma osmolality of samples collected during approximately 3–6 min after the start of the 5-min i.g. infusion (n = 9 mice per group, one-way ANOVA, Holm-Šídák correction). Panels c–e show that the GI→SFO osmosensory signal depends on fluid tonicity but not osmolyte identity. c, SFO neuron dynamics of individual mice in response to i.g. infusion of equiosmotic concentrations of NaCl, which is absorbed into the bloodstream from the GI tract, and mannitol, which is not absorbed (top; n = 4 mice). SFO neuron dynamics of a separate cohort of individual mice in response to i.g. infusion of equiosmotic concentrations of NaCl, which does not permeate cell membranes and has high tonicity, and glucose, which does permeate cell membranes and has low tonicity (bottom; n = 5 mice). d, Average SFO activity during i.g. infusion of NaCl or mannitol (left). Quantification (right; n = 4 mice, one-way ANOVA, Holm-Šídák correction). e, Average SFO activity during i.g. infusion of NaCl or glucose (left). Quantification (right; n = 5 mice, one-way ANOVA, Holm-Šídák correction). Panels f–h show that SFO neurons encode systemic and GI osmosensory signals additively rather than hierarchically. f, Schematic. g, Example (left) and average (right; n = 4 mice) SFO neuron dynamics during 1.5 M NaCl i.p. injection followed by water i.g. infusion. h, Example (left) and average (right; n = 3 mice) SFO neuron dynamics during 1.5 M NaCl i.g. infusion followed by water i.p. injection. Error bars represent mean ± s.e.m. Shaded areas in summary traces (d,e,g,h) represent mean ± s.e.m. and in example traces (g,h) represent i.g. infusion. *P < 0.05, **P < 0.01; n.s., not significant.
Extended Data Figure 3.
Extended Data Figure 3.. The GI→SFO osmosensory signal completely satiates but only mildly stimulates thirst.
Panels a,b present additional data related to Fig. 1e–g and Fig. 2a,b. a, Average SFO activity during i.g. infusions and subsequent drinking while hydrated (left). Cumulative water intake (right; n = 4 mice). b, Average SFO activity during i.g. infusions and subsequent drinking after dehydration (left). Cumulative water intake (right; n = 4 mice). c, Correlation between SFO activity change and latency to drinking after 1 mL infusions into hydrated (black; n = 23 experiments from 4 mice, linear regression, R = 0.0705, P = 0.2208) or dehydrated (red; n = 12 experiments from 4 mice, linear regression, R = 0.1321, P = 0.2456) mice. Panel d presents additional data related to Fig. 2c. d, Average SFO activity after systemic (i.p.) or i.g. treatment with 150 μL NaCl while hydrated. Shaded areas in a,b,d represent mean ± s.e.m. and in c represent 95% confidence interval of the line-of-best-fit.
Extended Data Figure 4.
Extended Data Figure 4.. The GI→SFO osmosensory signal involves the vagus nerve.
Panels a–d show that the GI→SFO osmosensory signal is disrupted by subdiaphragmatic vagotomy. a, Vagal motor neuron somas (located in the brainstem and labeled by i.p. injection of wheat germ agglutinin, WGA-555) were largely absent following subdiaphragmatic vagotomy (two examples per condition; scale bar, 1 mm). b, Drinking after dehydration was less suppressed by i.g. infusion of water in vagotomized mice (middle; n = 7 mice) compared to sham mice (left; n = 6 mice). Quantification (right; two-tailed Student’s t-test). c, Drinking was similarly suppressed in both groups by systemic (i.p.) delivery of water (n = 4 sham and 7 vagotomy, two-tailed Student’s t-test). d, SFO modulation by water and 500 mM NaCl i.g. infusions, but not by 1.5 M NaCl i.p. injection, was attenuated in vagotomized mice compared to sham mice (n = 8 mice per group, two-tailed Student’s t-tests). Panels e–i show that the GI→SFO osmosensory signal involves Trpv1+ sensory neurons. e, To specifically ablate Trpv1+ sensory neurons, we treated mice containing a BAC transgene expressing GFP and the diphtheria toxin (DTX) receptor from the Trpv1 gene start codon (Trpv1-Gfp-2a-Dtr mice) with DTX (scale bar, 100 μm). f, Quantification (n = 3 control and 2 DTX; NG, nodose ganglion; DRG, dorsal root ganglion). g, DTX treatment did not ablate Trpv1+ neurons in the brain (scale bar, 1 mm). h, Hydrated mice avoided drinking 300 mM sucrose that contained 100 μM capsaicin (Cap.) before, but not after, DTX ablation of Trpv1+ sensory neurons (n = 5 mice, two-way ANOVA, Holm-Šídák correction; Veh., vehicle). i, SFO modulation by water i.g. was significantly attenuated after DTX ablation of Trpv1+ sensory neurons, and modulation by 500 mM NaCl i.g. was slightly attenuated (n = 7 mice, two-tailed Student’s t-tests). Panel j shows the response of SFO neurons to serotonin and other visceral hormones. j, SFO neuron dynamics during injection of two doses of serotonin (left; n = 5 mice) and to a single dose (2 mg kg−1) of amylin, cholecystokinin (CCK), ghrelin, or leptin (right; n = 6 mice, one-way ANOVA, Holm-Šídák correction) in hydrated mice. Error bars and shaded areas represent mean ± s.e.m. *P < 0.05, **P < 0.01; n.s., not significant.
Extended Data Figure 5.
Extended Data Figure 5.. Vasopressin neurons integrate systemic and GI osmosensory signals and are stress-responsive.
Panels a,b present additional data related to Fig. 3a,b. a, Schematic for fiber photometry recording of vasopressin neurons (scale bar, 1 mm). b, Vasopressin neuron dynamics (average, left; individual mice, right) during vehicle or NaCl i.p. injection (n = 7 mice). Panel c shows that vasopressin neurons are stress-responsive. c, Vasopressin neuron activity during tail suspension (n = 7 mice). Panels d–j present additional data related to Fig. 3d. d, Schematic. e, Vasopressin neuron activity change after infusion while hydrated or dehydrated (n = 4 mice, two-way ANOVA, Holm-Šídák correction; Hyd., hydrated; Dehyd., dehydrated). f, Vasopressin neuron activity during i.g. infusions while hydrated (n = 4 mice). g, Vasopressin neuron dynamics of individual mice (left) and distribution of ΔF/F0 values before and after 500 mM NaCl i.g. infusion for those mice (right). h, Vasopressin neuron dynamics during i.g. infusions after dehydration (n = 4 mice). i, Vasopressin neuron activity of individual mice (left) and distribution of ΔF/F0 values before and after water i.g. infusion for those mice (right). j, GI osmolarity modulates both the median of ΔF/F0 (left; used here as a proxy for tonic activity) and the standard deviation (σ) of ΔF/F0 (right; used here as a proxy for bursting activity) of vasopressin neurons (n = 4 mice, two-tailed Student’s t-tests). Error bars represent mean ± s.e.m. Shaded areas in b,c,f,h represent mean ± s.e.m and in g,i represent “before” and “after” infusion periods. *P < 0.05, **P < 0.01, ***P < 0.001.
Extended Data Figure 6.
Extended Data Figure 6.. Nxph4-expressing MnPO neurons are activated by dehydration and drive thirst.
Panel a presents additional data related to Fig. 4b. a, The Nxph4–2a-Cre recombination pattern (bottom; crossed to a GFP reporter line) recapitulates the endogenous Nxph4 mRNA expression pattern (top; Allen Institute for Brain Science ISH #73521000) in the organum vasculosum of the lamina terminalis (OVLT), MnPO, SFO, and paraventricular hypothalamus (PVH). Panel b shows that MnPONxph4 neurons are activated by dehydration. b, Nxph4-2a-Cre recombination (green; crossed to a GFP reporter line) and the immediate early gene Fos (red; induced by 3 M NaCl i.p. injection) co-localize in the MnPO during dehydration (scale bar, 100 μm). Panels c,d show that MnPONxph4 neurons drive thirst. c, Schematic for optogenetic activation of MnPONxph4 neurons (scale bar, 1 mm). d, Water intake in response to photostimulation (left). Quantification (right; n = 4 mice, two-tailed Student’s t-test). Error bars and shaded areas represent mean ± s.e.m. *P < 0.05.
Extended Data Figure 7.
Extended Data Figure 7.. In vivo imaging of individual glutamatergic MnPO neurons during thirst, drinking, and GI manipulation.
Panel a presents additional data related to Fig. 4d,e. a, Workflow for k-means clustering of individual MnPONxph4 neurons based on their activity during vehicle i.p. injection, 3 M NaCl i.p. injection, and water drinking. Panels b–d present additional data related to Fig. 4f–h. b, Schematic. c, Dynamics of individual neurons during water i.g. infusion while hydrated. d, Dynamics of individual neurons tracked during water i.g. infusion after dehydration (left) and 3 M NaCl i.p. injection (right). Neurons inhibited ≥1σ after water i.g. infusion were classified as “GI-tuned” (red; 26%) and the remaining neurons were classified as “GI-untuned” (black; 74%) for the time-course plotted in Fig. 4h.
Extended Data Figure 8.
Extended Data Figure 8.. Glutamatergic MnPO neurons relay the GI osmosensory signal to vasopressin neurons.
Panels a–d show that glutamatergic MnPO neurons are necessary for relaying GI osmosensory information to SON vasopressin neurons. a, Schematic for simultaneous fiber photometry recording of vasopressin neurons and chemogenetic inhibition of glutamatergic MnPO neurons (scale bar, 100 μm). b, Injection of clozapine N-oxide (CNO) inhibited water intake after dehydration (n = 5 mice). c, Example vasopressin neuron dynamics during CNO or vehicle i.p. injection (left) and subsequent 1.5 M NaCl i.g. by oral gavage (right). Inset, water intake after dehydration for this example mouse. d, Quantification of vasopressin neuron response to i.p. injection (left) and NaCl i.g. (right; n = 5 mice, two-tailed Student’s t-tests). Panels e–h show that glutamatergic MnPO neurons are not necessary for relaying GI osmosensory information to SFO thirst neurons. e, Schematic for simultaneous fiber photometry recording of SFO neurons and chemogenetic inhibition of glutamatergic MnPO neurons (scale bar, 100 μm). f, Injection of CNO inhibited water intake after dehydration (n = 5 mice). g, Example SFO neuron dynamics during 1.5 M NaCl i.g. by oral gavage after CNO or vehicle i.p. injection. Inset, water intake after dehydration for this example mouse. h, Quantification of SFO neuron response to i.p. injection (left) and NaCl i.g. (right; n = 5 mice, two-tailed Student’s t-tests). Panel i shows that CNO inhibits drinking in mice expressing hM4D(Gi) in glutamatergic MnPO neurons but not in control mice lacking hM4D(Gi). i, Injection of CNO significantly inhibited water intake after dehydration in MnPOCamk2a::hM4D(Gi) + SON photometry mice (n = 5 mice; quantified from panel b) and MnPONos1::hM4D(Gi) + SFO photometry mice (n = 5 mice; quantified from panel f) but not in control mice (n = 6 mice, two-way ANOVA, Holm-Šídák correction). Error bars and shaded areas represent mean ± s.e.m. *P < 0.05, **P < 0.01; n.s., not significant.
Extended Data Figure 9.
Extended Data Figure 9.. In vivo imaging of individual GABAergic MnPO neurons during thirst, drinking, and GI manipulation.
Panel a shows that individual GABAergic MnPO neurons do not encode systemic osmolarity in their baseline activity. a, Dynamics of individual neurons during 3 M NaCl i.p. injection while hydrated (left). Comparison to thirst-activated MnPONxph4 neurons (right; “cluster 1” from Fig. 4e). Panels b,c show the dynamics of ingestion-tuned GABAergic MnPO neurons during hypertonic NaCl drinking. b, Dynamics of individual neurons during 300 mM NaCl drinking after dehydration (left). Proportion of ingestion-activated (red; modulated ≥1σ during first min of drinking), ingestion-inhibited (blue; modulated ≤–1σ), and untuned (black) neurons during water (top; n = 77 neurons from Fig. 5c,d) or 300 mM NaCl (bottom; n = 95 neurons) drinking (right). c, Average responses of ingestion-activated, ingestion-inhibited, and untuned neurons during 300 mM NaCl drinking (n = 95 neurons). Note that ingestion of NaCl persists for much longer than ingestion of water after dehydration (see Fig. 5d and Extended Data Fig. 1a), which may explain differences in the dynamics of ingestion-tuned GABAergic MnPO neurons when mice drink these fluids. Panels d,e present additional data related to Fig. 5e–g. d, Schematic. e, Dynamics of individual neurons during 500 mM NaCl i.g. infusion while hydrated.
Extended Data Figure 10.
Extended Data Figure 10.. Schematic for the neural control of thirst and satiation.
Anatomically and temporally distinct peripheral sensory signals encode information about the body’s current hydration state (blood) as well as the volume (oropharynx) and osmolarity (GI tract) of recently ingested fluids. These signals converge on the brain’s thirst circuit to generate an integrated central representation of fluid balance at the level of individual neurons, which use this information to dynamically control drinking behavior and vasopressin secretion in real-time. Illustration from iStock/artsholic.
Figure 1.
Figure 1.. GI osmolarity modulates drinking behavior and SFO thirst neuron activity.
a, Schematic for fiber photometry recording of SFO neurons (scale bar, 1 mm). b, Average SFO activity and drinking behavior after dehydration (left). Quantification (right; n = 5 mice, two-tailed Student’s t-tests). c, SFO neuron dynamics during individual water (29 bouts) or NaCl (37 bouts) drinking bouts. d, Schematic for i.g. infusion during fiber photometry recording. e, SFO neuron dynamics of individual mice during infusions of water or NaCl while hydrated (left). Average SFO activity during infusions (right; n = 4 mice). f, Correlation between infusion osmolarity (mOsm L−1) and SFO activity change (n = 4 mice, linear regression). g, SFO activity change after infusion while hydrated or dehydrated (n = 4 mice, two-way ANOVA, Holm-Šídák correction; Hyd., hydrated; Dehyd., dehydrated). Error bars represent mean ± s.e.m. Shaded areas in b,e represent mean ± s.e.m. and in f represent 95% confidence interval of the line-of-best-fit. *P < 0.05, **P < 0.01, ***P < 0.001, ****P < 0.0001.
Figure 2.
Figure 2.. The GI→SFO osmosensory signal controls thirst satiation.
a, Example SFO neuron dynamics during i.g. infusion after dehydration. b, Correlation between SFO activity change and water intake (relative to sham infusion) after 1 mL infusions into hydrated (black; n = 24 experiments from 4 mice, linear regression, R = 0.2084, P = 0.0249) or dehydrated (red; n = 12 experiments from 4 mice, linear regression, R = 0.8493, P < 0.0001) mice (left). Initial drinking rate of dehydrated mice after infusion (right; n = 4 mice, one-way ANOVA, Holm-Šídák correction). c, Water intake after systemic (i.p.) or i.g. treatment with 150 μL NaCl (right; n = 4 mice, one-way ANOVA, Holm-Šídák correction; Hyd., hydrated; Dehyd., dehydrated). d, Example SFO neuron dynamics during water drinking after 150 μL NaCl treatment into dehydrated mice. e, Average SFO activity and drinking behavior after 150 μL NaCl treatment into dehydrated mice (left). Quantification (right; n = 4 mice, two-tailed Student’s t-tests). f, SFO neuron dynamics during individual water drinking bouts after systemic (17 bouts) or i.g. (15 bouts) 150 μL NaCl treatment. g, Schematic for i.g. infusion during optogenetic activation (scale bar, 1 mm). h, Dehydration-induced drinking after i.g. infusion either with (right) or without (left) simultaneous photostimulation of SFO neurons (n = 4 mice). i, Quantification (n = 4 mice, two-tailed Student’s t-test). Error bars represent mean ± s.e.m. Shaded areas in a,d represent i.g. infusion (red) or individual licks (gray); in b represent 95% confidence interval of the line-of-best-fit; in e,h represent mean ± s.e.m. *P < 0.05, **P < 0.01, ***P < 0.001; n.s., not significant.
Figure 3.
Figure 3.. Vasopressin neurons bidirectionally encode GI osmolarity.
a, Schematic for fiber photometry recording of SON vasopressin neurons (scale bar, 1 mm). b, Vasopressin neuron response to vehicle or 3 M NaCl i.p. injection (n = 7 mice; two-tailed Student’s t-test) c, Average vasopressin neuron activity and drinking behavior after dehydration (n = 5 mice). d, Vasopressin neuron dynamics of individual mice during i.g. infusions of water or NaCl (n = 4 mice). Error bars and shaded areas represent mean ± s.e.m.
Figure 4.
Figure 4.. Individual glutamatergic MnPO neurons integrate information from the oropharynx, GI tract, and blood.
a, Illustration of the neural circuit that controls fluid homeostasis . b, Schematic for generation of the Nxph4–2a-Cre mouse line (left) and GFP-reporter recombination in the MnPO (right; scale bar, 100 μm). c, Schematic for microendoscope imaging of glutamatergic MnPO neurons (scale bar, 100 μm). d, Dynamics of individual neurons tracked during vehicle i.p. injection, 3 M NaCl i.p. injection, and water drinking. e, Average responses of neuron clusters (n = 47 neurons; see Extended Data Fig. 7a). f, Dynamics of individual neurons tracked during water i.g. infusion after dehydration (left) and during 500 mM NaCl i.g. infusion while hydrated (right). g, Correlation between the responses (z-score) of individual neurons to water i.g. and 500 mM NaCl i.g. (n = 38 neurons; linear regression, R = 0.2154, P = 0.0033). h, Average response to 3 M NaCl i.p. injection of neurons that were inhibited (red; 26% inhibited ≥1σ after infusion) or un-modulated (black; 74%) by water i.g. infusion (n = 53 neurons; see Extended Data Fig. 7d). Shaded areas in time-courses represent mean ± s.e.m. and in regressions represent 95% confidence interval of the line-of-best-fit.
Figure 5.
Figure 5.. GABAergic MnPO neurons bidirectionally encode fluid ingestion.
a, Schematic for microendoscope imaging of GABAergic MnPO neurons (scale bar, 100 μm). b, Dynamics of individual neurons during water access after dehydration. c, Dynamics during drinking (left). Example tuning maps (right). d, Average responses of ingestion-activated (modulated ≥1σ during first min of drinking), ingestion-inhibited (modulated ≤–1σ), and untuned neurons during drinking (n = 77 neurons). e, Dynamics of individual neurons tracked during water i.g. infusion while hydrated (left) and during drinking after dehydration (right). f, Correlation between the responses (z-score) of individual neurons to water i.g. and drinking (n = 46 neurons; linear regression, R = 0.1062, P = 0.0271). g, Correlation between the responses (z-score) to water i.g. and 500 mM NaCl i.g. (n = 45 neurons; linear regression, R = 0.0467, P = 0.1514). Shaded areas in b represent individual licks; in d represent mean ± s.e.m.; in f,g represent 95% confidence interval of the line-of-best-fit.

Comment in

  • A thirst-quenching gut-brain signal.
    Dickson I. Dickson I. Nat Rev Gastroenterol Hepatol. 2019 Jun;16(6):327. doi: 10.1038/s41575-019-0147-5. Nat Rev Gastroenterol Hepatol. 2019. PMID: 30980029 No abstract available.

References

    1. Zimmerman CA, Leib DE & Knight ZA Neural circuits underlying thirst and fluid homeostasis. Nat. Rev. Neurosci 18, 459–469, doi:10.1038/nrn.2017.71 (2017). - DOI - PMC - PubMed
    1. Gizowski C & Bourque CW The neural basis of homeostatic and anticipatory thirst. Nat. Rev. Nephrol 14, 11–25, doi:10.1038/nrneph.2017.149 (2018). - DOI - PubMed
    1. Johnson AK & Thunhorst RL The neuroendocrinology of thirst and salt appetite: visceral sensory signals and mechanisms of central integration. Front. Neuroendocrinol 18, 292–353, doi:10.1006/frne.1997.0153 (1997). - DOI - PubMed
    1. McKinley MJ & Johnson AK The physiological regulation of thirst and fluid intake. News Physiol. Sci 19, 1–6, doi:10.1152/nips.01470.2003 (2004). - DOI - PubMed
    1. Bellows RT Time factors in water drinking in dogs. Am. J. Physiol 125, 87–97, doi:10.1152/ajplegacy.1938.125.1.87 (1938). - DOI

MeSH terms