Microbiota Metabolite Butyrate Differentially Regulates Th1 and Th17 Cells' Differentiation and Function in Induction of Colitis
- PMID: 30918945
- PMCID: PMC6701512
- DOI: 10.1093/ibd/izz046
Microbiota Metabolite Butyrate Differentially Regulates Th1 and Th17 Cells' Differentiation and Function in Induction of Colitis
Abstract
Background: How the gut microbiota regulates intestinal homeostasis is not completely clear. Gut microbiota metabolite short-chain fatty acids (SCFAs) have been reported to regulate T-cell differentiation. However, the mechanisms underlying SCFA regulation of T-cell differentiation and function remain to be investigated.
Methods: CBir1, an immunodominant microbiota antigen, transgenic T cells were treated with butyrate under various T-cell polarization conditions to investigate butyrate regulation of T-cell differentiation and the mechanism involved. Transfer of butyrate-treated CBir T cells into Rag1-/- mice was performed to study the in vivo role of such T cells in inducing colitis.
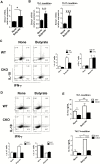
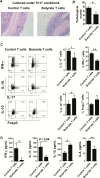
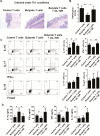
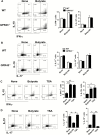
Results: Although butyrate promoted Th1 cell development by promoting IFN-γ and T-bet expression, it inhibited Th17 cell development by suppressing IL-17, Rorα, and Rorγt expression. Interestingly, butyrate upregulated IL-10 production in T cells both under Th1 and Th17 cell conditions. Furthermore, butyrate induced T-cell B-lymphocyte-induced maturation protein 1 (Blimp1) expression, and deficiency of Blimp1 in T cells impaired the butyrate upregulation of IL-10 production, indicating that butyrate promotes T-cell IL-10 production at least partially through Blimp1. Rag1-/- mice transferred with butyrate-treated T cells demonstrated less severe colitis, compared with transfer of untreated T cells, and administration of anti-IL-10R antibody exacerbated colitis development in Rag-/- mice that had received butyrate-treated T cells. Mechanistically, the effects of butyrate on the development of Th1 cells was through inhibition of histone deacetylase but was independent of GPR43.
Conclusions: These data indicate that butyrate controls the capacity of T cells in the induction of colitis by differentially regulating Th1 and Th17 cell differentiation and promoting IL-10 production, providing insights into butyrate as a potential therapeutic for the treatment of inflammatory bowel disease.
Keywords: IL-10; Th1 cells; Th17 cells; butyrate; colitis.
© 2019 Crohn’s & Colitis Foundation. Published by Oxford University Press. All rights reserved. For permissions, please e-mail: journals.permissions@oup.com.
Figures


Similar articles
-
Th17 cells induce colitis and promote Th1 cell responses through IL-17 induction of innate IL-12 and IL-23 production.J Immunol. 2011 Jun 1;186(11):6313-8. doi: 10.4049/jimmunol.1001454. Epub 2011 Apr 29. J Immunol. 2011. PMID: 21531892 Free PMC article.
-
TGF-β converts Th1 cells into Th17 cells through stimulation of Runx1 expression.Eur J Immunol. 2015 Apr;45(4):1010-8. doi: 10.1002/eji.201444726. Epub 2015 Feb 11. Eur J Immunol. 2015. PMID: 25605286 Free PMC article.
-
Microbiota-derived short-chain fatty acids promote Th1 cell IL-10 production to maintain intestinal homeostasis.Nat Commun. 2018 Sep 3;9(1):3555. doi: 10.1038/s41467-018-05901-2. Nat Commun. 2018. PMID: 30177845 Free PMC article.
-
IFN-γ and IL-17: the two faces of T-cell pathology in giant cell arteritis.Curr Opin Rheumatol. 2011 Jan;23(1):43-9. doi: 10.1097/BOR.0b013e32833ee946. Curr Opin Rheumatol. 2011. PMID: 20827207 Free PMC article. Review.
-
The Pathogenicity and Synergistic Action of Th1 and Th17 Cells in Inflammatory Bowel Diseases.Inflamm Bowel Dis. 2023 May 2;29(5):818-829. doi: 10.1093/ibd/izac199. Inflamm Bowel Dis. 2023. PMID: 36166586 Review.
Cited by
-
The gut microbiome: A line of defense against tuberculosis development.Front Cell Infect Microbiol. 2023 Apr 18;13:1149679. doi: 10.3389/fcimb.2023.1149679. eCollection 2023. Front Cell Infect Microbiol. 2023. PMID: 37143744 Free PMC article. Review.
-
Andrographolide Inhibition of Th17-Regulated Cytokines and JAK1/STAT3 Signaling in OVA-Stimulated Asthma in Mice.Evid Based Complement Alternat Med. 2021 May 29;2021:6862073. doi: 10.1155/2021/6862073. eCollection 2021. Evid Based Complement Alternat Med. 2021. PMID: 34194525 Free PMC article.
-
The role of the gut microbiota in tumor, immunity, and immunotherapy.Front Immunol. 2024 Jun 5;15:1410928. doi: 10.3389/fimmu.2024.1410928. eCollection 2024. Front Immunol. 2024. PMID: 38903520 Free PMC article. Review.
-
Impact of the Exposome on the Epigenome in Inflammatory Bowel Disease Patients and Animal Models.Int J Mol Sci. 2022 Jul 9;23(14):7611. doi: 10.3390/ijms23147611. Int J Mol Sci. 2022. PMID: 35886959 Free PMC article. Review.
-
Maternal microbiome in preeclampsia pathophysiology and implications on offspring health.Physiol Rep. 2021 May;9(10):e14875. doi: 10.14814/phy2.14875. Physiol Rep. 2021. PMID: 34042284 Free PMC article. Review.
References
-
- Thorburn AN, Macia L, Mackay CR. Diet, metabolites, and “Western-lifestyle” inflammatory diseases. Immunity. 2014;40:833–842. - PubMed
Publication types
MeSH terms
Substances
Grants and funding
LinkOut - more resources
Full Text Sources
Research Materials

