. 2019 Oct 15;527(15):2512-2556.
doi: 10.1002/cne.24688. Epub 2019 May 2.

Molecular architecture of the zebra finch arcopallium

Affiliations

Molecular architecture of the zebra finch arcopallium

Claudio V Mello et al. J Comp Neurol. .

Abstract

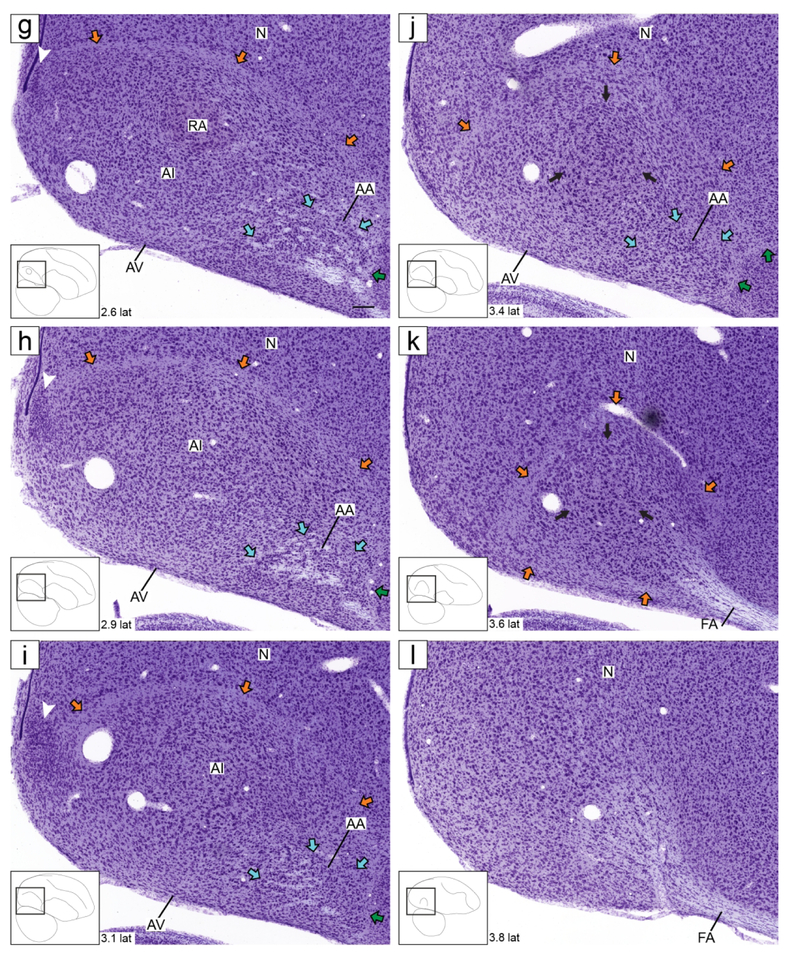
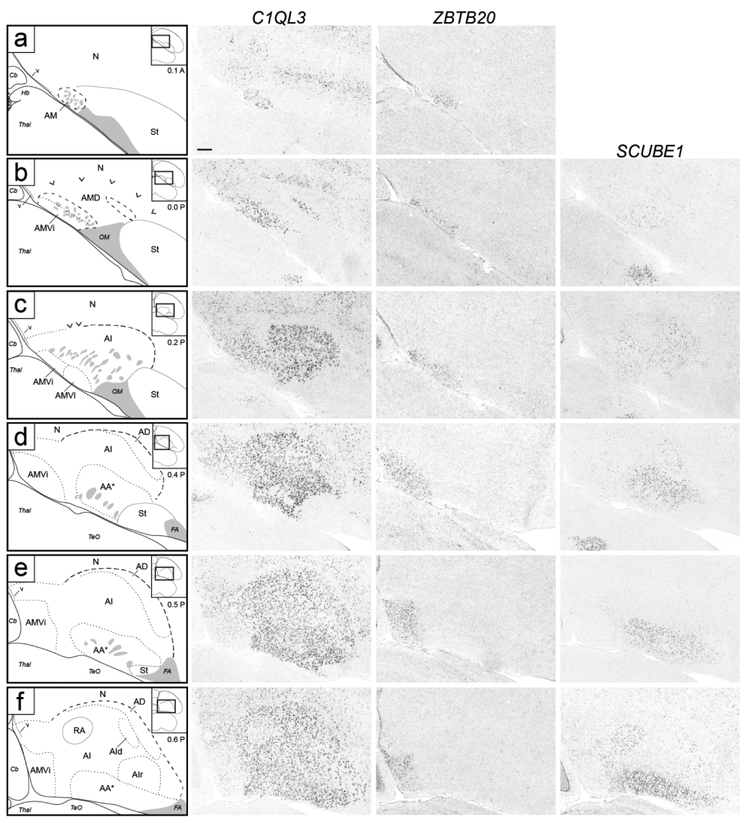
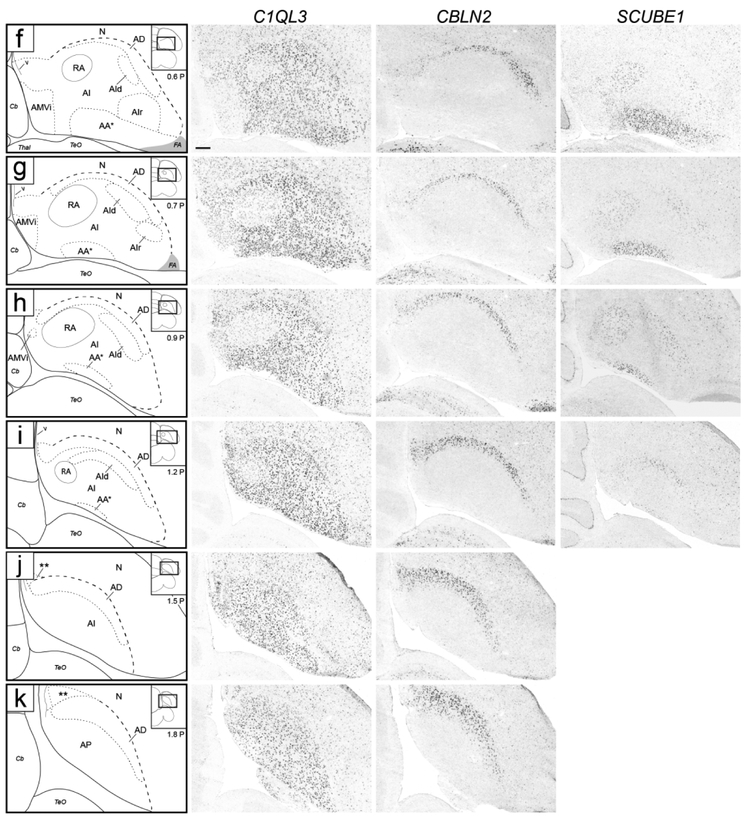
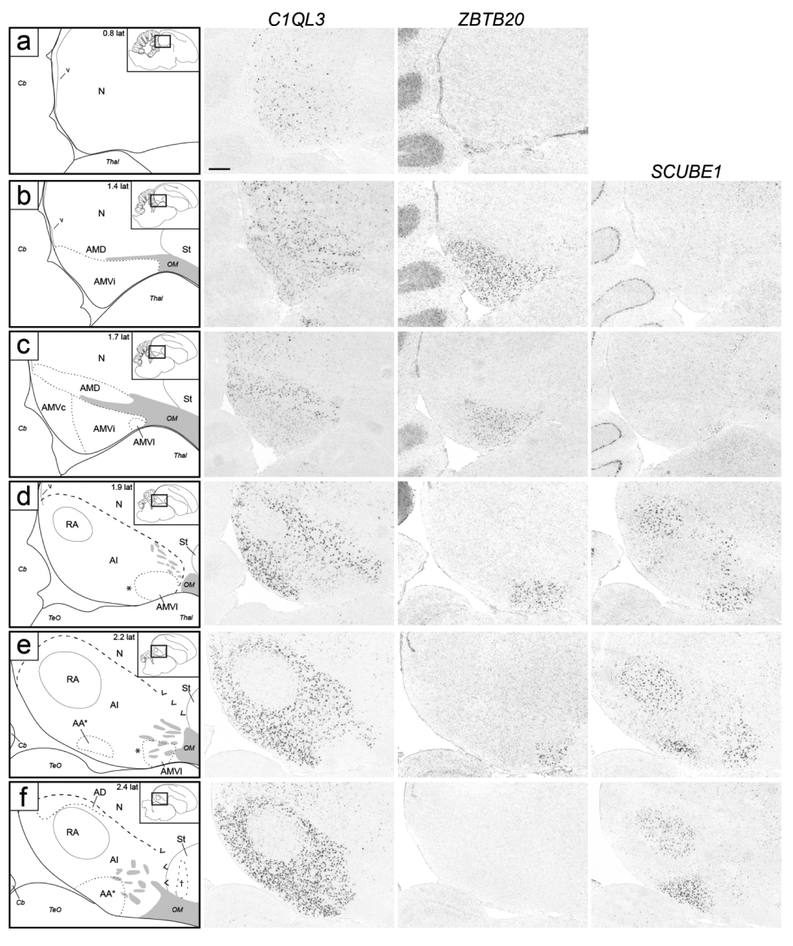
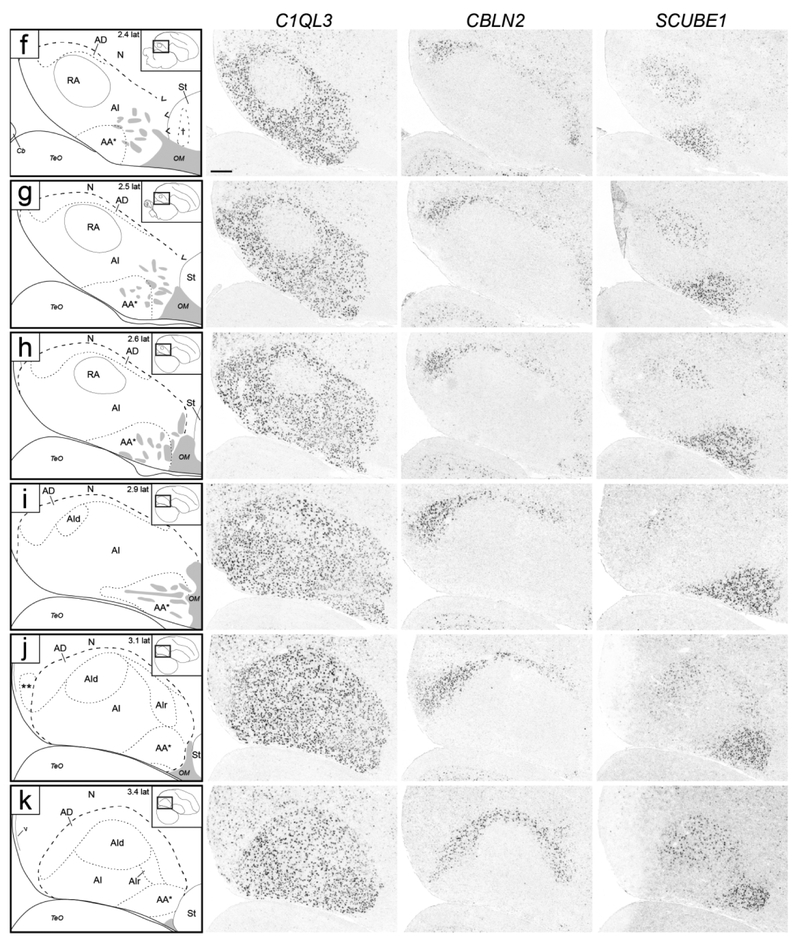
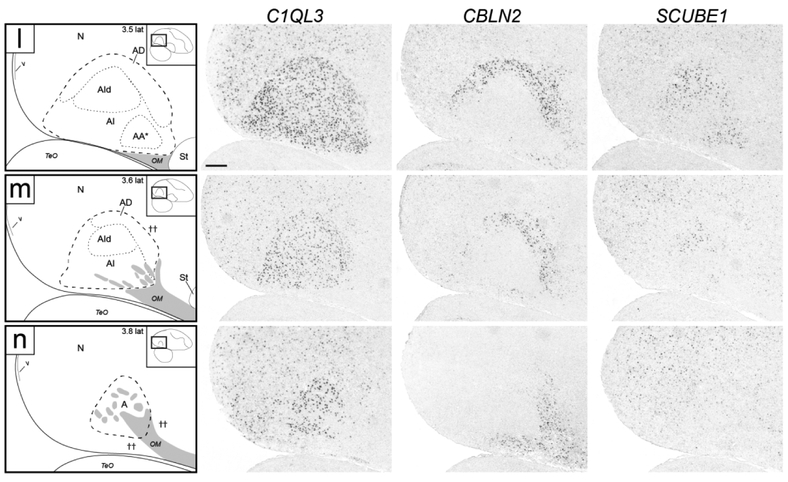
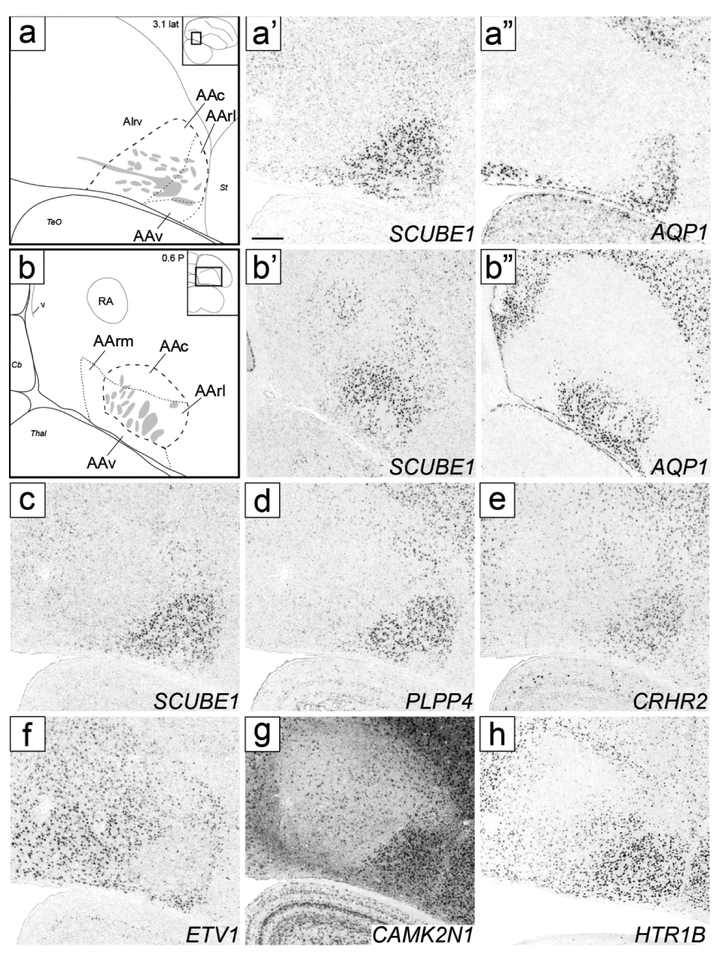
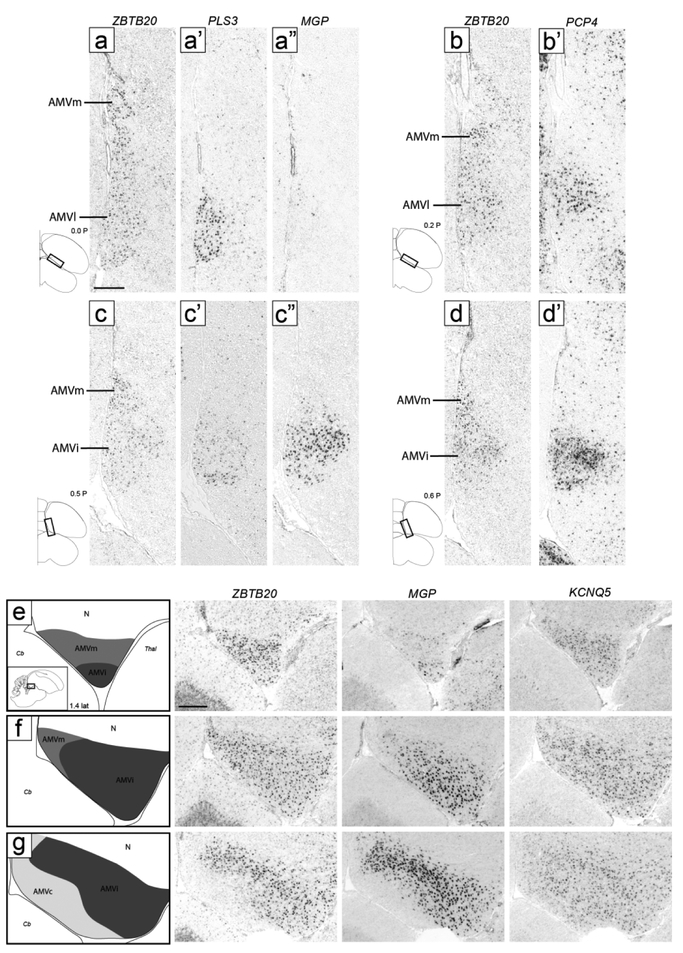
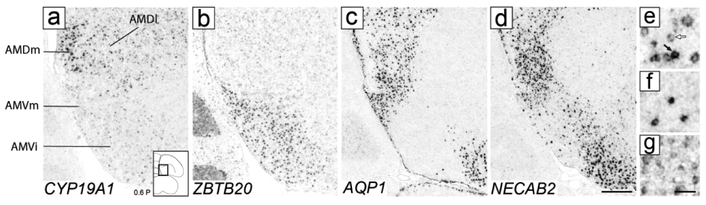
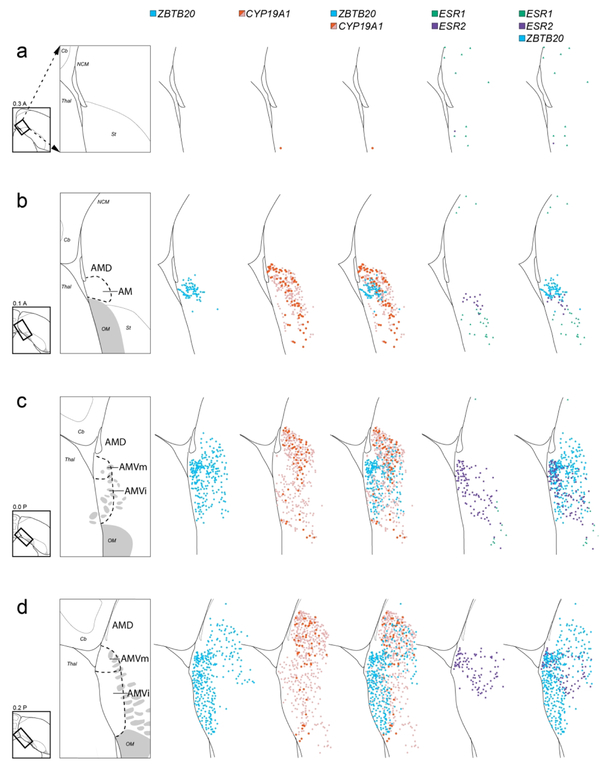
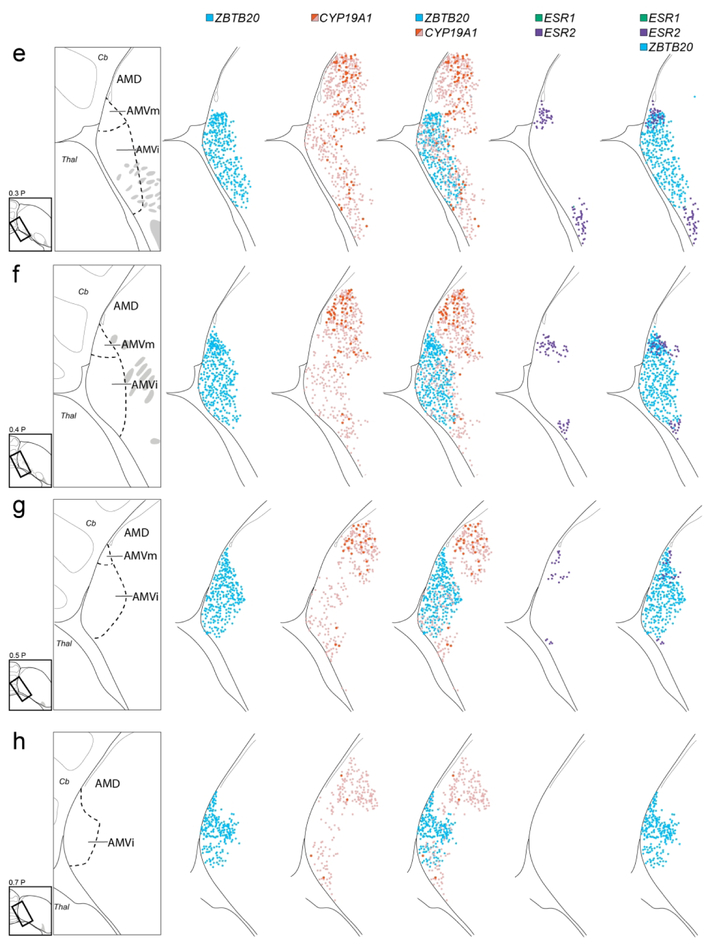
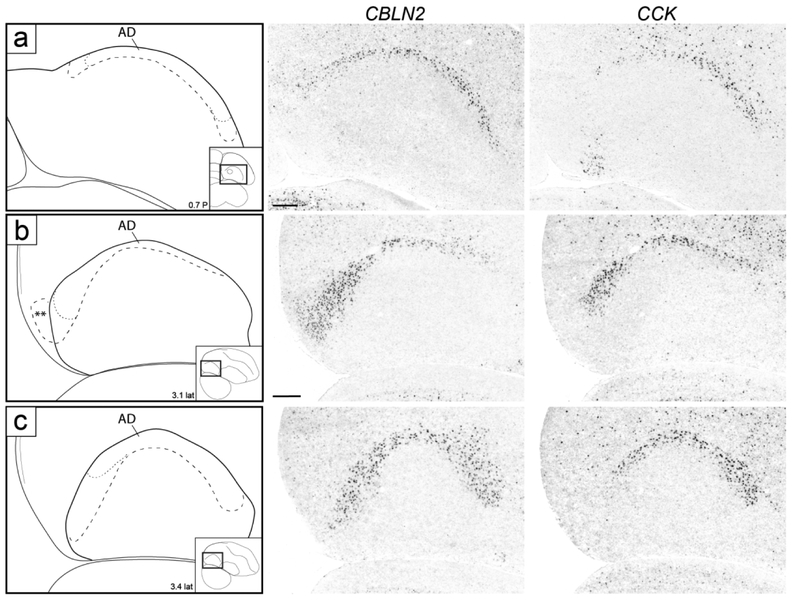
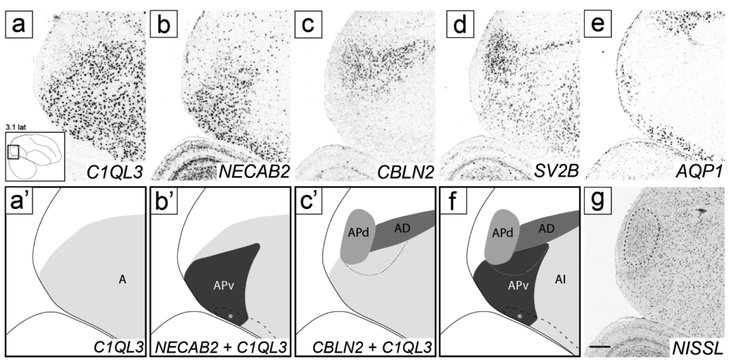
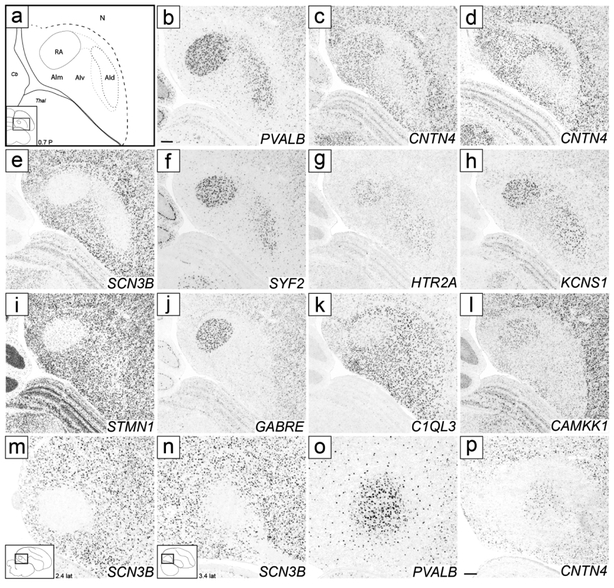
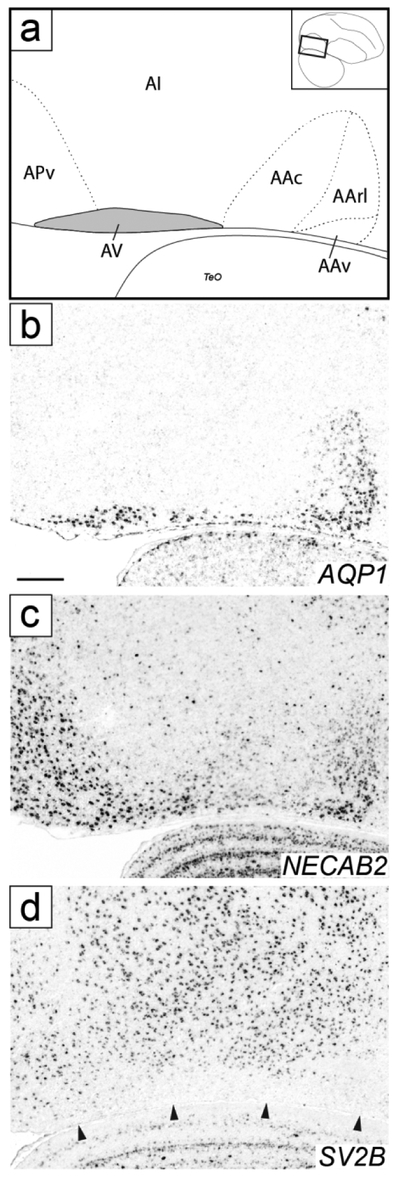
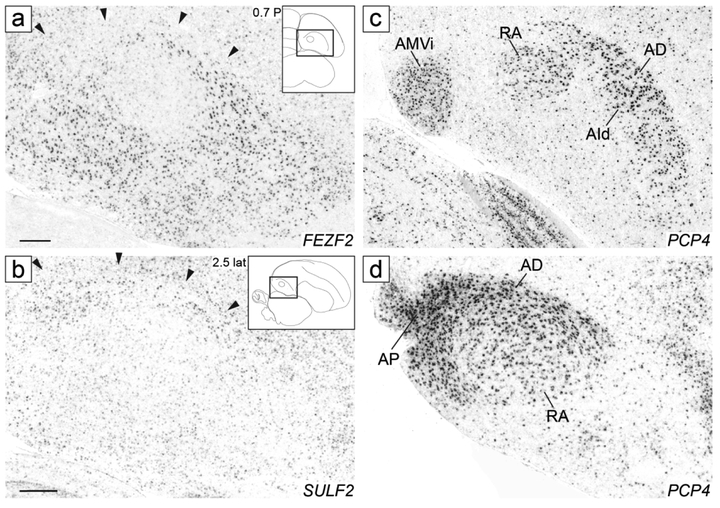
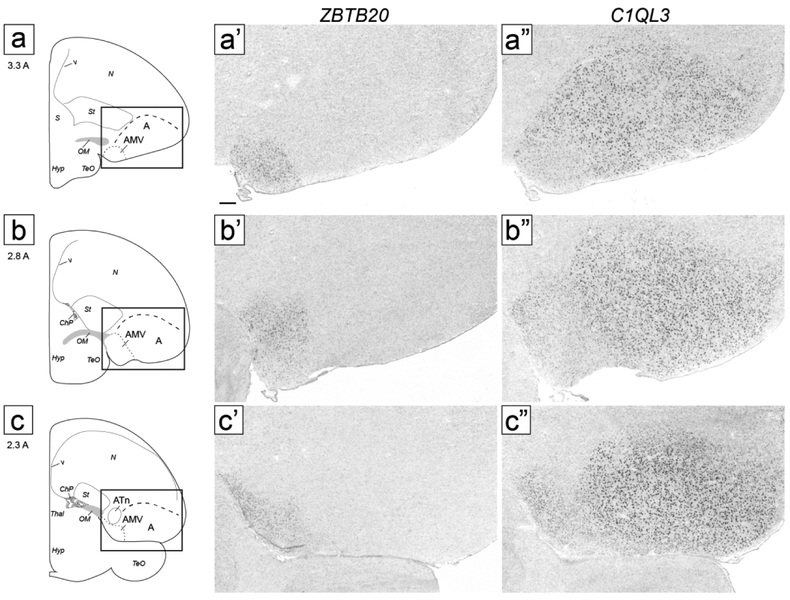
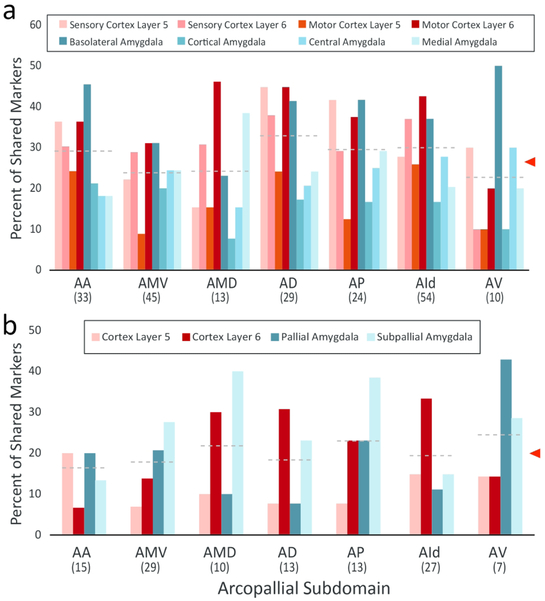
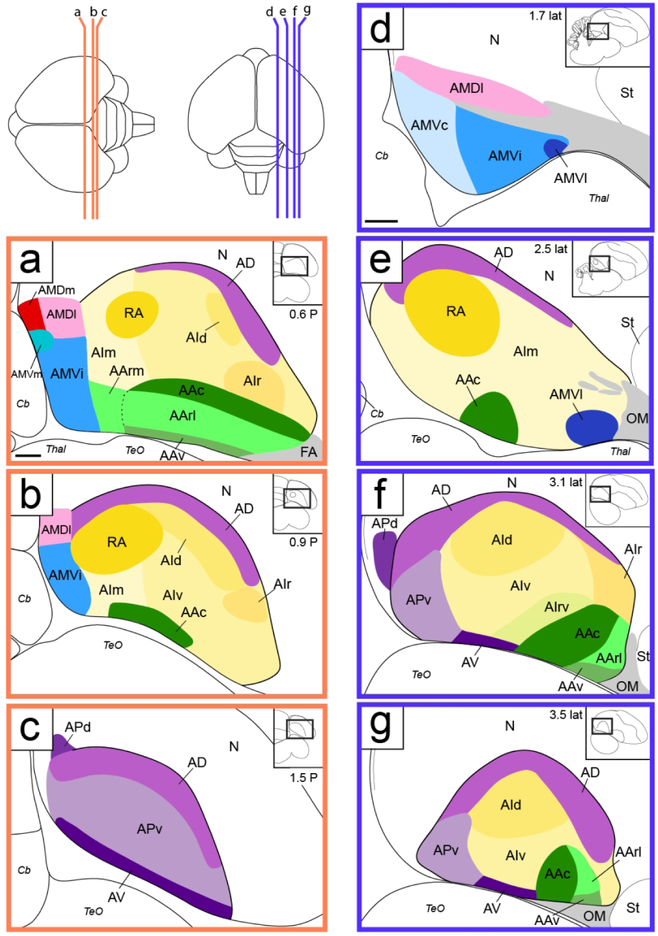
The arcopallium, a key avian forebrain region, receives inputs from numerous brain areas and is a major source of descending sensory and motor projections. While there is evidence of arcopallial subdivisions, the internal organization or the arcopallium is not well understood. The arcopallium is also considered the avian homologue of mammalian deep cortical layers and/or amygdalar subdivisions, but one-to-one correspondences are controversial. Here we present a molecular characterization of the arcopallium in the zebra finch, a passerine songbird species and a major model organism for vocal learning studies. Based on in situ hybridization for arcopallial-expressed transcripts (AQP1, C1QL3, CBLN2, CNTN4, CYP19A1, ESR1/2, FEZF2, MGP, NECAB2, PCP4, PVALB, SCN3B, SCUBE1, ZBTB20, and others) in comparison with cytoarchitectonic features, we have defined 20 distinct regions that can be grouped into six major domains (anterior, posterior, dorsal, ventral, medial, and intermediate arcopallium, respectively; AA, AP, AD, AV, AM, and AI). The data also help to establish the arcopallium as primarily pallial, support a unique topography of the arcopallium in passerines, highlight similarities between the vocal robust nucleus of the arcopallium (RA) and AI, and provide insights into the similarities and differences of cortical and amygdalar regions between birds and mammals. We also propose the use of AMV (instead of nucleus taenia/TnA), AMD, AD, and AI as initial steps toward a universal arcopallial nomenclature. Besides clarifying the internal organization of the arcopallium, the data provide a coherent basis for further functional and comparative studies of this complex avian brain region.

Keywords: RRID: SCR_012988); ZEBrA (www.zebrafinchatlas.org); amygdala; avian; cortical layers; in situ hybridization; molecularly defined brain regions; oscine songbird; taenia.


Figures

Figure 1.
Figure 1.
Localization of the arcopallium in zebra finches. The position and range of sections that contain the arcopallium in adult male zebra finches are shown relative to a dorsal view of the brain. The lines indicate the approximate position of the first and last section in the transverse (orange) and sagittal (blue) series that contain arcopallium and shown in Figs. 2/4 and Figs. 3/5, respectively. Sections containing the arcopallium are located within the area indicated by the red box. The schematic drawings in the blue and orange boxes indicate major structures seen at these brain levels in both planes, while the small rectangles depict the areas of interest containing the arcopallium and shown in Figs. 2-5. Scale: 1mm.
Figure 2.
Figure 2.
Zebra finch arcopallium on Nissl-stained transverse sections. The images (from Karten et al., 2013) depict the arcopallium and major neighboring structures, with boundaries, internal laminae and cytoarchitectonic domains indicated. The small rectangles in the drawings on the lower left indicate the locations of the areas shown in the images, and the coordinates (in mm) indicate the position of the images along the A-P axis relative to the stereotaxic zero (see also Fig. 1, in orange). Yellow arrows: mLAD; orange arrows: lLAD; green arrows: LPS; white arrows: mOM fiber bundles; dark blue arrows: LAV; light blue arrows: LAO; white arrowhead in (c-e): medial part of AMD with large, darkly staining cells; black arrowhead in (d-e): medial part of AMV with small, tightly packed cells; asterisks in (e-f): medial part of AA rich in fiber bundles; black arrows in (i): dorso-lateral part of AI with darkly staining large cells. For abbreviations, see list. Scale: 250 μm.
Figure 2.
Figure 2.
Zebra finch arcopallium on Nissl-stained transverse sections. The images (from Karten et al., 2013) depict the arcopallium and major neighboring structures, with boundaries, internal laminae and cytoarchitectonic domains indicated. The small rectangles in the drawings on the lower left indicate the locations of the areas shown in the images, and the coordinates (in mm) indicate the position of the images along the A-P axis relative to the stereotaxic zero (see also Fig. 1, in orange). Yellow arrows: mLAD; orange arrows: lLAD; green arrows: LPS; white arrows: mOM fiber bundles; dark blue arrows: LAV; light blue arrows: LAO; white arrowhead in (c-e): medial part of AMD with large, darkly staining cells; black arrowhead in (d-e): medial part of AMV with small, tightly packed cells; asterisks in (e-f): medial part of AA rich in fiber bundles; black arrows in (i): dorso-lateral part of AI with darkly staining large cells. For abbreviations, see list. Scale: 250 μm.
Figure 3.
Figure 3.
Zebra finch arcopallium on Nissl-stained sagittal sections. The images (from Karten et al., 2013) depict the arcopallium and major neighboring structures, with boundaries, internal laminae and cytoarchitectonic domains indicated. The small rectangles in the drawings on the lower left indicate the locations of the areas shown in the images, and the coordinates (in mm) indicate the position of the images relative to the midline (see also Fig. 1, in blue). Yellow arrows: mLAD; orange arrows: lLAD; green arrows: LPS; white arrows: mOM fiber bundles; light blue arrows: LAO; black arrowhead in (c): caudal part of AMV with small, tightly packed cells; asterisk in (d): rostro-lateral distinct part of AMV; white arrowhead in (g-i): nucleus with tightly packed cells at the caudal end of the arcopallium; black arrows in (j-k): dorso-lateral part of AI with darkly staining large cells. For abbreviations, see list. Scale: 250 μm.
Figure 3.
Figure 3.
Zebra finch arcopallium on Nissl-stained sagittal sections. The images (from Karten et al., 2013) depict the arcopallium and major neighboring structures, with boundaries, internal laminae and cytoarchitectonic domains indicated. The small rectangles in the drawings on the lower left indicate the locations of the areas shown in the images, and the coordinates (in mm) indicate the position of the images relative to the midline (see also Fig. 1, in blue). Yellow arrows: mLAD; orange arrows: lLAD; green arrows: LPS; white arrows: mOM fiber bundles; light blue arrows: LAO; black arrowhead in (c): caudal part of AMV with small, tightly packed cells; asterisk in (d): rostro-lateral distinct part of AMV; white arrowhead in (g-i): nucleus with tightly packed cells at the caudal end of the arcopallium; black arrows in (j-k): dorso-lateral part of AI with darkly staining large cells. For abbreviations, see list. Scale: 250 μm.
Figure 4.
Figure 4.
Molecular definition of arcopallial boundaries and major domains on transverse sections. Shown are in situ hybridization images for a general arcopallium marker (C1QL3) and for markers of arcopallial divisions AMV (subdomains AMVi and AMVl; ZBTB20), AD (CBLN2), and AA*, RA and AId (SCUBE1). ZBTB20 is only shown for rostral levels (a-f), CBLN2 is only shown for caudal levels (f-k), and level (f) is repeated for ZBTB20 and SCUBE1. Left column: drawings depicting the structures shown on the in situ images. Solid lines represent tissue borders; dashed lines represent gene expression boundaries drawn after alignment and superposition of in situ images from adjacent sections (thick dashes: dorsal C1QL3 boundary; small dashes: internal domains based on boundaries of expression for regional markers, and medial dorsal border of low C1QL3 expression). Carets in (b-c) depict the dorsal border of the rostral arcopallium that is devoid of C1QL3 expression, grey patches indicate fiber bundles, double asterisks in (j-k) indicate small caudal nucleus of low C1QL3 and high CBLN2 expression. The small rectangles in the drawings on the upper right indicate the locations of the areas shown relative to reference sections, coordinates (in mm) indicate the position along the A-P axis relative to the stereotaxic zero (for full range of sections, see Fig. 1, in orange). For abbreviations, see list. Scale: 250 μm.
Figure 4.
Figure 4.
Molecular definition of arcopallial boundaries and major domains on transverse sections. Shown are in situ hybridization images for a general arcopallium marker (C1QL3) and for markers of arcopallial divisions AMV (subdomains AMVi and AMVl; ZBTB20), AD (CBLN2), and AA*, RA and AId (SCUBE1). ZBTB20 is only shown for rostral levels (a-f), CBLN2 is only shown for caudal levels (f-k), and level (f) is repeated for ZBTB20 and SCUBE1. Left column: drawings depicting the structures shown on the in situ images. Solid lines represent tissue borders; dashed lines represent gene expression boundaries drawn after alignment and superposition of in situ images from adjacent sections (thick dashes: dorsal C1QL3 boundary; small dashes: internal domains based on boundaries of expression for regional markers, and medial dorsal border of low C1QL3 expression). Carets in (b-c) depict the dorsal border of the rostral arcopallium that is devoid of C1QL3 expression, grey patches indicate fiber bundles, double asterisks in (j-k) indicate small caudal nucleus of low C1QL3 and high CBLN2 expression. The small rectangles in the drawings on the upper right indicate the locations of the areas shown relative to reference sections, coordinates (in mm) indicate the position along the A-P axis relative to the stereotaxic zero (for full range of sections, see Fig. 1, in orange). For abbreviations, see list. Scale: 250 μm.
Figure 5.
Figure 5.
Molecular definition of arcopallial boundaries and major domains on sagittal sections. Shown are in situ hybridization images for a general arcopallium marker (C1QL3) and for markers of AMV (ZBTB20), AD (CBLN2), and AA*, RA, AId and AIr (SCUBE1). ZBTB20 is only shown for medial levels (a-f), CBLN2 is only shown for lateral levels (f-n), and level f is repeated for ZBTB20 and SCUBE1. Left column: drawings depicting the structures shown on the in situ images. Dashed lines represent gene expression boundaries drawn after alignment and superposition of in situ images from adjacent sections (thick dashes: dorsal C1QL3 boundary; small dashes: internal domains based on boundaries of expression for regional markers, and in panel c also the dorsal border of the medial region of moderate C1QL3 expression). Grey patches indicate fiber bundles, asterisk in (d-e) indicates region of low C1QL3 expression just caudal to AMVl, carets in (e-g) depict dorsal border of area of no C1QL3 expression in rostro-dorsal arcopallium, cross in (f) represents a region of high CBLN2 in the caudal striatum rostral to the arcopallium, double asterisk in (j) indicates small caudal nucleus of low C1QL3 and high CBLN2 expression, double crosses in (m-n) indicate region of high CBLN2 expression just rostral and ventral to the lateral arcopallium. The small rectangles in the drawings on the upper right indicate the locations of the areas shown relative to reference sections, coordinates (in mm) indicate the position relative to the midline (for full range of sections, see Fig. 1, in blue). For abbreviations, see list. Scale: 250 μm.
Figure 5.
Figure 5.
Molecular definition of arcopallial boundaries and major domains on sagittal sections. Shown are in situ hybridization images for a general arcopallium marker (C1QL3) and for markers of AMV (ZBTB20), AD (CBLN2), and AA*, RA, AId and AIr (SCUBE1). ZBTB20 is only shown for medial levels (a-f), CBLN2 is only shown for lateral levels (f-n), and level f is repeated for ZBTB20 and SCUBE1. Left column: drawings depicting the structures shown on the in situ images. Dashed lines represent gene expression boundaries drawn after alignment and superposition of in situ images from adjacent sections (thick dashes: dorsal C1QL3 boundary; small dashes: internal domains based on boundaries of expression for regional markers, and in panel c also the dorsal border of the medial region of moderate C1QL3 expression). Grey patches indicate fiber bundles, asterisk in (d-e) indicates region of low C1QL3 expression just caudal to AMVl, carets in (e-g) depict dorsal border of area of no C1QL3 expression in rostro-dorsal arcopallium, cross in (f) represents a region of high CBLN2 in the caudal striatum rostral to the arcopallium, double asterisk in (j) indicates small caudal nucleus of low C1QL3 and high CBLN2 expression, double crosses in (m-n) indicate region of high CBLN2 expression just rostral and ventral to the lateral arcopallium. The small rectangles in the drawings on the upper right indicate the locations of the areas shown relative to reference sections, coordinates (in mm) indicate the position relative to the midline (for full range of sections, see Fig. 1, in blue). For abbreviations, see list. Scale: 250 μm.
Figure 6.
Figure 6.
Molecular definition of AA and its subdomains. (a) Drawing depicts structures in sagittal images (a’-a” and c-h). (a’-a’’) In situ hybridization images define AA and its subdomains AAc, AArl and AAv based on SCUBE1 (a’) and AQP1 (a’’); AIrv in (a) indicates region of moderate HTR1B expression caudal to AAc (seen in h). (b) Drawing depicts structures in transverse images (b’-b’’). (b’-b’’) In situ hybridization images define AA and its subdomains AAc, AArm, AArl and AAv based on SCUBE1 (b’) and AQP1 (b’’). In both (a) and (b), thick dashed lines represent SCUBE1 expression, thin dashed lines represent AQP1 expression, grey patches indicate fiber bundles, diagrams on upper right indicate positions of the drawn areas relative to reference sections, and coordinates (in mm) indicate the position along the respective axes. (c-h) In situ hybridization sagittal images for positive (c-e/g-h: SCUBE1, PLPP4, CRHR2, CAMK2N1 and HTR1B) and negative (f: ETV1) markers of AA and its subdomains; (c) is a repeat of (a’) for contrast with other genes. For abbreviations, see list. Scale: 250 μm.
Figure 7.
Figure 7.
Molecular definition of AMV subdomains. (a-d) Transverse in situ hybridization images define AMV subdomains based on ZBTB20 and other markers. AMVl is positive for PLS3 (a’), negative for MGP (a’’), and positive for PCP4 (b’); AMVi shows moderate expression of PLS3 (c’) and high expression of MGP (c’’) and PCP4 (d’); AMVm only expresses ZBTB20. Diagrams on bottom left show location of regions shown in all panels relative to reference sections, coordinates (in mm) indicate the position along the A-P axis. (e-g) In situ hybridization images show AMV subdomains on medial sagittal sections. Drawings on the left indicate structures shown in the in situ images, diagram on bottom left of (e) indicates location of areas shown in panels (e-g), coordinate (in mm) indicates the position along the M-L axis. AMVm (medium grey) shows high expression of ZBTB20 and KCNQ5 but not of MGP, AMVi (dark grey) shows high expression of all three markers, and AMVc (light grey) shows high expression of KCNQ5 but not of ZBTB20 or MGP. For abbreviations, see list. Scale: 250 μm.
Figure 8.
Figure 8.
Molecular definition of AMD. (a-b) In situ hybridization images on adjacent transverse sections show high CYP19A1 expression in AMDl and AMDm (a) and ZBTB20 expression in AMVi and AMVm (b). (c-d) In situ hybridization images on transverse sections show high expression of AQP1 (c) and NECAB2 (d) in AMD and AMVm, and low expression in AMVi. The diagram on the bottom right of (a) shows the approximate location of panels (a-d) relative to a reference section, coordinate (in mm) indicates the position along the A-P axis. (e-g) High power views depicting examples of labeled cells that were mapped on serial sections (as shown in Fig. 9). (e) CYP19A1-expressing cells in AMDm, including high label (black arrow) and low label (white arrow) types. (f) ESR1-expressing cells in NCM. (g) ESR2-expressing cells in the ventro-medial arcopallium. For abbreviations, see list. Scale: 250 μm for (a-d); 50 μm for (e-g).
Figure 9.
Figure 9.
Cellular mapping of differential AM markers. Shown from left to right for each level examined are maps of labeled cells in serial in situ hybridization transverse sections processed for: ZBTB20 (blue), CYP19A1 (red for high label cells, pink for low label cells), ZBTB20 and CYP19A1 combined, ESR2 (purple) and ESR1 (green) combined, and ZBTB20 and ESR1/2 combined. The drawings on the left indicate the region and structures shown on the maps, providing a guide for which specific structures contain the various cell types mapped in this analysis. The diagrams to the bottom left of the drawings indicate levels analyzed, coordinates (in mm) indicate the position along the A-P axis and the rectangles indicate the specific areas mapped relative to the reference sections, grey patches depict major fiber bundles. For clarity, we did not distinguish AMD subdivisions in this Figure. Arrows in (a) indicate how the mapped rectangle areas have been rotated to facilitate comparisons across panels. For abbreviations, see list. Scale: 250 μm.
Figure 9.
Figure 9.
Cellular mapping of differential AM markers. Shown from left to right for each level examined are maps of labeled cells in serial in situ hybridization transverse sections processed for: ZBTB20 (blue), CYP19A1 (red for high label cells, pink for low label cells), ZBTB20 and CYP19A1 combined, ESR2 (purple) and ESR1 (green) combined, and ZBTB20 and ESR1/2 combined. The drawings on the left indicate the region and structures shown on the maps, providing a guide for which specific structures contain the various cell types mapped in this analysis. The diagrams to the bottom left of the drawings indicate levels analyzed, coordinates (in mm) indicate the position along the A-P axis and the rectangles indicate the specific areas mapped relative to the reference sections, grey patches depict major fiber bundles. For clarity, we did not distinguish AMD subdivisions in this Figure. Arrows in (a) indicate how the mapped rectangle areas have been rotated to facilitate comparisons across panels. For abbreviations, see list. Scale: 250 μm.
Figure 10.
Figure 10.
Molecular definition of AD. (a-c) In situ hybridization images of CBLN2 and CCK in transverse (a) and sagittal (b-c) sections. Both markers are expressed in AD, but CCK expression is restricted to AD, whereas CBLN2 expression extends further medially and laterally (a) as well as caudally (b-c), beyond AD. Drawings on the left indicate structures shown on in situ panels; larger dashed line indicates AD boundary by CBLN2, thinner dashed line indicates limits of CCK expression; insets on bottom right of drawings indicate location of area of interest on reference sections, coordinates (in mm) indicate the position along the respective axes, double asterisks in (b) indicates region of CBLN2 expression that extends beyond the caudal arcopallium boundary based on C1QL3 expression, as detailed in Figure 11. For abbreviations, see list. Scale: 250 μm.
Figure 11.
Figure 11.
Molecular definition of AP and subdomains. (a-e) In situ hybridization sagittal images of the caudal arcopallium region processed for C1QL3, a general arcopallial marker (a), NECAB2, a marker of APv (b), CBLN2, a marker of AD and APd (c), SV2B, a marker of APd (d), and AQP1, a general negative marker of the arcopallium and of APd (e). The lower left inset in (a) indicates the location of the region shown in all panels relative to a reference section, coordinates (in mm) indicate the position along the M-L axis. (a’-c’) Schematic drawings depicting the AP subdomains defined by the in situ images in (a-c). (f) Summary diagram including all AP subdomains in (a’-c’). (g) Nissl-stained section close to the in situ processed sections in (a-e), depicting APc (see also Fig. 3g-i). Thick dashed line (b’, f) indicates continuation of NECAB2 expression with AV rostrally; asterisk indicates overlap of AP and AQP1-defined AV, further detailed in Figure 13; medium dashed line (c’, f, g) indicates APd boundary, and thin dashed line (c’ and f) indicates region of overlap between NECAB2 and CBLN2. For abbreviations, see list. Scale: 250 μm.
Figure 12.
Figure 12.
Molecular definition of RA, AId, and other AI subdomains. (a) Drawing depicting structures shown in the transverse in situ images in (b-l); dashed lines ventro-medial to AId and between AId and RA indicate regions of variable expression of AId markers; AIm indicates region of high expression of CNTN4 in medial AI; rectangle in the inset on bottom left indicates location of area shown relative to a reference section, coordinate (in mm) indicates the position along the A-P axis. (b-h) In situ hybridization images of positive and negative markers of RA and AId. (i-l) In situ hybridization images of positive and negative markers of RA. (m-p) In situ hybridization images of RA and AId markers on sagittal sections, at the level of RA (m) and AId (n-p); rectangles in the insets on bottom left indicate location of areas shown relative to reference sections, coordinates (in mm) indicate the position along the M-L axis. For abbreviations, see list. Scale: 250 μm.
Figure 13.
Figure 13.
Molecular definition of AV. (a) Drawing depicting structures shown in the sagittal in situ images in (b-d); area in grey shows molecularly defined AV, dashed lines indicate boundaries of AA and AP, as detailed further in Figs. 6 and 11, rectangle in the inset on the top right indicates location of area shown relative to a reference section, coordinate (in mm) indicates the position along the A-P axis. (b-d) Sagittal in situ hybridization images show positive (b-c; AQP1 and NECAB2) and negative (d; SV2B) AV markers; arrowheads in (d) indicate ventral border of the arcopallium. We note that (b) replicates Fig. 6a’’, although partially and at a different angle. For abbreviations, see list. Scale: 250 μm.
Figure 14.
Figure 14.
Analysis of chicken arcopallial domain markers in zebra finch. In situ hybridization images of FEZF2 in the transverse plane (a), SULF2 in the sagittal plane (b), and PCP4 in both transverse (c) and sagittal (d) planes. FEZF2 is a negative marker of AD (a), SULF2 is a positive marker of AD (b), and PCP4 is a positive marker of AMV, RA, AId, AD, and AP (c-d). Black arrowheads in (a-b) indicate the position of the dorsal arcopallial lamina. Inset drawings and rectangles indicate the approximate anterior-posterior (a, c) and medial-lateral levels in mm (b, d), and the position of the in situ images in (a-d). For abbreviations, see list. Image scalebar = 250 μm.
Figure 15.
Figure 15.
Analysis of zebra finch arcopallial domain markers in chicken. In situ hybridization images of ZBTB20 (a’-c’) and C1QL3 (a”-c”) expression in two-week old chick brain in transverse sections corresponding to interaural 3.3, 2.8, and 2.3 mm based on Puelles et al., 2007. Left column (a-c): Drawings depicting major structures and lamina present in in situ images (middle and right columns) defined in adjacent Nissl-stained sections. Coordinates (in mm) indicate the approximate interaural anterior-posterior position. Dashed lines define gene expression boundaries drawn obtained after aligning and superimposing adjacent in situ images (thick dashes: dorsal C1QL3 boundary; thin dashes: boundary of AMV as defined by ZBTB20). For abbreviations, see list. Scale: 250 μm.
Figure. 16.
Figure. 16.
Analysis of marker correspondences between arcopallial subdomains and mouse cortical and amygdalar subdivisions. The expression patterns of 129 genes were analyzed in parallel in finch (ZEBrA) and mouse (MBA; mouse.brain-map.org, SCR_002978) and scored based upon whether they were makers of at least one of 7 major arcopallial subdomains (AA, AMV and AMD within AM, AD, AP, AId, and AV), 4 cortical layers (layers 5 and 6 of sensory and motor cortex) or 4 major amygdalar nuclei (central, medial, basolateral, and cortical amygdala; see Methods for details). (a) Graph showing the proportions of molecular markers shared between each arcopallial domain and layers 5 and 6 of motor and sensory cortices, as well as subpallial (central and medial) and pallial (basal lateral and cortical) amygdalar nuclei. (b) Graph showing the proportion of genes that each arcopallial domain shares with cortical layers or amygdalar nuclei after removing genes found to be markers of both cortical and amygdalar structures. In (a) and (b), dotted lines indicate the mean proportion of shared markers for each arcopallial domain compared with all mammalian structures analyzed; red triangle indicate the overall average proportion of markers shared across all comparisons; numbers shown beneath the arcopallial domains represent the numbers of genes that were shared uniquely with at least one cortical layer or amygdalar nucleus. For abbreviations, see list.
Figure 17.
Figure 17.
Summary of major arcopallial domains and subdomains, identified based on their molecular signatures. Depicted are the various areas identified in this study, on representative transverse (a-c; orange) and sagittal (d-g; blue) sections. We note the transverse plane corresponds to the Frankfurt plane (as discussed in Karten et al., 2013), and thus the diagrams are not exactly orthogonal to those presented in sagittal plane. The levels of the sections for each series are indicated on the dorsal brain views on the upper left. Rectangles in the insets on the upper right of each panel indicate location of area shown relative to a reference section. Coordinates (in mm) indicate the position along the A-P axis for transverse sections (a-c) and position along the M-L axis for sagittal sections (d-g). For abbreviations, see list. Scale bar: 250 μm.

References

    1. Abellan A, Legaz I, Vernier B, Retaux S, Medina L. 2009. Olfactory and amygdalar structures of the chicken ventral pallium based on the combinatorial expression patterns of LIM and other developmental regulatory genes. J Comp Neurol 516(3):166–186. - PubMed
    1. Absil P, Braquenier JB, Balthazart J, Ball GF. 2002. Effects of lesions of nucleus taeniae on appetitive and consummatory aspects of male sexual behavior in Japanese quail. Brain Behav Evol 60(1):13–35. - PubMed
    1. Acharya KD, Veney SL. 2012. Characterization of the G-protein-coupled membrane-bound estrogen receptor GPR30 in the zebra finch brain reveals a sex difference in gene and protein expression. Dev Neurobiol 72(11):1433–1446. - PubMed
    1. Arnold AP. 1980. Quantitative analysis of sex differences in hormone accumulation in the zebra finch brain: methodological and theoretical issues. J Comp Neurol 189(3):421–436. - PubMed
    1. Atoji Y, Saito S, Wild JM. 2006. Fiber connections of the compact division of the posterior pallial amygdala and lateral part of the bed nucleus of the stria terminalis in the pigeon (Columba livia). J Comp Neurol 499(2):161–182. - PubMed

Publication types

MeSH terms