. 2019 Jun;18(3):e12948.
doi: 10.1111/acel.12948. Epub 2019 Mar 28.

Long-term caloric restriction ameliorates deleterious effects of aging on white and brown adipose tissue plasticity

Affiliations

Long-term caloric restriction ameliorates deleterious effects of aging on white and brown adipose tissue plasticity

Patricia Corrales et al. Aging Cell. 2019 Jun.

Abstract

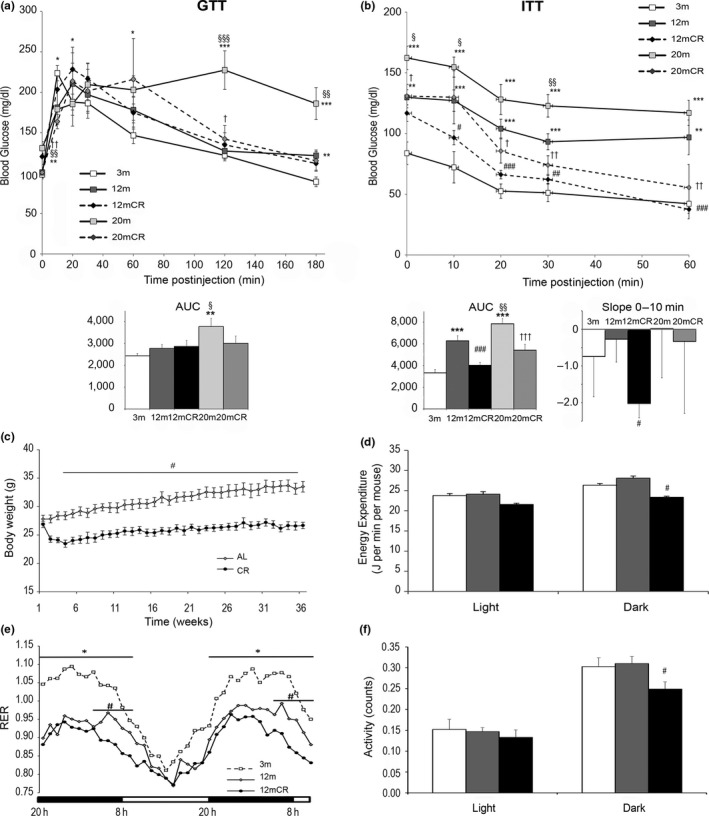
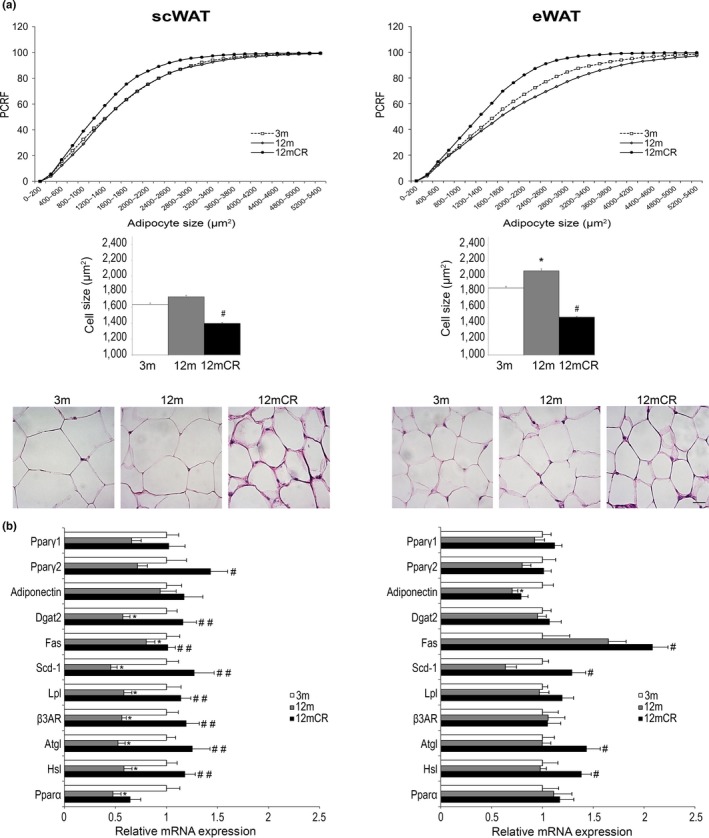
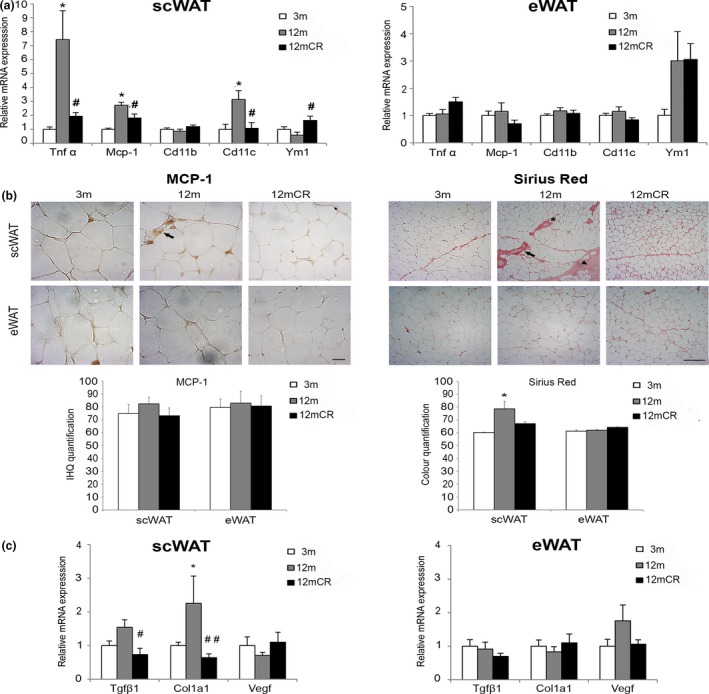
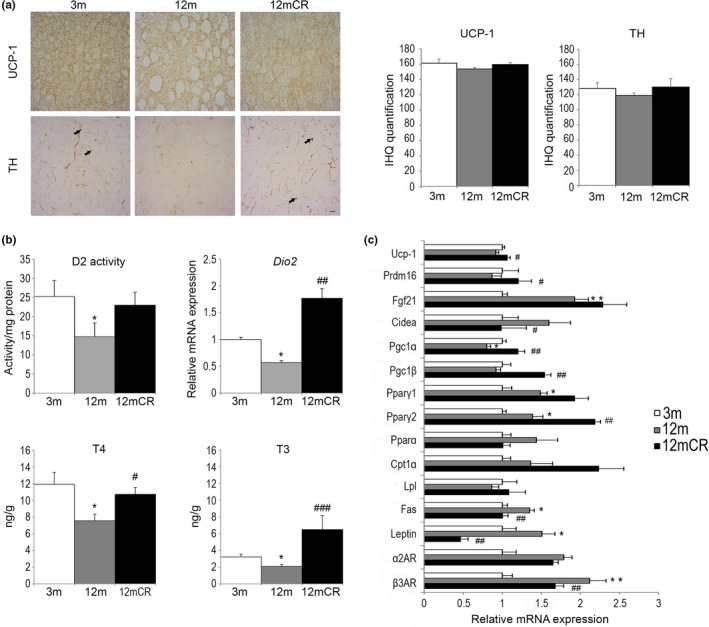
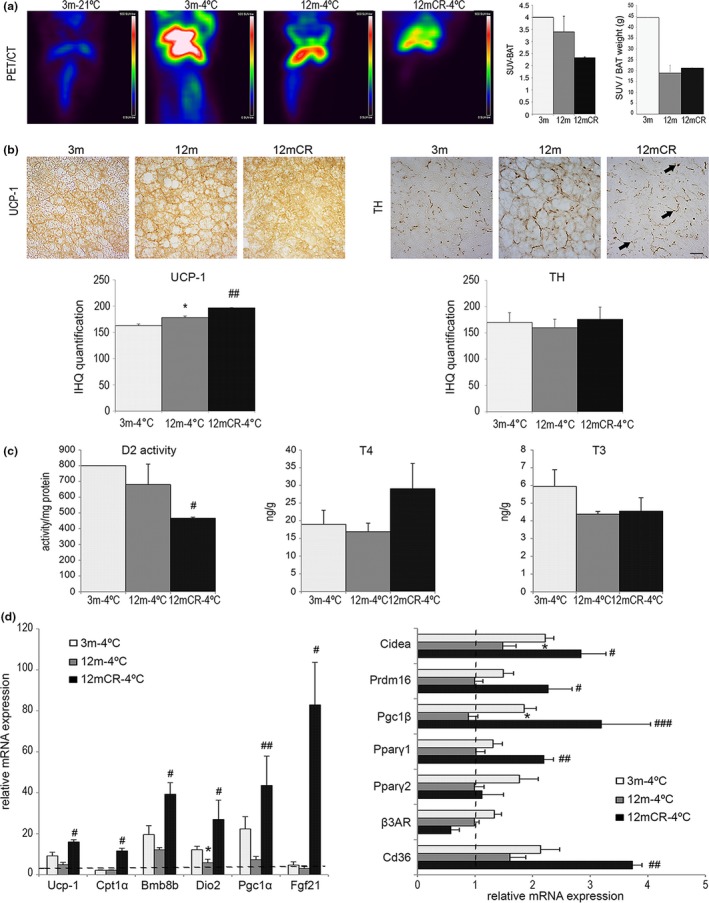
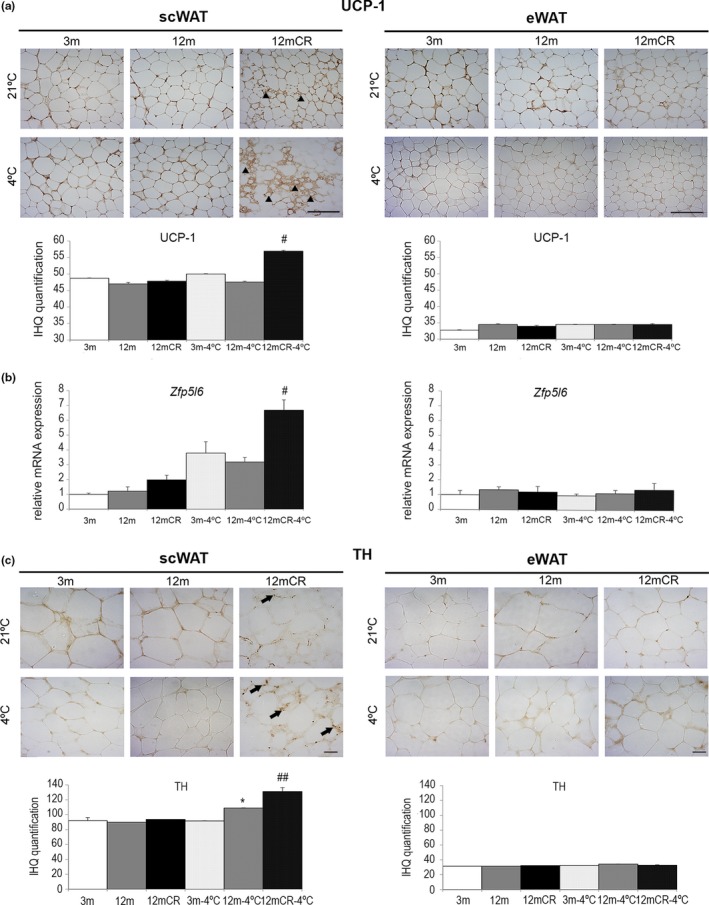
Age-related increased adiposity is an important contributory factor in the development of insulin resistance (IR) and is associated with metabolic defects. Caloric restriction (CR) is known to induce weight loss and to decrease adiposity while preventing metabolic risk factors. Here, we show that moderate 20% CR delays early deleterious effects of aging on white and brown adipose tissue (WAT and BAT, respectively) function and improves peripheral IR. To elucidate the role of CR in delaying early signs of aging, young (3 months), middle-aged (12 months), and old (20 months) mice fed al libitum and middle-aged and old mice subjected to early-onset CR were used. We show that impaired plasticity of subcutaneous WAT (scWAT) contributes to IR, which is already evident in middle-aged mice. Moreover, alteration of thyroid axis status with age is an important factor contributing to BAT dysfunction in middle-aged animals. Both defects in WAT and BAT/beige cells are ameliorated by CR. Accordingly, CR attenuated the age-related decline in scWAT function and decreased the extent of fibro-inflammation. Furthermore, CR promoted scWAT browning. In brief, our study identifies the contribution of scWAT impairment to age-associated metabolic dysfunction and identifies browning in response to food restriction, as a potential therapeutic strategy to prevent the adverse metabolic effects in middle-aged animals.

Keywords: adipose tissue; aging; caloric restriction; fibro-inflammation; insulin resistance; thyroid hormone.


Conflict of interest statement

None declared.

Figures

Figure 1
Figure 1
Effect of aging and caloric restriction on body weight, energy expenditure, and insulin sensitivity. (a) GTT and (b) ITT curves with their respective AUC from 3‐m, 12‐m, 12mCR, 20‐m, and 20mCR mice. Slopes from 0 to 10 m in ITT are also represented in (b). (c) Evolution of body weight in 12‐month‐old mice fed ad libitum (12 m) or 20% CR (12mCR). (d–f) Indirect calorimetry was measured every hour: (d) energy expenditure (J/min/mouse), (e) respiratory exchange ratio (RER), and (e) locomotor activity (counts). Data are expressed as mean ± SEM (a, b: n = 7–9 animals/group; c: n = 11–24 animals/group; d–f: n = 3–9 animals/group). * p < 0.05, ** p < 0.01, *** p < 0.01 12 m or 20 m vs. 3 m; § p < 0.05, §§ p < 0.01, §§§ p < 0.001 20 m vs. 12 m; # p < 0.05, ## p < 0.01, ### p < 0.001 12mCR vs. 12 m; † p < 0.05 20mCR vs. 20 m
Figure 2
Figure 2
Morphology of adipocytes and expression of adipose markers in subcutaneous and epididymal WAT during aging. (a) Representative images, percent relative cumulative frequency (PRCF) of adipocytes, total adipocyte cell size, and representative images (hematoxylin‐eosin‐stained histological sections (magnification 40×, scale bar = 20μm)) from subcutaneous WAT (scWAT) and epididymal WAT (eWAT). (b) mRNA levels of adipogenic markers and lipid metabolism genes in scWAT and eWAT. All data are expressed as mean ± SEM (A, C: n = 7–9 animals/group). * p < 0.05, 12 m vs. 3 m; # p < 0.05, ## p < 0.01, 12mCR vs. 12 m
Figure 3
Figure 3
Increased fibro‐inflammation state in scWAT at early stages of aging. (a) mRNA levels of representative inflammatory genes in scWAT and eWAT in the three experimental groups. (b) Representative images of immunohistochemically analysis of MCP‐1 expression in paraffin‐embedded scWAT and eWAT from histological sections (magnification 40×, scale bar = 20μm) of the experimental groups (n = 4 animals/group). No immunoreaction was observed in the negative control treated with PBS without primary antibody (not shown). Arrows = locations of infiltrated MCP‐1‐expressing macrophages, which form crown‐like structures surrounding dead and dying adipocytes. Moreover, representative images of histological determination of fibrosis with Sirius red staining for collagen in paraffin‐embedded fat depots (magnification 10×, scale bar = 500μm) of the three experimental groups (n = 4 animals/group) are shown. Arrows = abundant fibrosis around vessels; arrowheads = collagen fibers organized in bundles containing a few adipocytes isolated from the rest of the parenchyma; asterisk = thinner collagen fibrils around adipocytes (i.e., pericellular fibrosis). (c) mRNA levels of representative fibrosis genes in scWAT and eWAT in the three experimental groups. All data are expressed as mean ± SEM (a, d: n = 7–9 animals/group). * p < 0.05, 12 m vs. 3 m; # p < 0.05, ## p < 0.01, 12mCR vs. 12 m
Figure 4
Figure 4
Altered BAT architecture and thyroid‐regulated energy balance are associated with initial stages of aging. (a) Representative images of immunohistochemistry for UCP‐1 and TH expression in paraffin‐embedded BAT from histological sections (magnification 40×, scale bar = 20μm) of the experimental groups (n = 4 animals/group). Microphotographs show changes in the size of lipid droplets in brown adipocytes within the three experimental groups; arrowheads = TH‐positive parenchymal nerve fibers in 3‐m and 12mCR mice. (b) mRNA levels of BAT activity markers in the brown fat depot in all experimental groups. (c) D2 enzymatic activity, the expression levels of Dio2, and T4 and T3 concentration levels in brown fat depots in the experimental groups. All data are expressed as mean ± SEM (a, c: n = 7–9 animals/group). * p < 0.05, 12 m vs. 3 m; # p < 0.05, ## p < 0.01, ### p < 0.001, 12mCR vs. 12 m
Figure 5
Figure 5
Caloric restriction improves cold exposure response in aged mice. (a) Representative fused 18F‐FDG PET/CT images of the experimental groups at 21 and 4ºC. Three‐month‐old mice at room temperature were used as a control for the procedure. All images show glucose uptake in the BAT, quantified as standardized uptake values (SUVs). Scale bars for 18F‐FDG uptake (in color) are shown on the right of the images. Areas of high 18F‐FDG uptake are represented in red to white colors. Data are represented as mean ± SEM (n = 2–3 animals/group). (b) Representative images of immunohistochemistry of UCP‐1 and TH localization in paraffin‐embedded BAT from histological sections (magnification 40×, scale bar = 20μm) of the experimental groups (n = 4 animals/group). Arrows = TH‐positive parenchymal nerve fibers in exclusively brown adipocytes. (c) D2 enzymatic activity, T4 and T3 concentration levels, in brown fat depots in the experimental groups after cold exposure. (D) mRNA levels of BAT activity markers in the three experimental groups under cold exposure compared with 3‐m mice at room temperature (dotted line). All data are expressed as mean ± SEM (n = 7–9 animals/group). * p < 0.05, 12 m vs. 3 m; # p < 0.05, ## p < 0.01, 12mCR vs. 12 m
Figure 6
Figure 6
Caloric restriction‐induced browning in scWAT at early stages of aging is more pronounced after cold exposure. (a) Representative images of immunohistochemistry of UCP‐1 expression in paraffin‐embedded histological sections of scWAT and eWAT (magnification 20×, scale bar = 50μm) of the experimental groups (n = 4 animals/group). Arrowheads indicate adipocytes with a brown‐like phenotype (adipocytes with multilocular lipid droplets) in 12mCR mice at room temperature. A stronger effect is detected after cold exposure. (b) mRNA levels of zfpl5 in scWAT and eWAT in all experimental groups. All data are expressed as mean ± SEM (n = 7–9 animals/group). # p < 0.05; 12mCR vs. 12 m. (c) Representative images of immunohistochemistry of TH expression in paraffin‐embedded histological sections of scWAT and eWAT (magnification 40×, scale bar = 20μm) of the experimental groups (n = 4 animals/group). Arrows = TH‐positive fibers in the parenchyma that are closely associated with adipocytes in areas containing large numbers of brown adipocytes

References

    1. Anderson, R. M. , Shanmuganayagam, D. , & Weindruch, R. (2009). Caloric Restriction and Aging: Studies in Mice and Monkeys. Toxicologic Pathology, 37, 47–51. - PMC - PubMed
    1. Arita, Y. , Kihara, S. , Ouchi, N. , Takahashi, M. , Maeda, K. , Miyagawa, J. , … Matsuzawa, Y. (1999). Paradoxical decrease of an adipose‐specific protein, adiponectin, in obesity. Biochemical and Biophysical Research Communications, 257, 79–83. - PubMed
    1. Auffret, J. , Viengchareun, S. , Carre, N. , Denis, R. G. P. , Magnan, C. , Marie, P.‐Y. , … Binart, N. (2012). Beige differentiation of adipose depots in mice lacking prolactin receptor protects against high‐fat‐diet‐induced obesity. The FASEB Journal, 26, 3728–3737. 10.1096/fj.12-204958 - DOI - PubMed
    1. Barger, J. L. , Vann, J. M. , Cray, N. L. , Pugh, T. D. , Mastaloudis, A. , Hester, S. N. , … Prolla, T. A. (2017). Identification of tissue‐specific transcriptional markers of caloric restriction in the mouse and their use to evaluate caloric restriction mimetics. Aging Cell, 16, 750–760. 10.1111/acel.12608 - DOI - PMC - PubMed
    1. Basu, R. , Breda, E. , Oberg, A. L. , Powell, C. C. , Dalla Man, C. , Basu, A. , … Rizza, R. A. (2003). Mechanisms of the age‐associated deterioration in glucose tolerance: Contribution of alterations in insulin secretion, action, and clearance. Diabetes, 52, 1738–1748. 10.2337/diabetes.52.7.1738 - DOI - PubMed

Publication types

LinkOut - more resources