. 2019 Mar 28;5(9):e126347.
doi: 10.1172/jci.insight.126347.

Oxidative hotspots on actin promote skeletal muscle weakness in rheumatoid arthritis

Affiliations

Oxidative hotspots on actin promote skeletal muscle weakness in rheumatoid arthritis

Maarten M Steinz et al. JCI Insight. .

Abstract

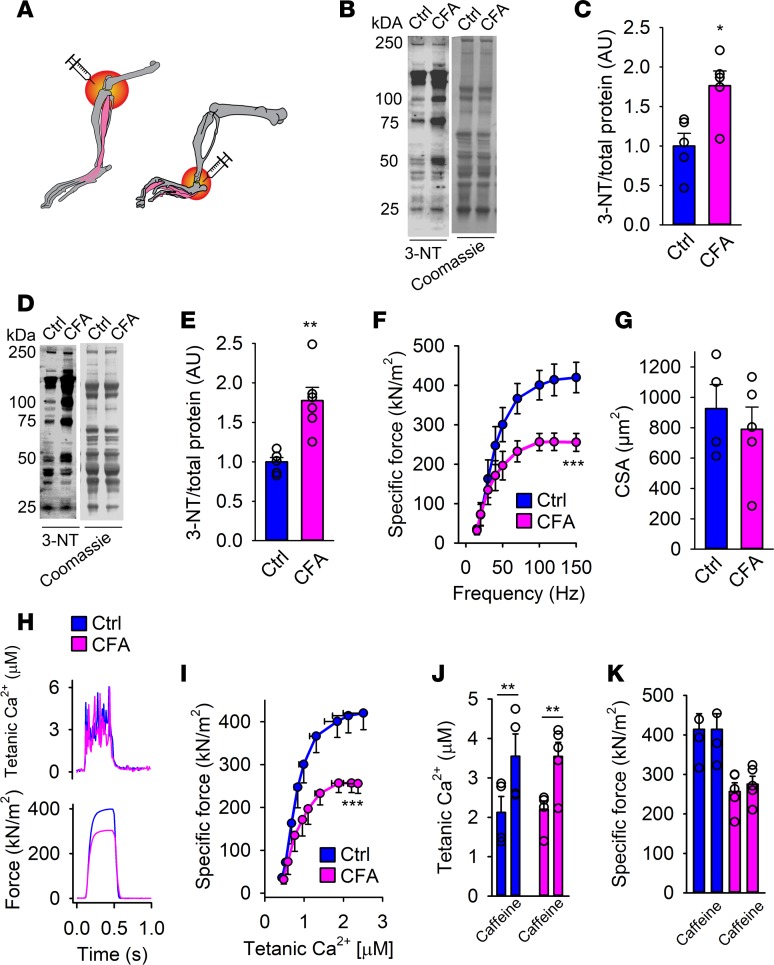
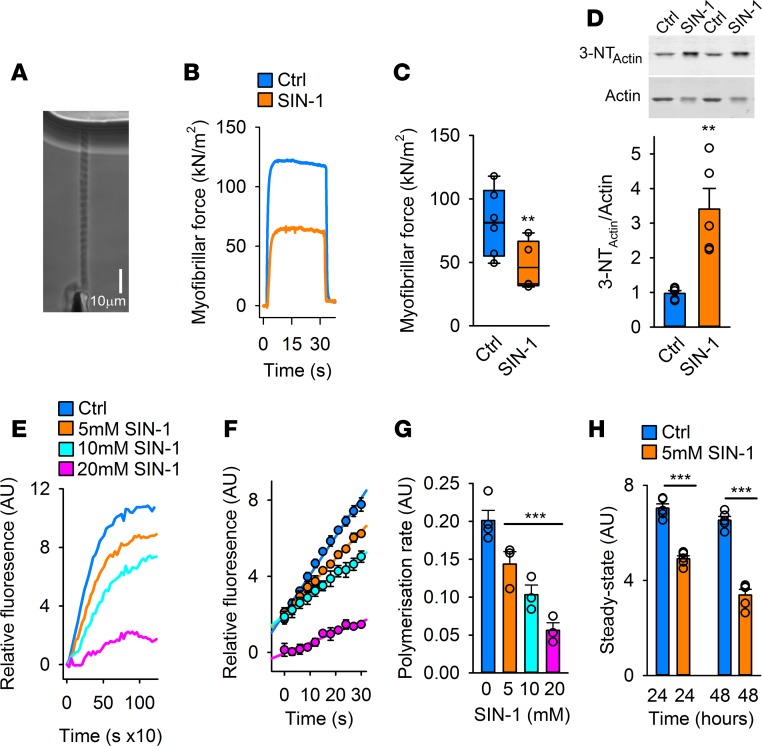
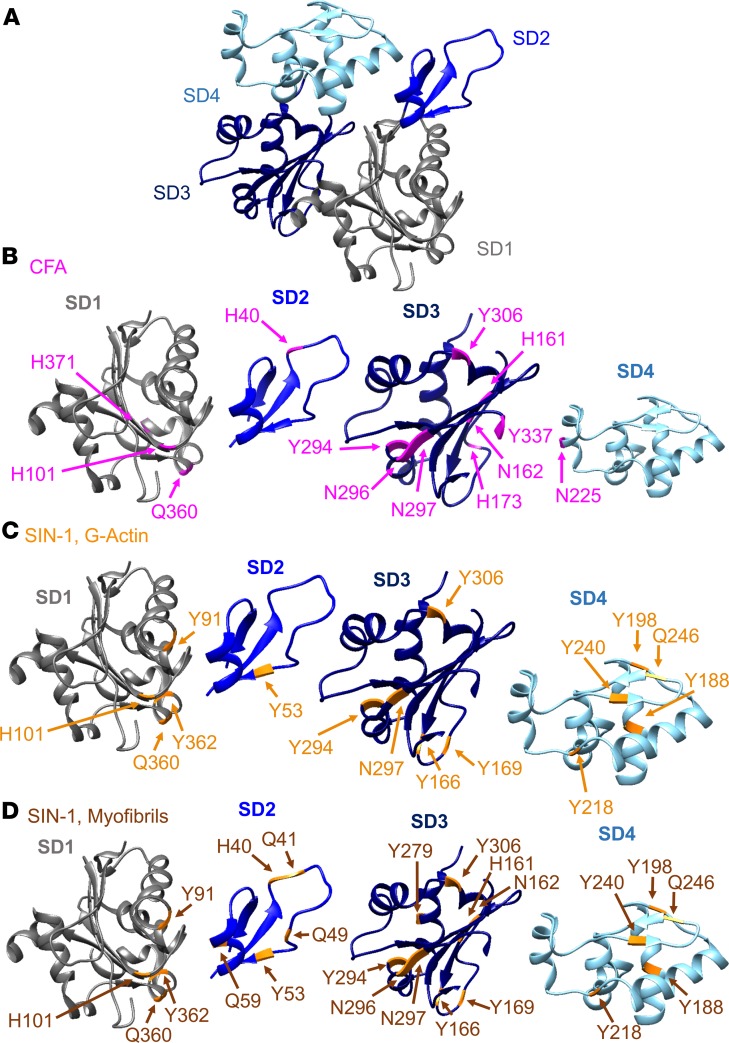
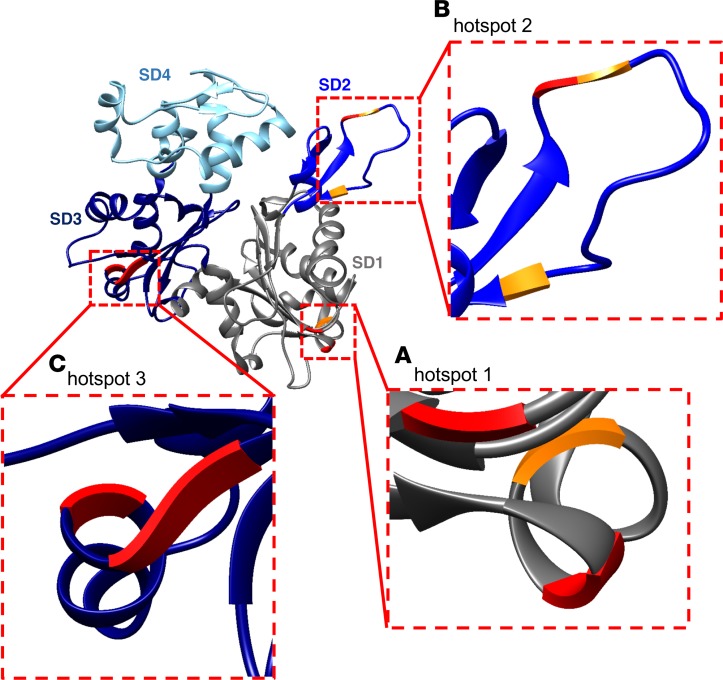
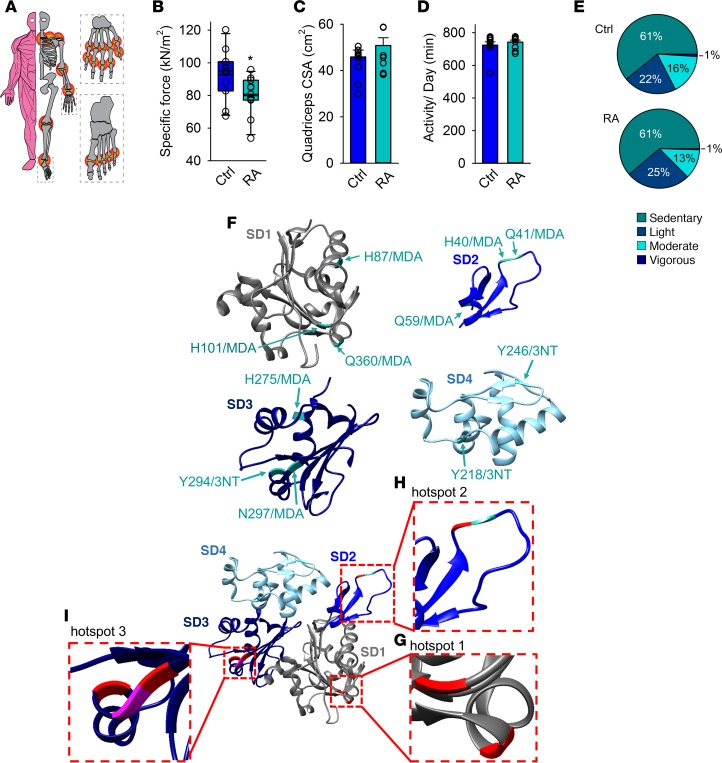
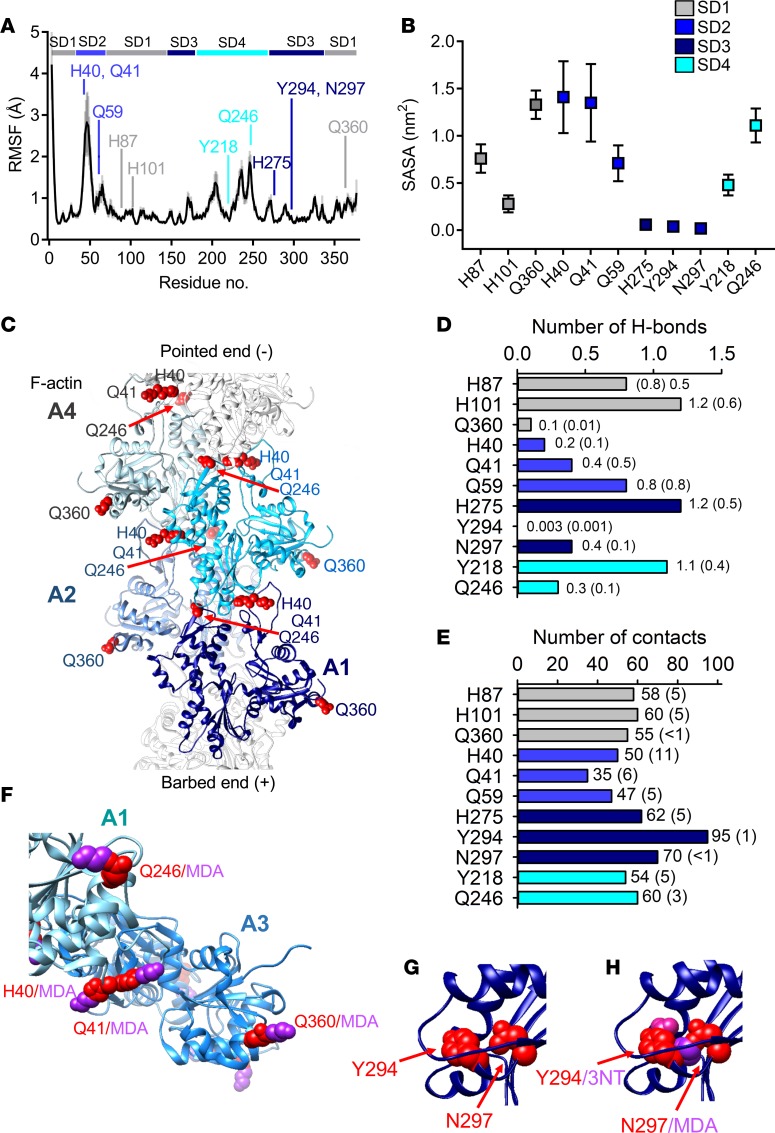
Skeletal muscle weakness in patients suffering from rheumatoid arthritis (RA) adds to their impaired working abilities and reduced quality of life. However, little molecular insight is available on muscle weakness associated with RA. Oxidative stress has been implicated in the disease pathogenesis of RA. Here we show that oxidative post-translational modifications of the contractile machinery targeted to actin result in impaired actin polymerization and reduced force production. Using mass spectrometry, we identified the actin residues targeted by oxidative 3-nitrotyrosine (3-NT) or malondialdehyde adduct (MDA) modifications in weakened skeletal muscle from mice with arthritis and patients afflicted by RA. The residues were primarily located to three distinct regions positioned at matching surface areas of the skeletal muscle actin molecule from arthritis mice and RA patients. Moreover, molecular dynamic simulations revealed that these areas, here coined "hotspots", are important for the stability of the actin molecule and its capacity to generate filaments and interact with myosin. Together, these data demonstrate how oxidative modifications on actin promote muscle weakness in RA patients and provide novel leads for targeted therapeutic treatment to improve muscle function.

Keywords: Muscle Biology; Rheumatology; Skeletal muscle.


Conflict of interest statement

Conflict of interest: The authors have declared that no conflict of interest exists.

Figures

Figure 1
Figure 1. Muscle weakness and accompanied oxidative modifications in skeletal muscle from mice with arthritis.
(A) An illustration of the induction site of arthritis by complete Freund’s adjuvant (CFA) (ankle: used for flexor digitorum brevis [FDB] muscle fiber force measurements; knee: used for extensor digitorum longus [EDL] whole-muscle force measurements). Immunoblots and quantification of 3-nitrotyrosine (3-NT) in interosseous (B and C) and gastrocnemius (D and E) muscle from mice with arthritis (CFA) and healthy controls (Ctrl) (n = 6). 3-NT levels were normalized to total protein Coomassie staining. (F) Ex vivo specific force (contractions induced at 15–150 Hz, n = 4–5) of intact individual muscle fibers from arthritis leg (pink) and healthy controls (blue). (G) Calculated cross-sectional area of FDB fibers from CFA and control legs. (H) Typical examples (120-Hz stimulation frequency, 350-ms train duration) of intracellular (tetanic) Ca2+ (upper) and specific force (lower) in control (blue) and CFA (pink) fibers (n = 4–5). (I) Mean (±SEM) force versus intracellular Ca2+ data obtained in 15- to 150-Hz contractions produced in control fibers and CFA fibers. Mean values of intracellular Ca2+ (J) and specific force (K) in the presence or absence of caffeine (5 mM, 2-minute exposure) in CFA and control FDB fibers. Data are mean ± SEM. Statistical analysis in C, E, G, J, and K was performed using 2-tailed Student’s t test and in F and I by 2-way ANOVA. A P value less than 0.05 was considered significant. *P < 0.05; **P < 0.01; ***P < 0.001.
Figure 2
Figure 2. Oxidative modifications introduced by SIN-1 decrease myofibrillar force and impair actin polymerization.
(A) Phase-contrast image of an isolated myofibril set up for force measurement using the atomic force cantilever (AFC). (B) Typical recordings of active force from AFC measurements in myofibrils at pCa2+ of 4.5 with and without SIN-1 (10 mM, 10 minutes) with DTT present (1 mM DTT) (n = 9–10). (C) Mean (±SEM, n = 9–10) of the active isometric force produced by the myofibrils with or without SIN-1 at a sarcomere length of 2.8 μm and pCa2+ 4.5. (D) Immunoblots and quantification of the 3-NT level on myofibrillar actin (n = 9–10). (E) Typical polymerization recordings of the actin polymerization assay using pyrene-labeled actin polymerized with control G-actin (Ctrl) or G-actin preincubated in SIN-1 (5, 10, or 20 mM; 15-minute preincubation time) (n = 3–4). (F) Mean fluorescence intensity (±SEM, n = 3–4) of the polymerization reaction at half maximum level of polymerization of Ctrl and SIN-1 G-actin (5, 10, or 20 mM, 15 minutes). (G) Mean (±SEM, n = 3–4) polymerization rate during linear elongation stage of polymerization of Ctrl and SIN-1 G-actin (5, 10, or 20 mM, 15 minutes). (H) Mean fluorescence (±SEM, n = 3–4) of Ctrl and SIN-1 (5 mM) G-actin at steady state of G-actin polymerization, 24 and 48 hours after induction of the polymerization. Statistical analysis for C, D, and H was performed by applying 2-tailed Student’s t test. For G, 1-way ANOVA with Holm–Sidak post hoc test was used. A P value less than 0.05 was considered significant. **P < 0.01; ***P < 0.001.
Figure 3
Figure 3. Oxidative 3-NT and MDA modifications on the actin monomer.
(A) Overview of a skeletal muscle α-actin molecule with coloring of subdomain 1 (SD1) in gray, SD2 in light blue, SD3 in dark blue, and SD4 in turquoise, which are kept consistent throughout the figures. (BD) 3-Nitrotyrosine (3-NT) and malondialdehyde (MDA) oxidative modifications were identified on α-actin with mass spectrometry. SD1–SD4 are shown with the recurrent oxidative modifications highlighted in each subdomain. The actin model is adapted from the 2ZWH crystal structure of the Protein Data Bank Europe (PDBe). Tyrosine residues (Y) were nitrated (3-NT), whereas histidine (H), glutamine (Q), and asparagine (N) were MDA modified. (B) SD1–SD4 of oxidatively modified α-actin residues from mice with arthritis (CFA) (pink, n = 5). (C) Overview of the oxidatively modified amino acids identified in SIN-1–treated (5 mM) G-actin (orange, n = 3) and (D) SIN-1–treated (10 mM) myofibrillar actin (brown, n = 3). The models were generated with UCSF Chimera (82).
Figure 4
Figure 4. Three oxidative hotspots on the actin monomer.
The actin monomer with the 3 oxidative hotspots identified by mass spectrometry, visualized with zooms. (A) Hotspot 1 in subdomain 1 (SD1) with histidine (H) 101/MDA, glutamine (Q) 360/MDA, and tyrosine (Y) 362/3-NT. (B) Hotspot 2 in SD2 with H40/MDA, Q41/MDA, and Y53/3-NT. (C) Hotspot 3 in SD3 with Y294/3-NT, asparagine (N) 296/MDA, and N297/3-NT. Amino acids in red represent those residues that had the same modification in SIN-1–treated actin and actin from CFA mice (6 out of 9). The models were generated with UCSF Chimera (82).
Figure 5
Figure 5. Patients with RA exhibit muscle weakness and matching oxidative hotspots on the actin monomer.
(A) An illustration of the composite disease activity score (DAS), with a 44-joint count (red circles) to assess swelling and 53-joint count to assess pain (DAS can range from 0.23 to 9.87). Mean ± SEM DAS was 3.3 ± 0.4 (n = 11, see Supplemental Table 3 for details). (B) Mean ± SEM of isometric specific force of quadriceps femoris from patients with RA and healthy controls (n = 11 per group). (C) Cross-sectional area (CSA) of quadriceps femoris measured by CT scans (mean ± SEM, n = 11). (D) Total daily activity in minutes measured with Actilife accelerometers (mean ± SEM, n = 11) and (E) percentage time spent in each defined activity category. (F) Overview of the oxidative 3-nitrotyrosine (3-NT) and malondialdehyde (MDA) modified amino acids on skeletal muscle actin (SD1–SD4) identified by mass spectrometry in patients with RA (n = 5). The actin model is adapted from the 2ZWH crystal structure of the Protein Data Bank Europe (PDBe). Tyrosine residues (Y) were nitrated (3-NT), whereas histidine (H), glutamine (Q) and asparagine (N) were MDA modified. (GI) The actin monomer model illustrating that the oxidative hotspots in patients with RA (green) coincide with hotspots in mice with arthritis (pink). Amino acids depicted in red ribbons represent the residues that had the identical modification on actin in RA patients and CFA mice (5 out of 11). Generated with UCSF Chimera (82). Statistical analysis was performed using 2-tailed Student’s t test. A P value less than 0.05 was considered significant. *P < 0.05.
Figure 6
Figure 6. Altered filament stability, intersubdomain interactions, and myosin interaction with oxidative modifications on actin.
Analysis of molecular dynamics (MD) simulations calculated from trajectories of four 100-ns MD simulations of ATP-bound F-actin. (A) Root mean square fluctuation (RMSF) values of the Cα atoms (black line with gray shadow showing the standard deviation). RMSF values are averages of 2-ns blocks, calculated for the last 60 ns of the simulation time for the four 100-ns simulations. Residues exposed to modifications are pointed out in the sequence by their respective amino acid abbreviation and color coded according to its domain. (B) Solvent-accessible surface area (SASA), with SD shown as error bars. (C) F-actin (PDBe: 5MVA) with 4 G-actin monomers (A1–A4) envisioned in light to dark shade of blue. Histidine (H) 40, glutamine (Q) 41, Q246, and Q360 in red spheres showing their intricate location for inter- and intramolecular bonding. (D) Number of H-bonds and (E) contacts between oxidized hotspot residues and the rest of the actin protein. A contact was defined as when the distance was less than 4 Å between 2 non-hydrogen atoms. Values are averages with error estimates from block averaging in parentheses. (F) A model of a fragment of F-actin (A1–A3) (PDBe: 5H53) with malondialdehyde (MDA) added to the residues. (G and H) Hotspot 2 with and without the presence of modifications on tyrosine (Y) 294 and asparagine (N) 297.

References

    1. van Vilsteren M, et al. Productivity at work and quality of life in patients with rheumatoid arthritis. BMC Musculoskelet Disord. 2015;16:107. - PMC - PubMed
    1. Fraser A, Vallow J, Preston A, Cooper RG. Predicting ‘normal’ grip strength for rheumatoid arthritis patients. Rheumatology (Oxford) 1999;38(6):521–528. doi: 10.1093/rheumatology/38.6.521. - DOI - PubMed
    1. Sokka T, et al. Physical inactivity in patients with rheumatoid arthritis: data from twenty-one countries in a cross-sectional, international study. Arthritis Rheum. 2008;59(1):42–50. doi: 10.1002/art.23255. - DOI - PubMed
    1. Helliwell PS, Jackson S. Relationship between weakness and muscle wasting in rheumatoid arthritis. Ann Rheum Dis. 1994;53(11):726–728. doi: 10.1136/ard.53.11.726. - DOI - PMC - PubMed
    1. de Palma L, Chillemi C, Albanelli S, Rapali S, Bertoni-Freddari C. Muscle involvement in rheumatoid arthritis: an ultrastructural study. Ultrastruct Pathol. 2000;24(3):151–156. doi: 10.1080/01913120050132886. - DOI - PubMed

Publication types

MeSH terms