Review
. 2017 Oct 19;3(4):37.
doi: 10.3390/gels3040037.

Properties of Water Bound in Hydrogels

Affiliations
Review

Properties of Water Bound in Hydrogels

Vladimir M Gun'ko et al. Gels. .

Abstract

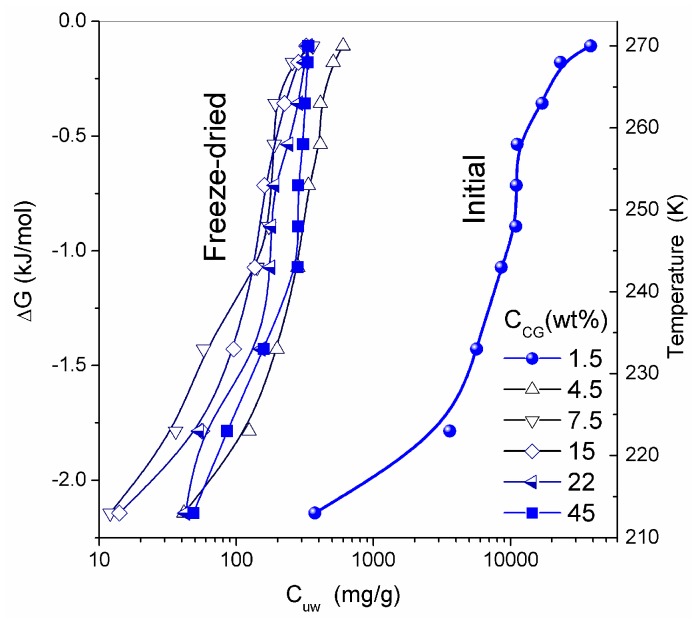
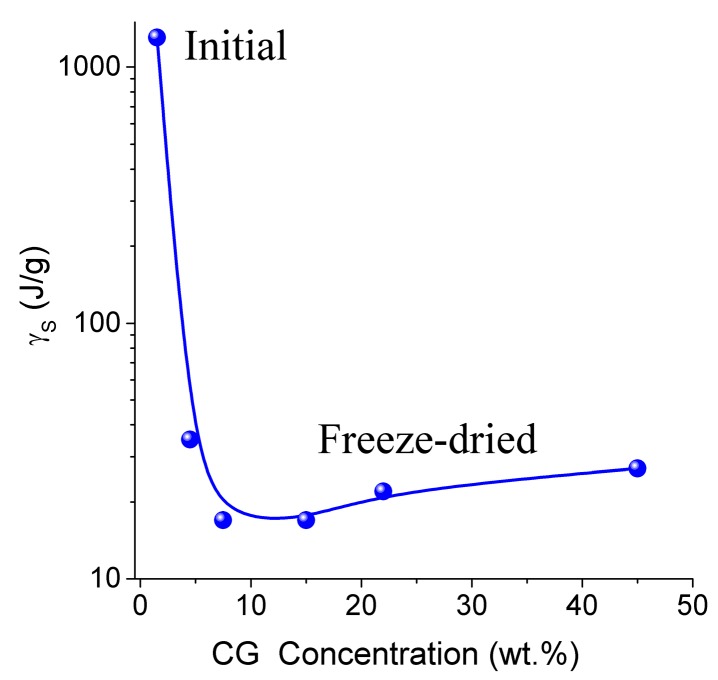
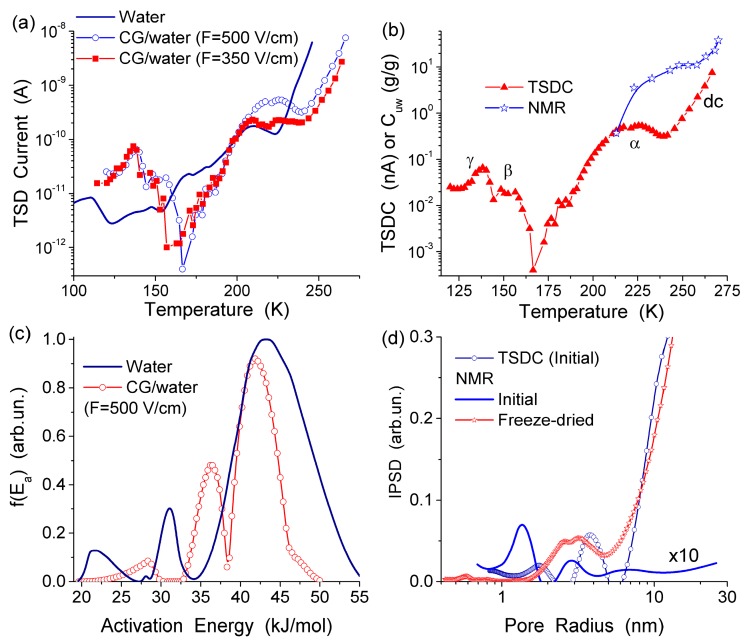
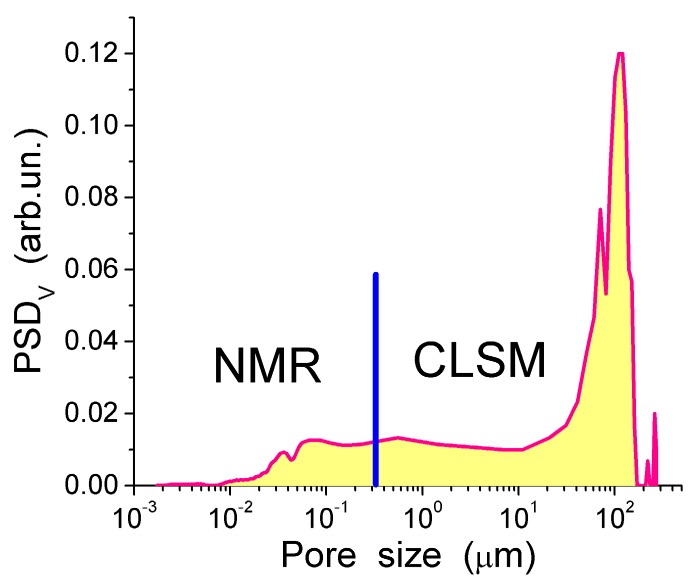
In this review, the importance of water in hydrogel (HG) properties and structure is analyzed. A variety of methods such as ¹H NMR (nuclear magnetic resonance), DSC (differential scanning calorimetry), XRD (X-ray powder diffraction), dielectric relaxation spectroscopy, thermally stimulated depolarization current, quasi-elastic neutron scattering, rheometry, diffusion, adsorption, infrared spectroscopy are used to study water in HG. The state of HG water is rather non-uniform. According to thermodynamic features of water in HG, some of it is non-freezing and strongly bound, another fraction is freezing and weakly bound, and the third fraction is non-bound, free water freezing at 0 °C. According to structural features of water in HG, it can be divided into two fractions with strongly associated and weakly associated waters. The properties of the water in HG depend also on the amounts and types of solutes, pH, salinity, structural features of HG functionalities.

Keywords: cryogels; freezing-melting point depression; hydrogels; interfacial phenomena; strongly and weakly associated water; strongly and weakly bound water.


Conflict of interest statement

The authors declare no conflict of interest.

Figures

Figure 1
Figure 1
Confocal laser scanning microscopy (CLSM) images of HEMA-AGE hydrogel (sample A) in (a) hydrated and (b) dried states (scale bar 150 μm) with the pore (c) size and (d) wall thickness distributions (reproduced from Ref. [47] with permission from The Royal Society of Chemistry).
Figure 2
Figure 2
Wall thickness distributions with (a) Fiji and (b) ImageJ, and (c) pore size distributions for HEMA-AGE HG A, B, C and D (Table 1) (reproduced from Ref. [47] with permission from The Royal Society of Chemistry).
Figure 3
Figure 3
PSDs calculated from the DSC data for HEMA-AGE (A, B, C, and D samples) and G gels (hydration h = mw/md where mw is the weight of water evaporated in DSC measurements up to 160 °C and md is the residual weight of heated sample) at (a) high and (b,c) low hydration (reproduced from Ref. [47] with permission from The Royal Society of Chemistry).
Figure 4
Figure 4
1H NMR spectra, of water adsorbed by gelatin gel recorded at different temperatures: (a) initial freeze-dried (0.3 wt % H2O) in CDCl3 (solid lines) and in a mixture CDCCl3:CD3CN 3:1 at (a, dashed-dotted lines) 0.8 wt % and (b) 10 wt % of water. Signal at 0 ppm corresponds to tetramethylsilane added as a standard; signal at 7.2 ppm corresponds to residual CHCl3 (reproduced from Ref. [47] with permission from The Royal Society of Chemistry).
Figure 5
Figure 5
1H NMR spectra, recorded at different temperatures, of water bound in gelatin gel at hydration h = 1 g per gram of dried gelatin in different media: (a) air (solid lines) and C6D6:CD3CN = 6:1 (dashed-dotted lines), (b) C6D6 (solid lines) and CDCl3:CD3CN = 3:1 (dashed-dotted lines) (reproduced from Ref. [47] with permission from The Royal Society of Chemistry).
Figure 6
Figure 6
(a) Amount of unfrozen water (Cuw) as a function of temperature; (b) derivative dCuw/d (ΔG), and (c) pore size distribution (NMR cryoporometry) for G gel in different media (reproduced from Ref. [47] with permission from The Royal Society of Chemistry).
Figure 7
Figure 7
Theoretical 1H NMR spectra of water bound to models of partially hydrated gels with cross-linked HEMA-AGE (2373 atoms) with 1192 H2O, collagen (two triple coils (1639 atoms) and 1032 H2O) and fibronectin (8–9 Fn)—collagen (3200 atoms) with 827 H2O (geometry optimized with PM6 method).
Figure 8
Figure 8
Chemical shifts of water molecules in clusters: pure (curves 1, 2, and 4), with dissolved NaCl (curve 3) and bound to PVA fragments cross-linked by glutaraldehyde (curve 5). Computational models are based on calculations using PM6 and PM7 methods and correlation functions based on DFT and PM6 or PM7 calculations of the same water clusters (adapted from [13]).
Figure 9
Figure 9
Amount of unfrozen water (Cuw) as a function of temperature; and changes in the Gibbs free energy of interfacial water versus Cuw at different concentrations of collagen in the hydrogel (adapted from [76] with permission, Copyright 2006, Elsevier).
Figure 10
Figure 10
The free surface energy as a function of the collagen concentration in the CG hydrogel (adapted from [76] with permission, Copyright 2006, Elsevier).
Figure 11
Figure 11
(a) Temperature dependence of the TSD current for the initial collagen hydrogel and “free” (bulk) water; (b) temperature dependences of the TSD current and the amounts of unfrozen water (Cuw) (NMR) for initial collagen HG (98.5 wt % of water) (c) distribution function of the activation energy of relaxation in these systems; and (d) incremental pore size distributions for the initial CG HG calculated on the basis of 1H NMR and TSDC data (adapted from [76] with permission, Copyright 2006, Elsevier).
Figure 12
Figure 12
Pore size distribution calculated using 1H NMR cryoporometry and CLSM methods (reproduced from Ref. [44] with permission from The Royal Society of Chemistry).
Figure 13
Figure 13
Diffusion kinetics through a collagen HG membrane (~1 mm in thickness) for (a) BPTI. Curve 1 is for an initial concentration of 1.23 mg/mL in the feeder cell (OD280 = 0.09), curves 2–4 are for an initial concentration of 2.46 mg/mL (OD280 = 0.18); curve 2—BPTI run after the first BPTI run; curve 3—BPTI run after Fg; curve 4—BPTI run after Fg and BSA; (c) BSA and BSA (with twice concentration) after the first BSA run, (e) Fg (initial concentration 1.7 mg/mL); curves (b,d,f) show the corresponding distribution functions of the diffusion coefficient f(D) for (b) BPTI, (d) BSA, and (f) Fg (reproduced from Ref. [44] with permission from The Royal Society of Chemistry).
Figure 14
Figure 14
Changes in frequency (1) and auto-gain controller voltage (2) on two injections (A and B) of 0.1 mL aliquot of 3T3 fibroblast suspension (2.0 × 10⁶ cell mL−1) upon an unsupported section of CG HG laid the surface of a 10 MHz gold coated crystal. Flow injection rate 0.01 mL min−1, 37 ± 0.1 °C, pH 7.2, PBS (reproduced from Ref. [44] with permission from The Royal Society of Chemistry).
Figure 15
Figure 15
1H NMR spectra of water bound to (ac) CM1 and (c) CM2 (dot-dashed lines) at hydration h = 2.3 wt % in different media: (a) air (solid lines) CDCl3 (dot-dashed lines), (b) CD3CN (solid lines) CD3CN:CDCl3 = 1:2.6 (dot-dashed lines), (c) CD3CN:CDCl3 = 1:5.
Figure 16
Figure 16
Temperature dependence of the amount of (a) SAW and (b) WAW and the relationships between changes in the Gibbs free energy and the amounts of SAW and WAW in HA/A-300 composites CM1 and CM2 (*).
Figure 17
Figure 17
1H NMR spectra of CM1 with adsorbed aqueous solutions (150 mg/g) of (a) 18% HCl and (b) 16% H2O2 in CDCl3 medium.
Figure 18
Figure 18
(a,c,e) Relationships between the amounts of unfrozen water and changes in the Gibbs free energy and (b,d,f) the corresponding PSD (NMR cryoporometry with GT equation at kGT = 67 K nm) for (a,b) MCC, (c,d) MCC/A-300 (5.6:1), and MCC/TiO2 (3:1) (adapted from [13]).
Figure 19
Figure 19
PSD (kGT = 70 K nm) for A-300/PVP systems (adapted from [13]).

References

    1. Jayakumar R., Menon D., Manzoor K., Nair S.V., Tamura H. Biomedical applications of chitin and chitosan based nanomaterials—A short review. Carbohydr. Polym. 2010;82:227–232. doi: 10.1016/j.carbpol.2010.04.074. - DOI
    1. Jayakumar R., Prabaharan M., Nair S.V., Tamura H. Novel chitin and chitosan nanofibers in biomedical applications. Biotechnol. Adv. 2010;28:142–150. doi: 10.1016/j.biotechadv.2009.11.001. - DOI - PubMed
    1. Zhang Y.-F., Yin P., Zhao X.-Q., Wang J., Wang C.D., Ren L., Zhang Q.Q. O-Carboxymethyl-chitosan/organosilica hybrid nanoparticles as non-viral vectors for gene delivery. Mater. Sci. Eng. C. 2009;29:2045–2049. doi: 10.1016/j.msec.2009.04.003. - DOI
    1. Long Y.-Z., Li M.-M., Gu C., Wan M., Duvail J.-L., Liu Z., Fan Z. Recent advances in synthesis, physical properties and applications of conducting polymer nanotubes and nanofibers. Prog. Polym. Sci. 2011;36:1415–1442. doi: 10.1016/j.progpolymsci.2011.04.001. - DOI
    1. Karoyo A.H., Wilson L.D. Physicochemical properties and the gelation process of supramolecular hydrogels: A review. Gels. 2017;3:1. doi: 10.3390/gels3010001. - DOI - PMC - PubMed

LinkOut - more resources