

Increased lipid and lipoprotein concentrations in anorexia nervosa: A systematic review and meta-analysis
- PMID: 30920679
- PMCID: PMC6842568
- DOI: 10.1002/eat.23051
Increased lipid and lipoprotein concentrations in anorexia nervosa: A systematic review and meta-analysis
Abstract
Objective: Alterations in blood lipid concentrations in anorexia nervosa (AN) have been reported; however, the extent, mechanism, and normalization with weight restoration remain unknown. We conducted a systematic review and a meta-analysis to evaluate changes in lipid concentrations in acutely-ill AN patients compared with healthy controls (HC) and to examine the effect of partial weight restoration.
Method: A systematic literature review and meta-analysis (PROSPERO: CRD42017078014) were conducted for original peer-reviewed articles.
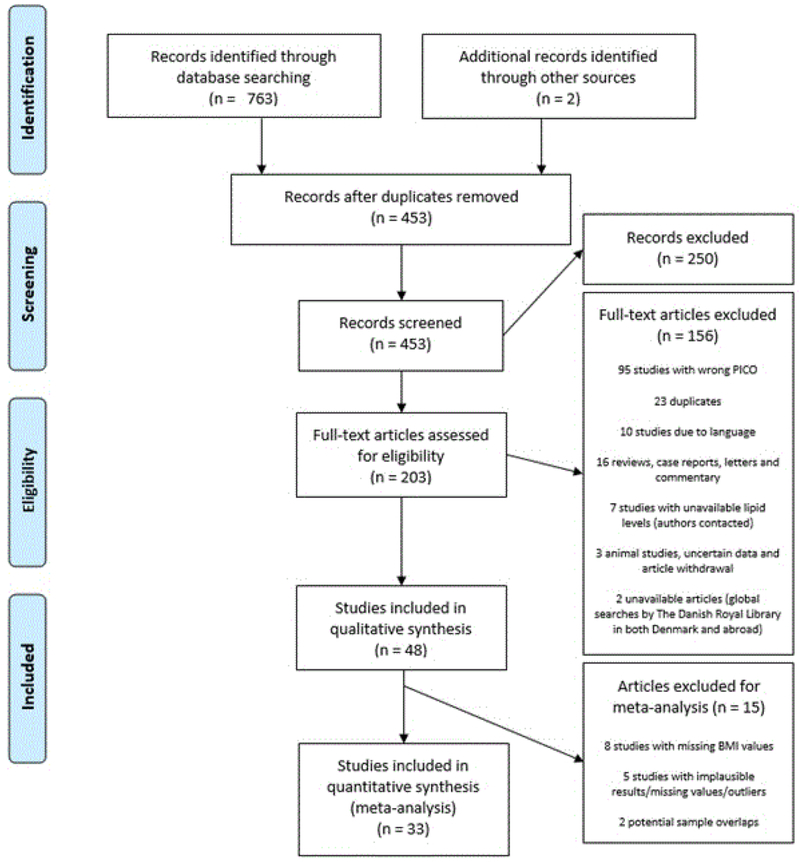
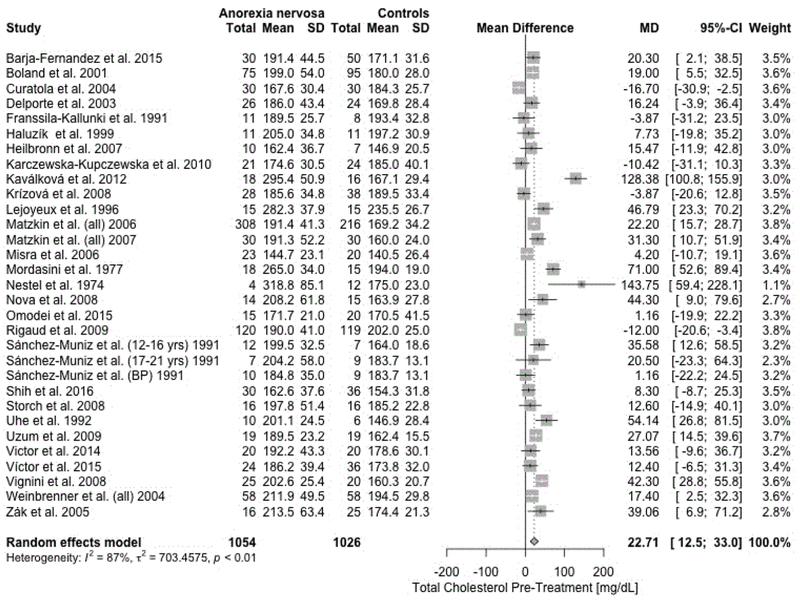
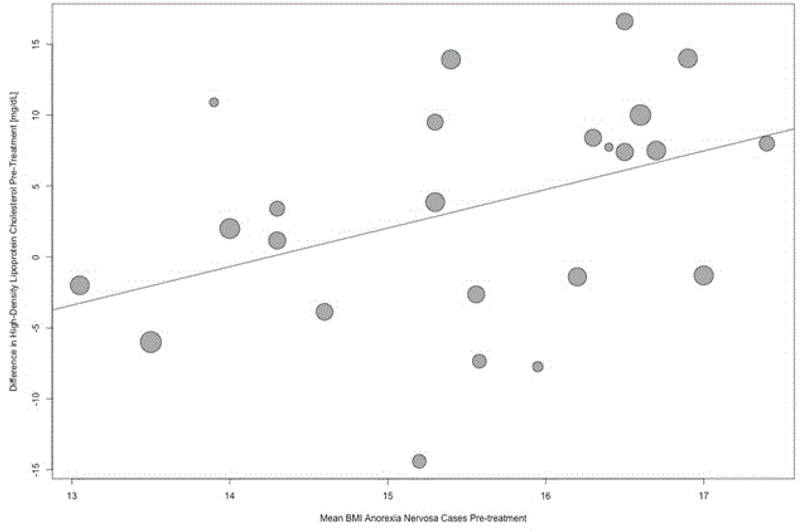
Results: Forty-eight studies were eligible for review; 33 for meta-analyses calculating mean differences (MD). Total cholesterol (MD = 22.7 mg/dL, 95% CI = 12.5, 33.0), high-density lipoprotein (HDL; MD = 3.4 mg/dL, CI = 0.3, 7.0), low-density lipoprotein (LDL; MD = 12.2 mg/dL, CI = 4.4, 20.1), triglycerides (TG; MD = 8.1 mg/dL, CI = 1.7, 14.5), and apolipoprotein B (Apo B; MD = 11.8 mg/dL, CI = 2.3, 21.2) were significantly higher in acutely-ill AN than HC. Partially weight-restored AN patients had higher total cholesterol (MD = 14.8 mg/dL, CI = 2.1, 27.5) and LDL (MD = 16.1 mg/dL, CI = 2.3, 30.0). Pre- versus post-weight restoration differences in lipid concentrations did not differ significantly.
Discussion: We report aggregate evidence for elevated lipid concentrations in acutely-ill AN patients compared with HC, some of which persist after partial weight restoration. This could signal an underlying adaptation or dysregulation not fully reversed by weight restoration. Although concentrations differed between AN and HC, most lipid concentrations remained within the reference range and meta-analyses were limited by the number of available studies.
Objetivo: En la anorexia nervosa (AN) han sido reportadas alteraciones en las concentraciones de lípidos sanguíneos; sin embargo, la extensión, mecanismo y normalización con la restauración del peso continúa aún desconocida. Hicimos una revisión sistemática y meta-análisis para evaluar los cambios en las concentraciones de lípidos en pacientes agudamente enfermas de AN comparados con controles sanos (HC) y para examinar el efecto parcial de la restauración de peso. MÉTODO: Una revisión sistemática de la literatura y meta-análisis (PROSPERO: CRD42017078014) fueron llevados a cabo en artículos originales revisados por pares.
Resultados: Un total de cuarenta y ocho estudios fueron elegibles para revisión; 33 para meta-análisis calculando las diferencias promedio (MD). Colesterol total (MD = 22.7 mg/dL, 95% CI = 12.5, 33.0), lipoproteína de alta densidad (HDL; MD = 3.4 mg/dL, CI = 0.3, 7.0), lipoproteína de baja densidad (LDL; MD = 12.2 mg/dL, CI = 4.4, 20.1), triglicéridos (TG; MD = 8.1 mg/dL, CI = 1.7, 14.5), y apolipoproteína B (Apo B; MD = 11.6 mg/dL, CI = 2.3, 21.2) fueron significativamente elevados en los pacientes agudamente enfermos de AN en comparación con los controles sanos (HC). Los pacientes con AN parcialmente recuperados de peso tuvieron niveles más elevados de colesterol total (MD = 14.8 mg/dL, CI = 2.1, 27.5) y de LDL (MD = 16.1 mg/dL, CI = 2.3, 30.0). Las diferencias pre- versus post- restauración de peso en las concentraciones de lípidos no difirieron significativamente. DISCUSIÓN: Reportamos evidencia agregada de concentraciones elevadas de lípidos en pacientes agudamente enfermos de AN comparados con controles sanos (HC), algunos de los cuales persisten después de la restauración parcial de peso. Esto podría señalar una adaptación subyacente o desregulación no completamente revertida por la restauración del peso. Aunque las concentraciones difirieron entre AN y HC, la mayoría de las concentraciones de lípidos permanecieron dentro del rango de referencia y los meta-análisis fueron limitados por el número de estudios disponibles.
Keywords: cholesterol; eating disorder; lipids; re-nutrition; weight restoration.
© 2019 Wiley Periodicals, Inc.
Figures
References
-
- American Psychiatric Association; (1980). Diagnostic and statistical manual of mental disorders (DSM-III) (3rd ed.).
-
- American Psychiatric Association; (1987). Diagnostic and statistical manual of mental disorders (DSM-III-R) (3rd ed.).
-
- American Psychiatric Association; (1994). Diagnostic and statistical manual of mental disorders (DSM-IV) (4th ed.). Washington, DC.
-
- American Psychiatric Association; (2000). Diagnostic and statistical manual of mental disorders (DSM-IV-TR) (4th ed., Text Revision; ed.). Washington, DC.
Publication types
MeSH terms
Substances
Grants and funding
LinkOut - more resources
Full Text Sources
Miscellaneous
