

Macular Ganglion Cell and Inner Plexiform Layer Thickness Is More Strongly Associated With Visual Function in Multiple Sclerosis Than Bruch Membrane Opening-Minimum Rim Width or Peripapillary Retinal Nerve Fiber Layer Thicknesses
- PMID: 30921169
- PMCID: PMC6763365
- DOI: 10.1097/WNO.0000000000000768
Macular Ganglion Cell and Inner Plexiform Layer Thickness Is More Strongly Associated With Visual Function in Multiple Sclerosis Than Bruch Membrane Opening-Minimum Rim Width or Peripapillary Retinal Nerve Fiber Layer Thicknesses
Abstract
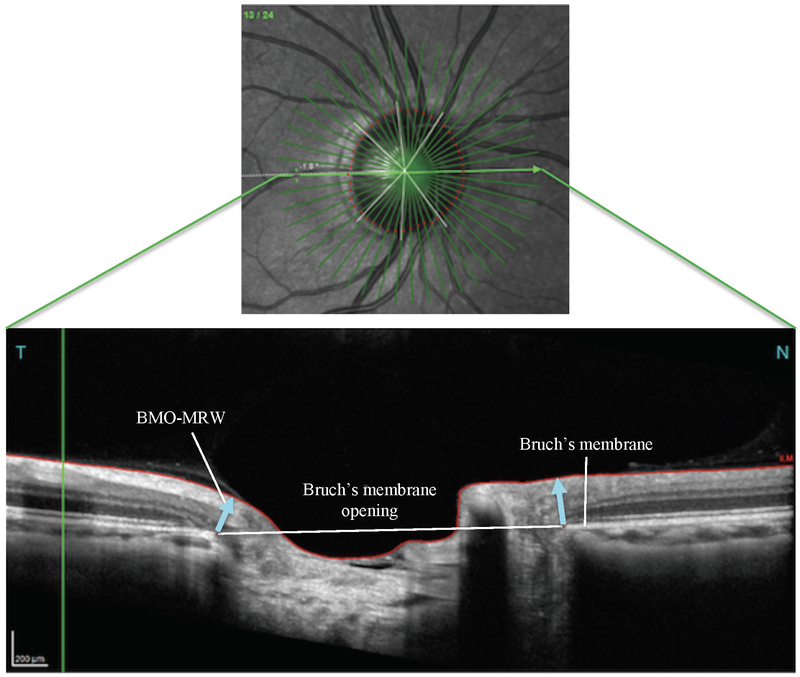
Background: Optical coherence tomography (OCT) measurements of ganglion cell + inner plexiform layer (GCIPL) and peripapillary retinal nerve fiber layer (pRNFL) thicknesses are associated with visual function (VF) and disability in multiple sclerosis (MS). However, the value of measuring Bruch membrane opening-minimum rim width (BMO-MRW) thickness in MS remains unclear.
Methods: Sixty-eight patients with MS and 22 healthy controls (HCs) underwent spectral domain OCT, 100%-contrast visual acuity (VA), 2.5%- and 1.25%-contrast letter acuity (LA), and Expanded Disability Status Scale (EDSS) testing. Mixed-effects linear regression models, accounting for within-subject, intereye correlations, were used to assess relationships.
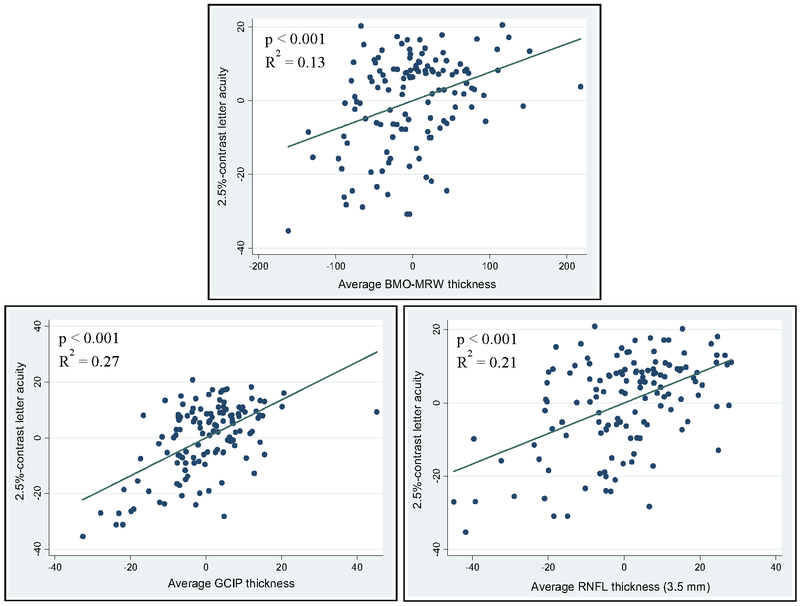
Results: The MS cohort exhibited significantly lower BMO-MRW (P = 0.01), pRNFL at 3.7-, 4.1-, and 4.7-mm diameters surrounding the optic disc (P < 0.001 for all), and GCIPL (P < 0.001) thicknesses than HCs. BMO-MRW thickness was associated with 100%-VA (P < 0.001, R = 0.08), 2.5%-LA (P < 0.001; R = 0.13), and 1.25%-LA (P = 0.002; R = 0.11). All measured pRNFL thicknesses were associated with high- and low-contrast VF (all: P < 0.001). GCIPL thickness was more strongly associated with 100%-VA (P < 0.001; R = 0.23), 2.5%-LA (P < 0.001; R = 0.27), and 1.25%-LA (P < 0.001; R = 0.21) than the other OCT measures assessed. All OCT measures were significantly, but weakly, associated with EDSS scores.
Conclusions: BMO-MRW and pRNFL thicknesses are reduced and associated with VF and disability in MS, but GCIPL thickness is a stronger marker of visual impairment. Our findings corroborate the utility of OCT in providing valuable information regarding the MS disease process.
Conflict of interest statement
DECLARATION OF CONFLICTS OF INTEREST
The authors declare that there is no conflict of interest.
Figures
References
-
- Kappos L, Moeri D, Radue EW, Schoetzau A, Schweikert K, Barkhof F, Miller D, Guttmann CR, Weiner HL, Gasperini C, Filippi M. Predictive value of gadolinium-enhanced magnetic resonance imaging for relapse rate and changes in disability or impairment in multiple sclerosis: a meta-analysis. Gadolinium MRI Meta-analysis Group. Lancet. 1999; 353:964–969. - PubMed
-
- Syc SB, Warner CV, Hiremath GS, Farrell SK, Ratchford JN, Conger A, Frohman T, Cutter G, Balcer LJ, Frohman EM, Calabresi PA. Reproducibility of high-resolution optical coherence tomography in multiple sclerosis. Mult Scler 2010; 16:829–839. - PubMed
-
- Saidha S, Syc BS, Durbin MK, Eckstein C, Oakley JD, Meyer SA, Conger A, Frohman TC, Newsome S, Ratchford JN, Frohman EM, Calabresi PA. Visual dysfunction in multiple sclerosis correlates better with optical coherence tomography derived estimates of macular ganglion cell layer thickness than peripapillary retinal nerve fiber layer thickness. Mult Scler 2011; 17:1449–1463. - PubMed
-
- Saidha, Al-Louzi O, Ratchford JN, Bhargava P, Oh J, Newsome SD, Prince JL, Pham D, Roy S, van Zijl P, Balcer LJ, Frohman EM, Reich DS, Crainiceanu C, Calabresi PA. Optical coherence tomography reflects brain atrophy in multiple sclerosis: a four-year study. Ann Neurol 2016; 78:801–813. - PMC - PubMed
Publication types
MeSH terms
Grants and funding
LinkOut - more resources
Full Text Sources
Medical
