. 2019 Mar 28;14(3):e0212868.
doi: 10.1371/journal.pone.0212868. eCollection 2019.

A theoretical analysis of single molecule protein sequencing via weak binding spectra

Affiliations

A theoretical analysis of single molecule protein sequencing via weak binding spectra

Samuel G Rodriques et al. PLoS One. .

Abstract

We propose and theoretically study an approach to massively parallel single molecule peptide sequencing, based on single molecule measurement of the kinetics of probe binding (Havranek, et al., 2013) to the N-termini of immobilized peptides. Unlike previous proposals, this method is robust to both weak and non-specific probe-target affinities, which we demonstrate by applying the method to a range of randomized affinity matrices consisting of relatively low-quality binders. This suggests a novel principle for proteomic measurement whereby highly non-optimized sets of low-affinity binders could be applicable for protein sequencing, thus shifting the burden of amino acid identification from biomolecular design to readout. Measurement of probe occupancy times, or of time-averaged fluorescence, should allow high-accuracy determination of N-terminal amino acid identity for realistic probe sets. The time-averaged fluorescence method scales well to weakly-binding probes with dissociation constants of tens or hundreds of micromolar, and bypasses photobleaching limitations associated with other fluorescence-based approaches to protein sequencing. We argue that this method could lead to an approach with single amino acid resolution and the ability to distinguish many canonical and modified amino acids, even using highly non-optimized probe sets. This readout method should expand the design space for single molecule peptide sequencing by removing constraints on the properties of the fluorescent binding probes.


Conflict of interest statement

The authors have declared that no competing interests exist.

Figures
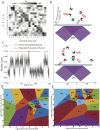
Fig 1
Fig 1. Identifying amino acids from kinetic measurements.
A Example affinity matrix for a set of NAABs. The affinities of each of the 17 NAABs are shown for all 19 amino acids excluding cysteine, which is used to anchor the peptides to the surface. Reproduced from [1]. B In the proposed measurement scheme, the target (green disk) is attached to a glass slide and is observed using TIRF microscopy. NAAB binders (brown clefts) bearing fluorophores (red dots) are excited by a TIRF beam (purple) and generate fluorescent photon emissions (red waves). C When a fluorophore is bound, there is an increase in fluorescence in the spot containing the target. Photobleaching of the fluorophore is indistinguishable from unbinding events, so it is important to use a dye that is robust against photobleaching. Plot shows an illustrative stochastic kinetics simulation incorporating Poisson shot noise of photon emission. A relatively strong binder is shown solely for purposes of illustration. In practice, the method relies on many measurements performed on weak binders. D The plot shows the result of a proposed kinetic measurement on an N-terminal amino acid using only two NAABs. The affinity of each N-terminal amino acid (black Xs, excluding cysteine) for the methionine-targeting and tryptophan-targeting NAABs are shown as a scatterplot, with the affinity for the met-targeting NAAB on the x axis and the affinity for the Trp-targeting NAAB on the y axis. Upon measuring the affinities for these NAABs against an unknown target undergoing sequencing, the unknown target can be identified with the amino acid with expected vector of affinities closest in the two-dimensional Euclidean space (higher-dimensional in a full experiment) to the measured affinity. The colored regions correspond to the regions within which a measured multi-NAAB affinity vector would be assigned to a given amino acid. As an example, a pair of measurements yielding the white star in D would identify the target as glycine. E The affinities of the glutamine and lysine targeting NAABs are shown for each of the amino acids. Some amino acids that are practically indistinguishable using the Met and Trp NAABs are easily distinguished using the Gln and Lys NAABs. As an example, if the same target amino acid described in D were measured with only the Gln and Lys NAABs, yielding the white star, we would identify the target as proline. However, combining these measurements with those for the white star in D with Met and Trp NAABs, we see that the true identity of the target is serine. Thus, the higher dimensional measurement of the amino acid using many different NAABs allows disambiguation of the amino acid identity.
Fig 2
Fig 2. Two types of affinity measurements using TIRF microscopy.
A A measurement performed using the proposed scheme yields a fluorescence intensity trace where periods of high intensity correspond to the target being bound and periods of low intensity correspond to the target being free. The affinity of a binder against the target may then be determined in two ways, either via occupancy measurements or via luminosity measurements. B An occupancy measurement is performed “along the time axis,” by calculating kon from the average time between binding events, and koff from the average length of binding events. C On the other hand, a luminosity measurement is performed “along the brightness axis,” by calculating kD directly from the average luminosity of the target over the whole observation period. D We validated our simulation by applying occupancy measurements to determine kon and koff from simulated data. The parameters used here were identical to those used in the production of Fig 2a in [23]. See text for symbol definitions.
Fig 3
Fig 3. Two types of affinity measurements using TIRF microscopy.
A The accuracies of occupation measurements of kD are shown as a function of kD and kon for the simulation described in the text, with Texp = 100 s. These measurements achieve high accuracy for kon ≥ 104 m−1 s−1 and koff ≪ 100 s−1. For values of koff on the order of 100 s−1 (upper right-hand corner), the accuracy deteriorates significantly. B The accuracies of luminosity measurements of kD are shown as a function of kD and kon. These measurements achieve high accuracy for kon ≥ 105 m−1 s−1 and kD ≥ 100 nm. The heat map shown gives the fractional errors as a function of kD and kon for the simulation described in the text, with Texp = 100 s. In contrast to occupation measurements, the accuracy of luminosity measurements does not deteriorate for very high values of koff. C For luminosity measurements only, the mean fractional error in the measured value of kD is plotted as a function of the observation time for five different values of kD. The line y = 1/x is plotted as a guide to the eye. For kD = 10 nm and kD = 100 nm, the effects of photobleaching are evident at longer runtimes. D Also, for luminosity measurements only, the measured value of kD is plotted as a function of the actual value of kD for 8 different values of the runtime. The performance of the algorithm improves dramatically for τobs > 25 s. The line y = x is plotted as a guide to the eye. Error bars in C, D denote standard error over 100 trials.
Fig 4
Fig 4. Identification of amino acids is robust against systematic error.
The fraction of amino acids incorrectly identified is plotted as a function of τobs for four different values of the systematic calibration error σC and four different values of the systematic kinetic error σK (as described in the text). A In the absence of systematic error, measurements with τobs = 50 s result in correct amino acid identification more than 98% of the time. For 25% error in kD, the accuracy drops to 97.5%, and if 5% calibration error is added, it drops further to 92%. More than 5% systematic error in the calibration leads to very significant numbers of mistakes in amino acid identification. B With τobs = 100 s, an accuracy of 97.5% was obtained for 25% error in kD and 5% error in the calibration. Axes for B, C, and D are the same as in A. C Increasing τobs beyond 100 s at the same binder concentration leads to diminishing improvements in the accuracy. D The sensitivity to calibration error could be substantially reduced by decreasing the concentration of free binders to 100 nM. However, this decreased concentration necessitates a longer runtime. E For τobs = 100 s, plots are shown for each value of σC and σK, depicting the probability that a given target amino acid (on the horizontal axis) was assigned a particular identity (on the vertical axis). Off-diagonal elements correspond to errors.
Fig 5
Fig 5. Overall error rates for 100 random affinity matrices.
A histogram of the overall error rate, calculated as the sum of incorrect residue calls divided by the total number of residue calls over 10000 trials, is plotted for 100 random affinity matrices.
Fig 6
Fig 6. Accuracies for amino acid calling obtained for 100 random affinity matrices in simulations.
100 random affinity matrices were generated by randomly shuffling the entries of the NAAB affinity matrix. For each resulting matrix, we simulated 10000 amino acid calls, with 5% calibration error and 0.25% kinetic error. The resulting accuracy matrices are presented here. The scale and axes for each matrix are identical to those in Fig 4E.

Similar articles

Cited by

  • Single-molecule fluorescence methods for protein biomarker analysis.
    He H, Wu C, Saqib M, Hao R. He H, et al. Anal Bioanal Chem. 2023 Jul;415(18):3655-3669. doi: 10.1007/s00216-022-04502-9. Epub 2023 Jan 7. Anal Bioanal Chem. 2023. PMID: 36609860 Review.
  • Protein Sequencing, One Molecule at a Time.
    Floyd BM, Marcotte EM. Floyd BM, et al. Annu Rev Biophys. 2022 May 9;51:181-200. doi: 10.1146/annurev-biophys-102121-103615. Epub 2022 Jan 5. Annu Rev Biophys. 2022. PMID: 34985940 Free PMC article. Review.
  • Full-length single-molecule protein fingerprinting.
    Filius M, van Wee R, de Lannoy C, Westerlaken I, Li Z, Kim SH, de Agrela Pinto C, Wu Y, Boons GJ, Pabst M, de Ridder D, Joo C. Filius M, et al. Nat Nanotechnol. 2024 May;19(5):652-659. doi: 10.1038/s41565-023-01598-7. Epub 2024 Feb 13. Nat Nanotechnol. 2024. PMID: 38351230
  • Computational assessment of the feasibility of protonation-based protein sequencing.
    Miclotte G, Martens K, Fostier J. Miclotte G, et al. PLoS One. 2020 Sep 11;15(9):e0238625. doi: 10.1371/journal.pone.0238625. eCollection 2020. PLoS One. 2020. PMID: 32915813 Free PMC article.
  • The emerging landscape of single-molecule protein sequencing technologies.
    Alfaro JA, Bohländer P, Dai M, Filius M, Howard CJ, van Kooten XF, Ohayon S, Pomorski A, Schmid S, Aksimentiev A, Anslyn EV, Bedran G, Cao C, Chinappi M, Coyaud E, Dekker C, Dittmar G, Drachman N, Eelkema R, Goodlett D, Hentz S, Kalathiya U, Kelleher NL, Kelly RT, Kelman Z, Kim SH, Kuster B, Rodriguez-Larrea D, Lindsay S, Maglia G, Marcotte EM, Marino JP, Masselon C, Mayer M, Samaras P, Sarthak K, Sepiashvili L, Stein D, Wanunu M, Wilhelm M, Yin P, Meller A, Joo C. Alfaro JA, et al. Nat Methods. 2021 Jun;18(6):604-617. doi: 10.1038/s41592-021-01143-1. Epub 2021 Jun 7. Nat Methods. 2021. PMID: 34099939 Free PMC article. Review.

References

    1. Havranek JJ, Borgo B, inventors; Washington University in St Louis, assignee. Molecules and methods for iterative polypeptide analysis and processing. US20140273004A1; 2013. Available from: https://patents.google.com/patent/US20140273004A1/en.
    1. Shendure J, Mitra RD, Varma C, Church GM. Advanced sequencing technologies: methods and goals. Nature Reviews Genetics. 2004;5(5):335–344. 10.1038/nrg1325 - DOI - PubMed
    1. Shendure J, Aiden EL. The expanding scope of DNA sequencing. Nature biotechnology. 2012;30(11):1084–1094. 10.1038/nbt.2421 - DOI - PMC - PubMed
    1. Bentley DR, Balasubramanian S, Swerdlow HP, Smith GP, Milton J, Brown CG, et al. Accurate whole human genome sequencing using reversible terminator chemistry. Nature. 2008;456(7218):53–59. 10.1038/nature07517 - DOI - PMC - PubMed
    1. Brenner S, Johnson M, Bridgham J, Golda G, Lloyd DH, Johnson D, et al. Gene expression analysis by massively parallel signature sequencing (MPSS) on microbead arrays. Nature biotechnology. 2000;18(6):630–634. 10.1038/76469 - DOI - PubMed

Publication types