

Tensor-valued diffusion encoding for diffusional variance decomposition (DIVIDE): Technical feasibility in clinical MRI systems
- PMID: 30921381
- PMCID: PMC6438503
- DOI: 10.1371/journal.pone.0214238
Tensor-valued diffusion encoding for diffusional variance decomposition (DIVIDE): Technical feasibility in clinical MRI systems
Abstract
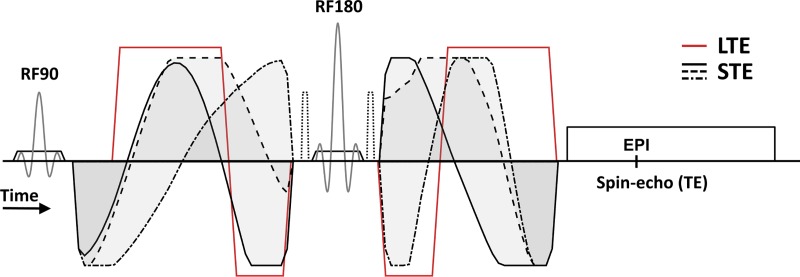
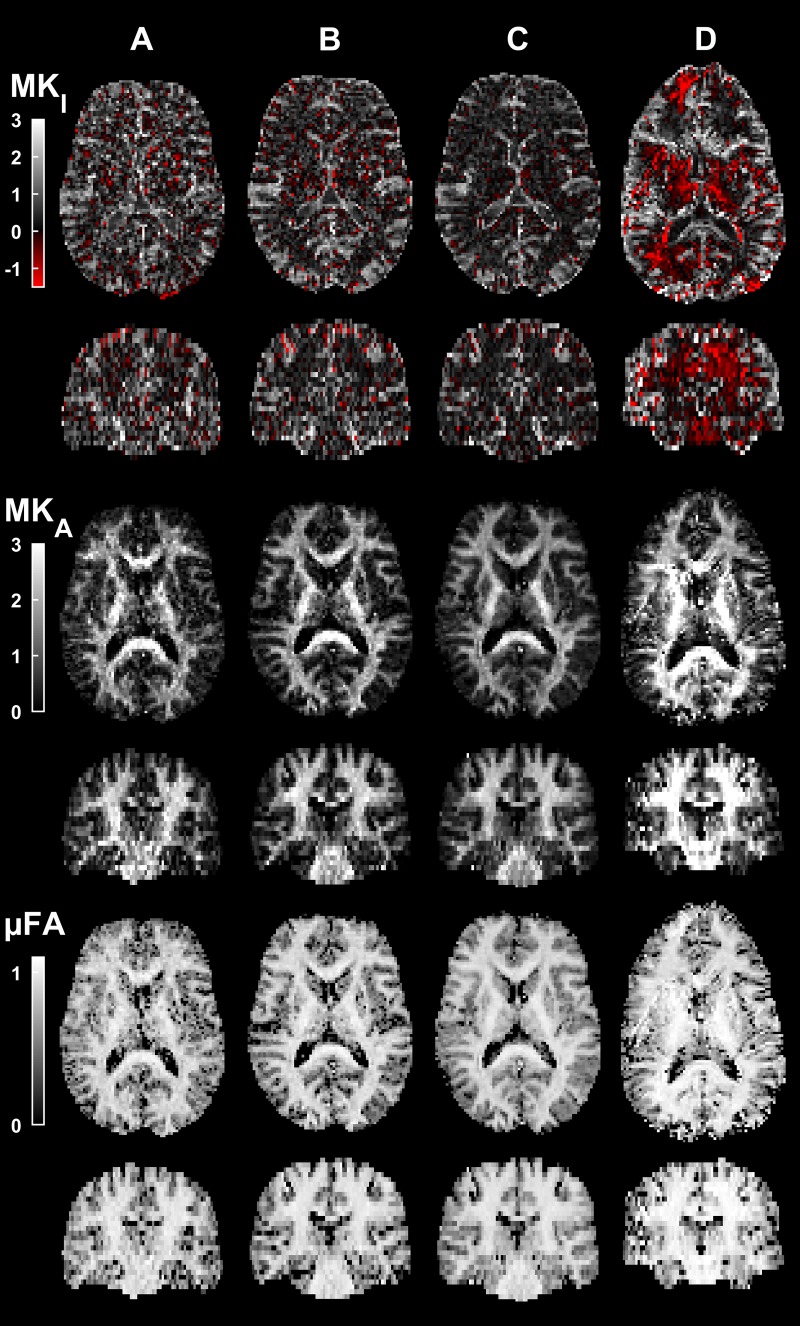
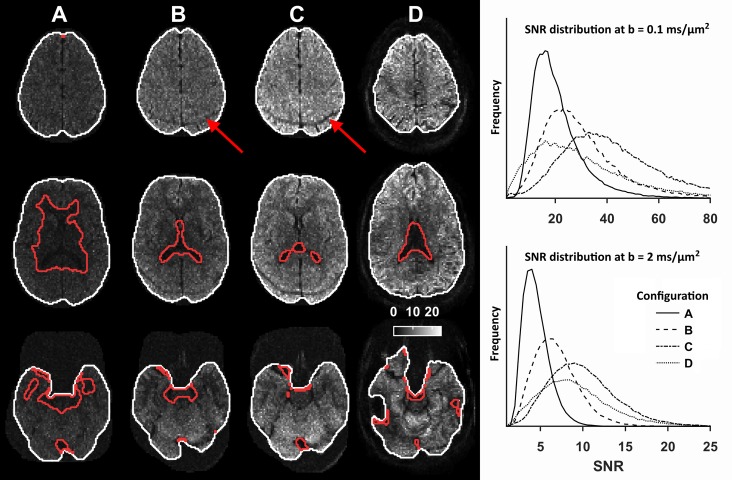
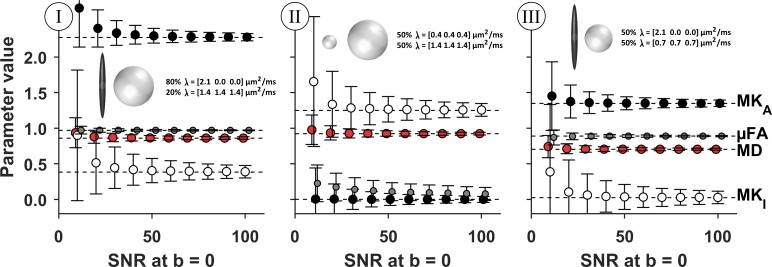
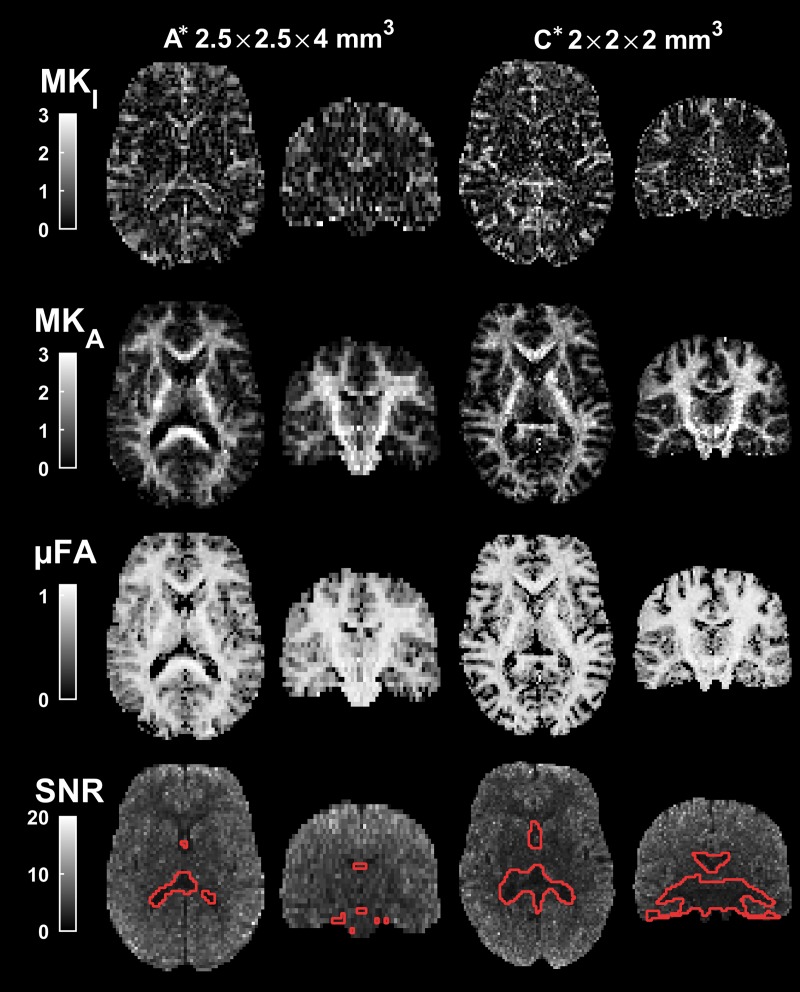
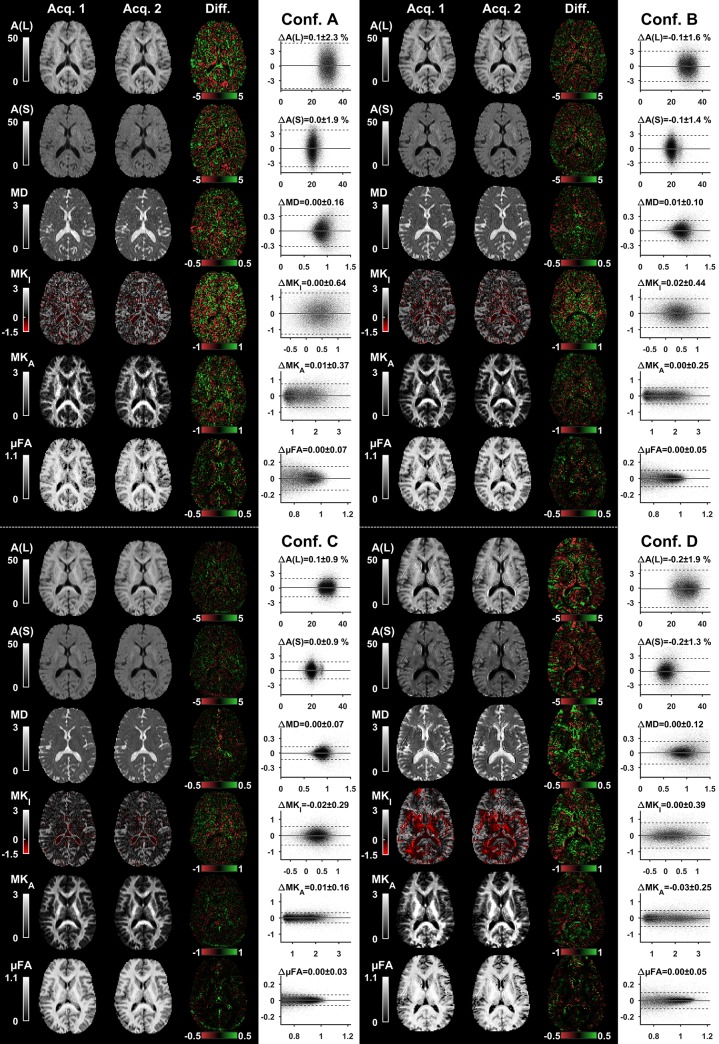
Microstructure imaging techniques based on tensor-valued diffusion encoding have gained popularity within the MRI research community. Unlike conventional diffusion encoding-applied along a single direction in each shot-tensor-valued encoding employs diffusion encoding along multiple directions within a single preparation of the signal. The benefit is that such encoding may probe tissue features that are not accessible by conventional encoding. For example, diffusional variance decomposition (DIVIDE) takes advantage of tensor-valued encoding to probe microscopic diffusion anisotropy independent of orientation coherence. The drawback is that tensor-valued encoding generally requires gradient waveforms that are more demanding on hardware; it has therefore been used primarily in MRI systems with relatively high performance. The purpose of this work was to explore tensor-valued diffusion encoding on clinical MRI systems with varying performance to test its technical feasibility within the context of DIVIDE. We performed whole-brain imaging with linear and spherical b-tensor encoding at field strengths between 1.5 and 7 T, and at maximal gradient amplitudes between 45 and 80 mT/m. Asymmetric gradient waveforms were optimized numerically to yield b-values up to 2 ms/μm2. Technical feasibility was assessed in terms of the repeatability, SNR, and quality of DIVIDE parameter maps. Variable system performance resulted in echo times between 83 to 115 ms and total acquisition times of 6 to 9 minutes when using 80 signal samples and resolution 2×2×4 mm3. As expected, the repeatability, signal-to-noise ratio and parameter map quality depended on hardware performance. We conclude that tensor-valued encoding is feasible for a wide range of MRI systems-even at 1.5 T with maximal gradient waveform amplitudes of 33 mT/m-and baseline experimental design and quality parameters for all included configurations. This demonstrates that tissue features, beyond those accessible by conventional diffusion encoding, can be explored on a wide range of MRI systems.
Conflict of interest statement
MN declares research support from, and ownership interests in, Colloidal Resource and it subsidiary Random Walk Imaging AB. FSz is a former employee of Random Walk Imaging AB. Remaining authors declare no conflict of interest.
Figures
Similar articles
-
Tensor-valued diffusion magnetic resonance imaging in a radiotherapy setting.Phys Imaging Radiat Oncol. 2022 Nov 10;24:144-151. doi: 10.1016/j.phro.2022.11.005. eCollection 2022 Oct. Phys Imaging Radiat Oncol. 2022. PMID: 36424981 Free PMC article.
-
Bridging the gap between constrained spherical deconvolution and diffusional variance decomposition via tensor-valued diffusion MRI.Med Image Anal. 2022 Jul;79:102476. doi: 10.1016/j.media.2022.102476. Epub 2022 May 7. Med Image Anal. 2022. PMID: 35569180
-
Maxwell-compensated design of asymmetric gradient waveforms for tensor-valued diffusion encoding.Magn Reson Med. 2019 Oct;82(4):1424-1437. doi: 10.1002/mrm.27828. Epub 2019 May 31. Magn Reson Med. 2019. PMID: 31148245 Free PMC article.
-
Gradient waveform design for tensor-valued encoding in diffusion MRI.J Neurosci Methods. 2021 Jan 15;348:109007. doi: 10.1016/j.jneumeth.2020.109007. Epub 2020 Nov 23. J Neurosci Methods. 2021. PMID: 33242529 Free PMC article. Review.
-
A review on investigation of the basic contrast mechanism underlying multidimensional diffusion MRI in assessment of neurological disorders.J Clin Neurosci. 2022 Aug;102:26-35. doi: 10.1016/j.jocn.2022.05.027. Epub 2022 Jun 10. J Clin Neurosci. 2022. PMID: 35696817 Review.
Cited by
-
Motion-compensated gradient waveforms for tensor-valued diffusion encoding by constrained numerical optimization.Magn Reson Med. 2021 Apr;85(4):2117-2126. doi: 10.1002/mrm.28551. Epub 2020 Oct 13. Magn Reson Med. 2021. PMID: 33048401 Free PMC article.
-
In vivo magnetic resonance imaging and spectroscopy. Technological advances and opportunities for applications continue to abound.J Magn Reson. 2019 Sep;306:55-65. doi: 10.1016/j.jmr.2019.07.034. Epub 2019 Jul 9. J Magn Reson. 2019. PMID: 31377150 Free PMC article. Review.
-
In vivo demonstration of microscopic anisotropy in the human kidney using multidimensional diffusion MRI.Magn Reson Med. 2019 Dec;82(6):2160-2168. doi: 10.1002/mrm.27869. Epub 2019 Jun 26. Magn Reson Med. 2019. PMID: 31243814 Free PMC article.
-
Disentangling white-matter damage from physiological fibre orientation dispersion in multiple sclerosis.Brain Commun. 2020 Jun 8;2(2):fcaa077. doi: 10.1093/braincomms/fcaa077. eCollection 2020. Brain Commun. 2020. PMID: 32954329 Free PMC article.
-
Clinical experience of tensor-valued diffusion encoding for microstructure imaging by diffusional variance decomposition in patients with breast cancer.Quant Imaging Med Surg. 2022 Mar;12(3):2002-2017. doi: 10.21037/qims-21-870. Quant Imaging Med Surg. 2022. PMID: 35284250 Free PMC article.
References
-
- Stejskal EO. Use of Spin Echoes in a Pulsed Magnetic-Field Gradient to Study Anisotropic, Restricted Diffusion and Flow. The Journal of Chemical Physics. 1965;43(10):3597 10.1063/1.1696526 - DOI
Publication types
MeSH terms
LinkOut - more resources
Full Text Sources
Other Literature Sources
Research Materials
