

Assessing the genetic diversity and characterizing genomic regions conferring Tan Spot resistance in cultivated rye
- PMID: 30921415
- PMCID: PMC6438500
- DOI: 10.1371/journal.pone.0214519
Assessing the genetic diversity and characterizing genomic regions conferring Tan Spot resistance in cultivated rye
Abstract
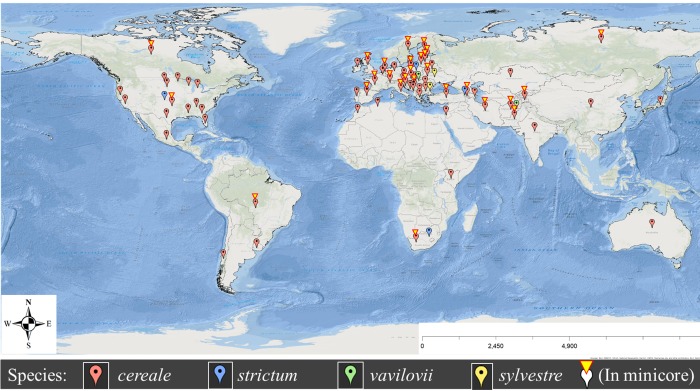
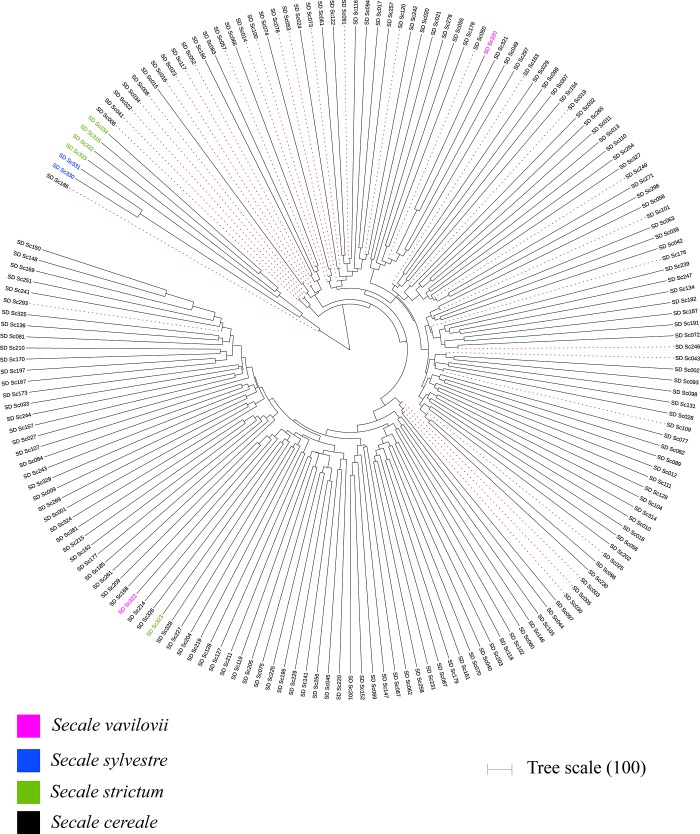
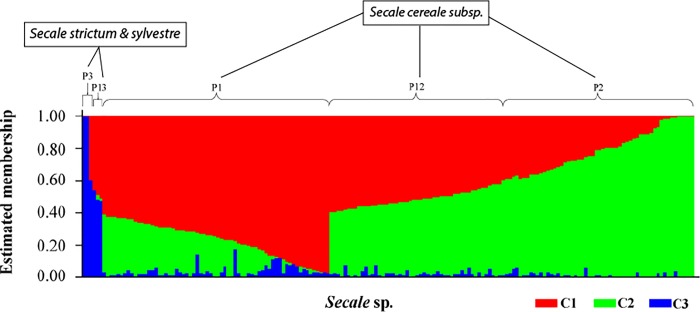
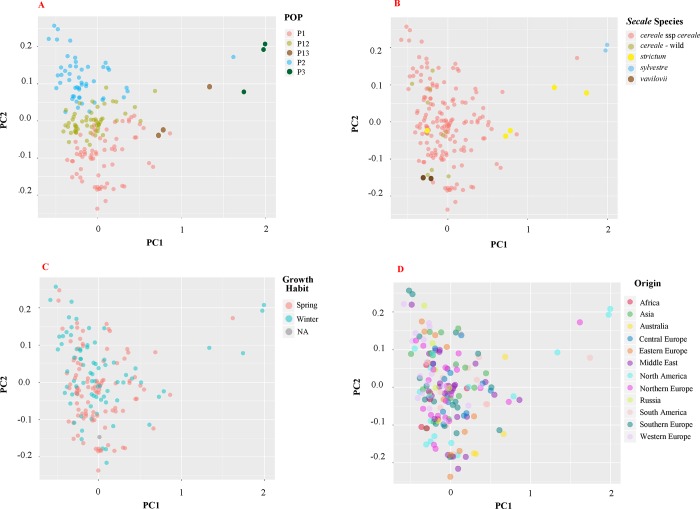
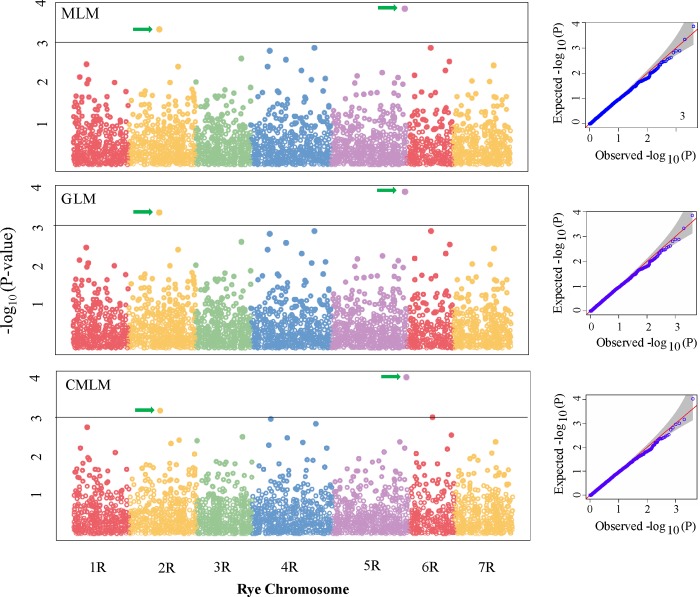
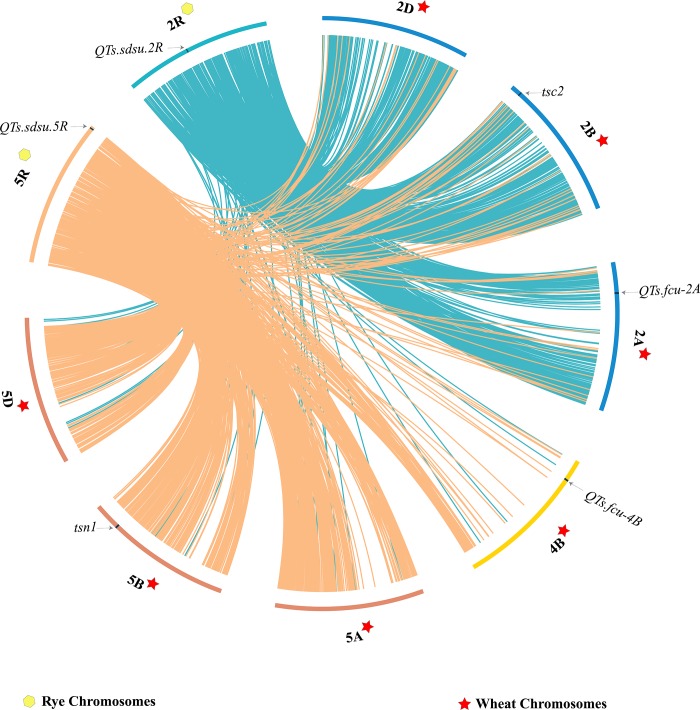
Rye (Secale cereale L.) is known for its wide adaptation due to its ability to tolerate harsh environments in semiarid areas. To assess the diversity in rye we genotyped a panel of 178 geographically diverse accessions of four Secale sp. from U.S. National Small Grains Collection using 4,037 high-quality SNPs (single nucleotide polymorphisms) developed by genotyping-by-sequencing (GBS). PCA and STRUCTURE analysis revealed three major clusters that separate S. cereale L. from S. strictum and S. sylvestre, however, genetic clusters did not correlate with geographic origins and growth habit (spring/winter). The panel was evaluated for response to Pyrenophora tritici-repentis race 5 (PTR race 5) and nearly 59% accessions showed resistance or moderate resistance. Genome-wide association study (GWAS) was performed on S. cereale subsp. cereale using the 4,037 high-quality SNPs. Two QTLs (QTs.sdsu-5R and QTs.sdsu-2R) on chromosomes 5R and 2R were identified conferring resistance to PTR race 5 (p < 0.001) that explained 13.1% and 11.6% of the phenotypic variation, respectively. Comparative analysis showed a high degree of synteny between rye and wheat with known rearrangements as expected. QTs.sdsu-2R was mapped in the genomic region corresponding to wheat chromosome group 2 and QTs.sdsu-5R was mapped to a small terminal region on chromosome 4BL. Based on the genetic diversity, a set of 32 accessions was identified to represents more than 99% of the allelic diversity with polymorphic information content (PIC) of 0.25. This set can be utilized for genetic characterization of useful traits and genetic improvement of rye, triticale, and wheat.
Conflict of interest statement
The authors have declared that no competing interests exist.
Figures
Similar articles
-
Characterization of a new gene for resistance to wheat powdery mildew on chromosome 1RL of wild rye Secale sylvestre.Theor Appl Genet. 2021 Mar;134(3):887-896. doi: 10.1007/s00122-020-03739-1. Epub 2021 Jan 2. Theor Appl Genet. 2021. PMID: 33388886
-
Mining and genomic characterization of resistance to tan spot, Stagonospora nodorum blotch (SNB), and Fusarium head blight in Watkins core collection of wheat landraces.BMC Plant Biol. 2019 Nov 8;19(1):480. doi: 10.1186/s12870-019-2093-3. BMC Plant Biol. 2019. PMID: 31703626 Free PMC article.
-
Discovery of a Novel Leaf Rust (Puccinia recondita) Resistance Gene in Rye (Secale cereale L.) Using Association Genomics.Cells. 2021 Dec 27;11(1):64. doi: 10.3390/cells11010064. Cells. 2021. PMID: 35011626 Free PMC article.
-
The specificity and genetic background of the rye (Secale cereale L.) tissue culture response.Plant Cell Rep. 2013 Jan;32(1):1-9. doi: 10.1007/s00299-012-1342-9. Epub 2012 Sep 25. Plant Cell Rep. 2013. PMID: 23007688 Free PMC article. Review.
-
Triticale Improvement for Forage and Cover Crop Uses in the Southern Great Plains of the United States.Front Plant Sci. 2018 Aug 6;9:1130. doi: 10.3389/fpls.2018.01130. eCollection 2018. Front Plant Sci. 2018. PMID: 30127797 Free PMC article. Review.
Cited by
-
Diversity of cereal rye (Secale cereale) germplasm in the Southeast United States.Plant Genome. 2025 Jun;18(2):e70008. doi: 10.1002/tpg2.70008. Plant Genome. 2025. PMID: 40230018 Free PMC article.
-
A Genome-Wide Association Study Pinpoints Quantitative Trait Genes for Plant Height, Heading Date, Grain Quality, and Yield in Rye (Secale cereale L.).Front Plant Sci. 2021 Oct 29;12:718081. doi: 10.3389/fpls.2021.718081. eCollection 2021. Front Plant Sci. 2021. PMID: 34777409 Free PMC article.
-
Selective sweeps identification in distinct groups of cultivated rye (Secale cereale L.) germplasm provides potential candidate genes for crop improvement.BMC Plant Biol. 2023 Jun 16;23(1):323. doi: 10.1186/s12870-023-04337-1. BMC Plant Biol. 2023. PMID: 37328739 Free PMC article.
-
SPInDel Analysis of the Non-Coding Regions of cpDNA as a More Useful Tool for the Identification of Rye (Poaceae: Secale) Species.Int J Mol Sci. 2020 Dec 10;21(24):9421. doi: 10.3390/ijms21249421. Int J Mol Sci. 2020. PMID: 33321948 Free PMC article.
-
Exploring genetic diversity of wild and related tetraploid wheat species Triticum turgidum and Triticum timopheevii.J Adv Res. 2023 Jun;48:47-60. doi: 10.1016/j.jare.2022.08.020. Epub 2022 Sep 7. J Adv Res. 2023. PMID: 36084813 Free PMC article.
References
-
- Sencer HA, Hawkes JG. On the origin of cultivated rye. Biol J Linn Soc. 1980;13: 299–313. 10.1111/j.1095-8312.1980.tb00089.x - DOI
-
- Bushuk W. Rye production and uses worldwide. Cereal Foods World. 2001;46: 70–73.
-
- Shang HY, Wei YM, Wang XR, Zheng YL. Genetic diversity and phylogenetic relationships in the rye genus Secale L. (rye) based on Secale cereale microsatellite markers. Genet Mol Biol. 2006; 10.1590/S1415-47572006000400018 - DOI
Publication types
MeSH terms
LinkOut - more resources
Full Text Sources
