Meta-Analysis
. 2020 Feb 3;70(4):615-627.
doi: 10.1093/cid/ciz258.

The Impact of Human Immunodeficiency Virus Infection on Gut Microbiota α-Diversity: An Individual-level Meta-analysis

Collaborators, Affiliations
Meta-Analysis

The Impact of Human Immunodeficiency Virus Infection on Gut Microbiota α-Diversity: An Individual-level Meta-analysis

Susan A Tuddenham et al. Clin Infect Dis. .

Abstract

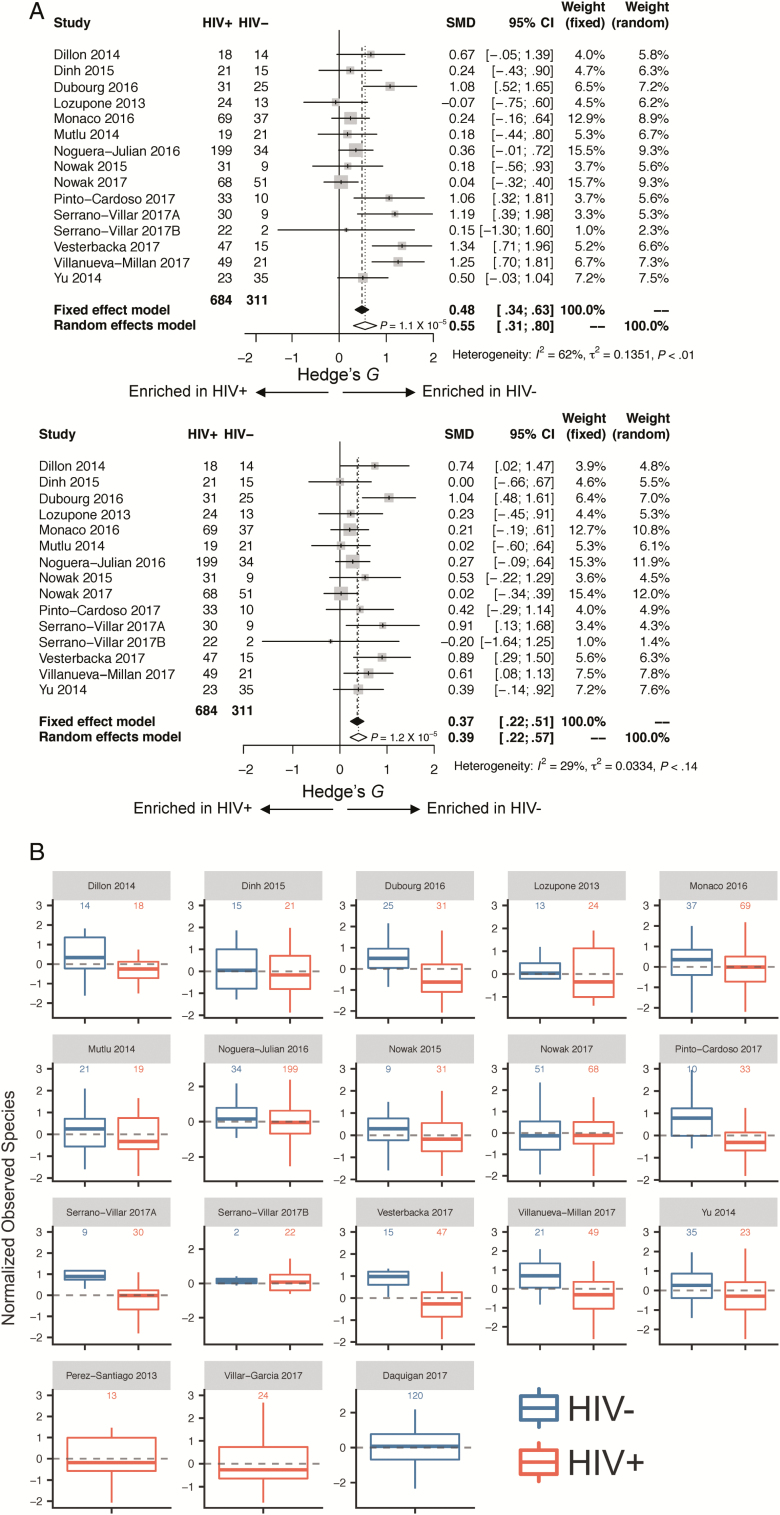
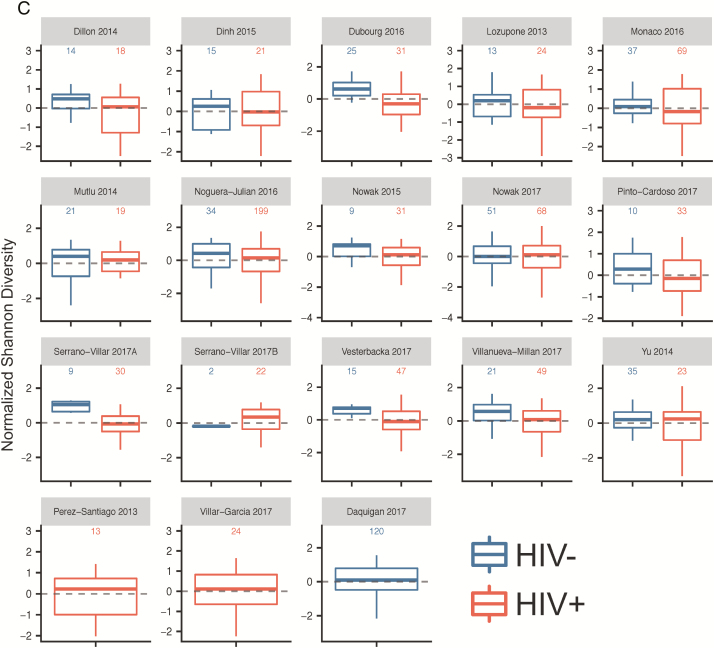
Background: Whether human immunodeficiency virus (HIV) infection impacts gut microbial α-diversity is controversial. We reanalyzed raw 16S ribosomal RNA (rRNA) gene sequences and metadata from published studies to examine α-diversity measures between HIV-uninfected (HIV-) and HIV-infected (HIV+) individuals.

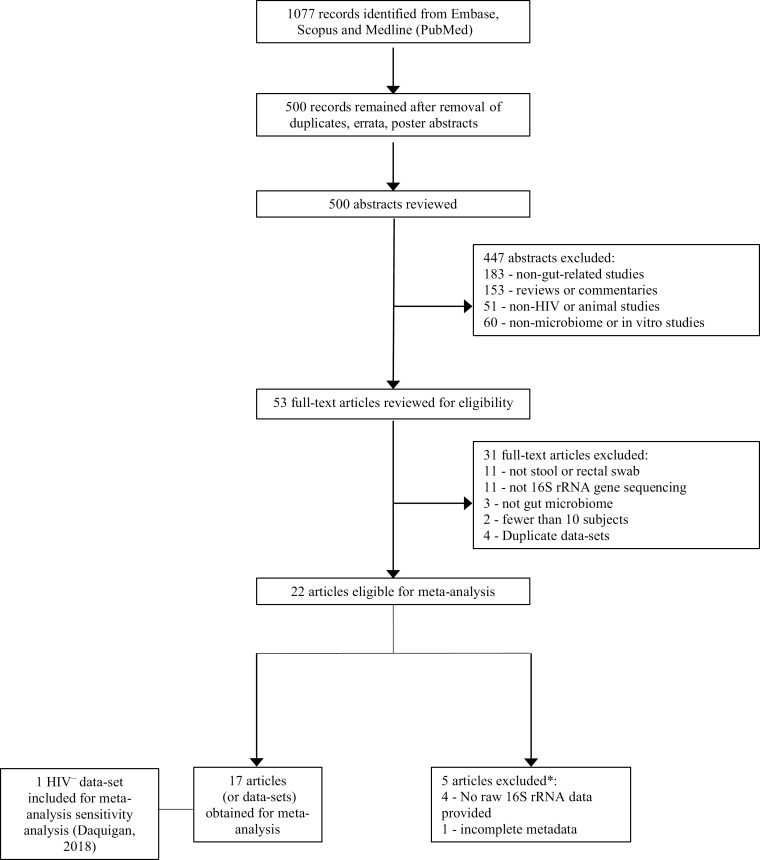
Methods: We conducted a systematic review and individual level meta-analysis by searching Embase, Medline, and Scopus for original research studies (inception to 31 December 2017). Included studies reported 16S rRNA gene sequences of fecal samples from HIV+ patients. Raw sequence reads and metadata were obtained from public databases or from study authors. Raw reads were processed through standardized pipelines with use of a high-resolution taxonomic classifier. The χ2 test, paired t tests, and generalized linear mixed models were used to relate α-diversity measures and clinical metadata.

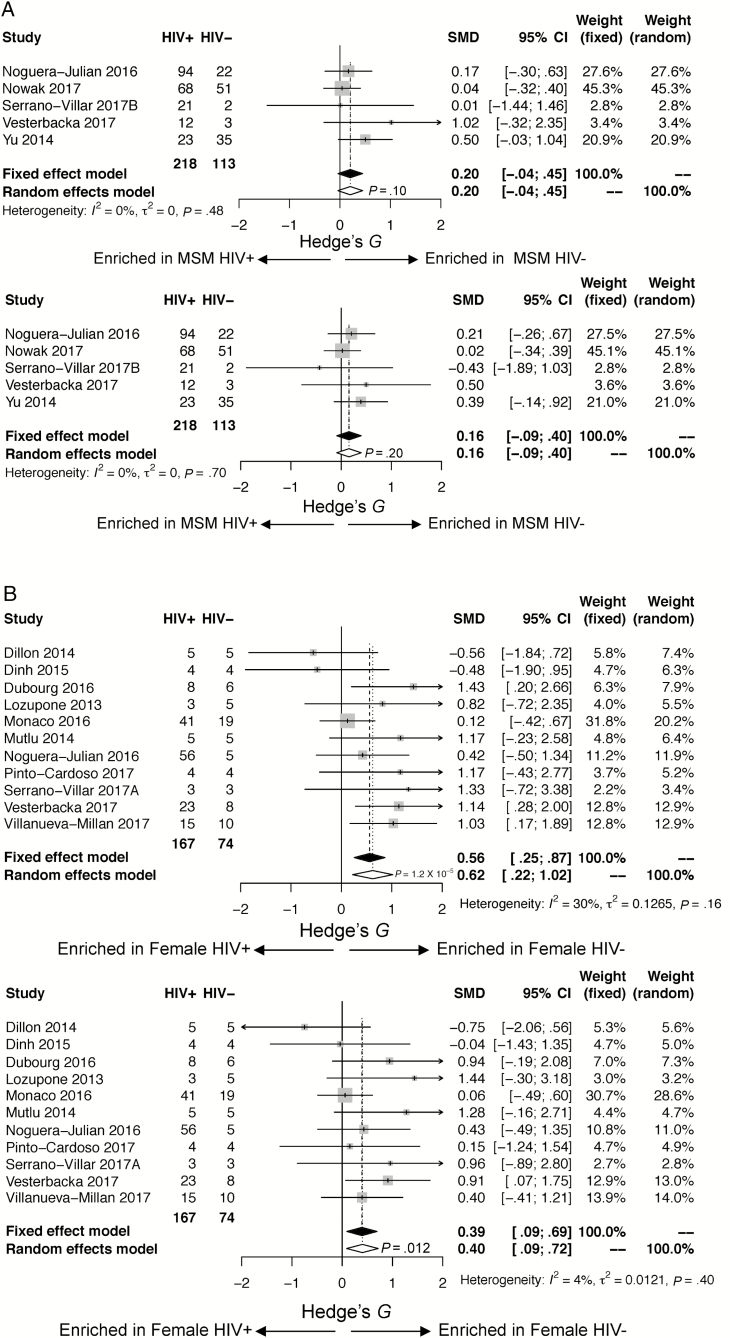
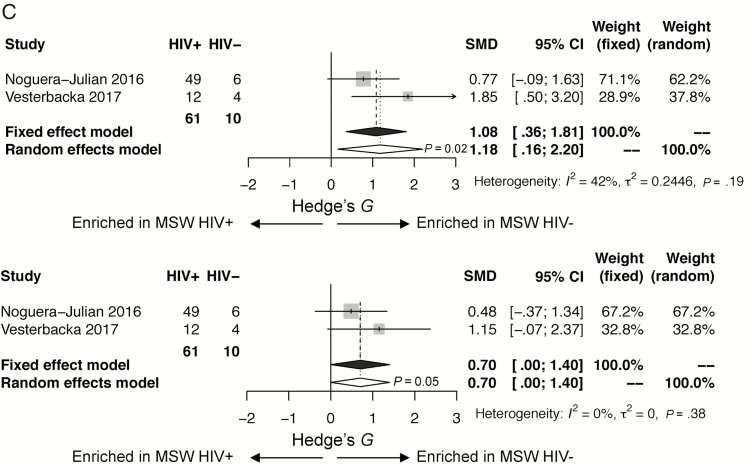
Results: Twenty-two studies were identified with 17 datasets available for analysis, yielding 1032 samples (311 HIV-, 721 HIV+). HIV status was associated with a decrease in measures of α-diversity (P < .001). However, in stratified analysis, HIV status was associated with decreased α-diversity only in women and in men who have sex with women (MSW) but not in men who have sex with men (MSM). In analyses limited to women and MSW, controlling for HIV status, women displayed increased α-diversity compared with MSW.

Conclusions: Our study suggests that HIV status, sexual risk category, and gender impact gut microbial community α-diversity. Future studies should consider MSM status in gut microbiome analyses.

Keywords: AIDS; HIV; microbiome.


Figures

Figure 1.
Figure 1.
Summary of evidence search and selection. *See Supplementary Table 4. Abbreviations: HIV, human immunodeficiency virus; rRNA, ribosomal RNA.
Figure 2.
Figure 2.
A, Forest plots utilizing all samples, comparing human immunodeficiency virus infected (HIV+) to human immunodeficiency virus uninfected (HIV): observed species (above) and Shannon index (below). Associations between gut microbial α-diversity and HIV status. Hedge’s G difference statistic is shown on the x-axis. Fixed effects models (black diamonds) and random effects models (white diamonds) with 95% CI above or below 0 were considered statistically significant. The fixed effects model assumes there exists a single effect size shared by all included studies, while the random effects model allows for variation in the effect size from study to study. Heterogeneity analysis includes estimates of I2 (percentage of variation reflecting true heterogeneity), τ2 (random effects between study variance), and P value from Cochran Q test for heterogeneity. Top panel of A: Based on observed species, gut microbial α-diversity is increased in HIV as compared with HIV+ patients. There is significant heterogeneity between studies (I2 = 62%, P < .01). Bottom panel of A: Based on Shannon index, gut microbial α-diversity is increased in HIV as compared with HIV+ patients. Heterogeneity between studies is not statistically significant (I2 = 29%, P = .14). B and C, Boxplots showing α-diversity in terms of observed species (B) and Shannon index (C) by study and HIV status (dark blue = HIV, red = HIV+). α-Diversity is centered within study and scaled to unit variance. Most studies show decreased α-diversity in HIV+ patients as compared with HIV patients. Abbreviations: CI, confidence interval; HIV, human immunodeficiency virus; SMD, standardized mean difference.
Figure 2.
Figure 2.
A, Forest plots utilizing all samples, comparing human immunodeficiency virus infected (HIV+) to human immunodeficiency virus uninfected (HIV): observed species (above) and Shannon index (below). Associations between gut microbial α-diversity and HIV status. Hedge’s G difference statistic is shown on the x-axis. Fixed effects models (black diamonds) and random effects models (white diamonds) with 95% CI above or below 0 were considered statistically significant. The fixed effects model assumes there exists a single effect size shared by all included studies, while the random effects model allows for variation in the effect size from study to study. Heterogeneity analysis includes estimates of I2 (percentage of variation reflecting true heterogeneity), τ2 (random effects between study variance), and P value from Cochran Q test for heterogeneity. Top panel of A: Based on observed species, gut microbial α-diversity is increased in HIV as compared with HIV+ patients. There is significant heterogeneity between studies (I2 = 62%, P < .01). Bottom panel of A: Based on Shannon index, gut microbial α-diversity is increased in HIV as compared with HIV+ patients. Heterogeneity between studies is not statistically significant (I2 = 29%, P = .14). B and C, Boxplots showing α-diversity in terms of observed species (B) and Shannon index (C) by study and HIV status (dark blue = HIV, red = HIV+). α-Diversity is centered within study and scaled to unit variance. Most studies show decreased α-diversity in HIV+ patients as compared with HIV patients. Abbreviations: CI, confidence interval; HIV, human immunodeficiency virus; SMD, standardized mean difference.
Figure 3.
Figure 3.
A, Forest plots restricted to men who have sex with men (MSM), comparing human immunodeficiency virus infected (HIV+) to human immunodeficiency virus uninfected (HIV): observed species (above), Shannon (below). Associations between gut microbial α-diversity and HIV status in stratified analysis restricted to MSM. Hedge’s G difference statistic is shown on the x-axis. Fixed effects models (black diamonds) and random effects models (white diamonds) with 95% confidence interval (CI) above or below 0 were considered statistically significant. The fixed effects model assumes there exists a single effect size shared by all included studies, while the random effects model allows for variation in the effect size from study to study. Heterogeneity analysis includes estimates of I2 (percentage of variation reflecting true heterogeneity), τ2 (random effects between study variance), and P value from Cochran Q test for heterogeneity. Top panel: Based on observed species, gut microbial α-diversity is not statistically significantly different in HIV compared with HIV+ MSM. There is little heterogeneity between studies (I2 = 0%, P = .48). Bottom panel: Based on Shannon index, gut microbial α-diversity is not statistically significantly different in HIV compared with HIV+ MSM. There is little heterogeneity between studies (I2 = 0%, P = .70). B, Forest plots restricted to women, comparing HIV+ to HIV: observed species (above), Shannon (below). Associations between gut microbial α-diversity and HIV status in stratified analysis restricted to women. Hedge’s G difference statistic is shown on the x axis. Fixed effects models (black diamonds) and random effects models (white diamonds) with 95% CI above or below 0 were considered statistically significant. The fixed effects model assumes there exists a single effect size shared by all included studies, while the random effects model allows for variation in the effect size from study to study. Heterogeneity analysis includes estimates of I2 (percentage of variation reflecting true heterogeneity), τ2 (random effects between study variance), and P value from Cochran Q test for heterogeneity. Top panel: Based on observed species, gut microbial α-diversity is increased in HIV compared with HIV+ women (P <.0001). There is little heterogeneity between studies (I2 = 30%, P = .16). Bottom panel: Based on Shannon index, gut microbial α-diversity is increased in HIV as compared with HIV+ women (P = .012). There is little heterogeneity between studies (I2 = 29%, P = .40). C, Forest plots restricted to men who have sex with women (MSW), comparing HIV+ to HIV: observed species (above), Shannon (below). Associations between gut microbial α-diversity and HIV status in stratified analysis restricted to MSW. Hedge’s G difference statistic is shown on the x-axis. Fixed effects models (black diamonds) and random effects models (white diamonds) with 95% CI above or below 0 were considered statistically significant. The fixed effects model assumes there exists a single effect size shared by all included studies, while the random effects model allows for variation in the effect size from study to study. Heterogeneity analysis includes estimates of I2 (percentage of variation reflecting true heterogeneity), τ2 (random effects between study variance), and P value from Cochran Q test for heterogeneity. Of note, there were only 10 HIV MSW. Top panel: Based on observed species, gut microbial α-diversity is increased in HIV compared with HIV+ MSW (P = .02). There is little heterogeneity between studies (I2 = 42%, P = .19). Bottom panel: Based on Shannon index, there is a trend toward gut microbial α-diversity being increased in HIV compared with HIV+ MSW (P = .05). There is little heterogeneity between the 2 studies (I2 = 0%, P = .38).
Figure 3.
Figure 3.
A, Forest plots restricted to men who have sex with men (MSM), comparing human immunodeficiency virus infected (HIV+) to human immunodeficiency virus uninfected (HIV): observed species (above), Shannon (below). Associations between gut microbial α-diversity and HIV status in stratified analysis restricted to MSM. Hedge’s G difference statistic is shown on the x-axis. Fixed effects models (black diamonds) and random effects models (white diamonds) with 95% confidence interval (CI) above or below 0 were considered statistically significant. The fixed effects model assumes there exists a single effect size shared by all included studies, while the random effects model allows for variation in the effect size from study to study. Heterogeneity analysis includes estimates of I2 (percentage of variation reflecting true heterogeneity), τ2 (random effects between study variance), and P value from Cochran Q test for heterogeneity. Top panel: Based on observed species, gut microbial α-diversity is not statistically significantly different in HIV compared with HIV+ MSM. There is little heterogeneity between studies (I2 = 0%, P = .48). Bottom panel: Based on Shannon index, gut microbial α-diversity is not statistically significantly different in HIV compared with HIV+ MSM. There is little heterogeneity between studies (I2 = 0%, P = .70). B, Forest plots restricted to women, comparing HIV+ to HIV: observed species (above), Shannon (below). Associations between gut microbial α-diversity and HIV status in stratified analysis restricted to women. Hedge’s G difference statistic is shown on the x axis. Fixed effects models (black diamonds) and random effects models (white diamonds) with 95% CI above or below 0 were considered statistically significant. The fixed effects model assumes there exists a single effect size shared by all included studies, while the random effects model allows for variation in the effect size from study to study. Heterogeneity analysis includes estimates of I2 (percentage of variation reflecting true heterogeneity), τ2 (random effects between study variance), and P value from Cochran Q test for heterogeneity. Top panel: Based on observed species, gut microbial α-diversity is increased in HIV compared with HIV+ women (P <.0001). There is little heterogeneity between studies (I2 = 30%, P = .16). Bottom panel: Based on Shannon index, gut microbial α-diversity is increased in HIV as compared with HIV+ women (P = .012). There is little heterogeneity between studies (I2 = 29%, P = .40). C, Forest plots restricted to men who have sex with women (MSW), comparing HIV+ to HIV: observed species (above), Shannon (below). Associations between gut microbial α-diversity and HIV status in stratified analysis restricted to MSW. Hedge’s G difference statistic is shown on the x-axis. Fixed effects models (black diamonds) and random effects models (white diamonds) with 95% CI above or below 0 were considered statistically significant. The fixed effects model assumes there exists a single effect size shared by all included studies, while the random effects model allows for variation in the effect size from study to study. Heterogeneity analysis includes estimates of I2 (percentage of variation reflecting true heterogeneity), τ2 (random effects between study variance), and P value from Cochran Q test for heterogeneity. Of note, there were only 10 HIV MSW. Top panel: Based on observed species, gut microbial α-diversity is increased in HIV compared with HIV+ MSW (P = .02). There is little heterogeneity between studies (I2 = 42%, P = .19). Bottom panel: Based on Shannon index, there is a trend toward gut microbial α-diversity being increased in HIV compared with HIV+ MSW (P = .05). There is little heterogeneity between the 2 studies (I2 = 0%, P = .38).

Similar articles

Cited by

References

    1. Egger M, May M, Chêne G, et al. . ART Cohort Collaboration Prognosis of HIV-1-infected patients starting highly active antiretroviral therapy: a collaborative analysis of prospective studies. Lancet 2002; 360:119–29. - PubMed
    1. Gootenberg DB, Paer JM, Luevano JM, Kwon DS. HIV-associated changes in the enteric microbial community: potential role in loss of homeostasis and development of systemic inflammation. Curr Opin Infect Dis 2017; 30:31–43. - PMC - PubMed
    1. Glesby MJ. Cardiovascular complications of HIV infection. Top Antivir Med 2017; 24:127–31. - PMC - PubMed
    1. Coghill AE, Pfeiffer RM, Shiels MS, Engels EA. Excess mortality among HIV-infected individuals with cancer in the United States. Cancer Epidemiol Biomarkers Prev 2017; 26:1027–33. - PMC - PubMed
    1. Kelesidis T, Kendall MA, Yang OO, Hodis HN, Currier JS. Biomarkers of microbial translocation and macrophage activation: association with progression of subclinical atherosclerosis in HIV-1 infection. J Infect Dis 2012; 206:1558–67. - PMC - PubMed

Publication types

Substances