. 2019 Jun 28;70(12):3057-3073.
doi: 10.1093/jxb/erz130.

Rice aquaporin PIP1;3 and harpin Hpa1 of bacterial blight pathogen cooperate in a type III effector translocation

Affiliations

Rice aquaporin PIP1;3 and harpin Hpa1 of bacterial blight pathogen cooperate in a type III effector translocation

Ping Li et al. J Exp Bot. .

Abstract

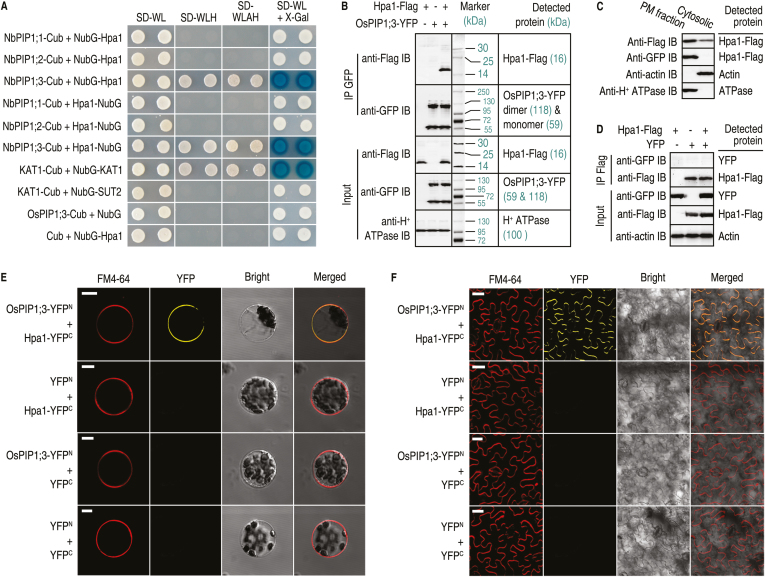
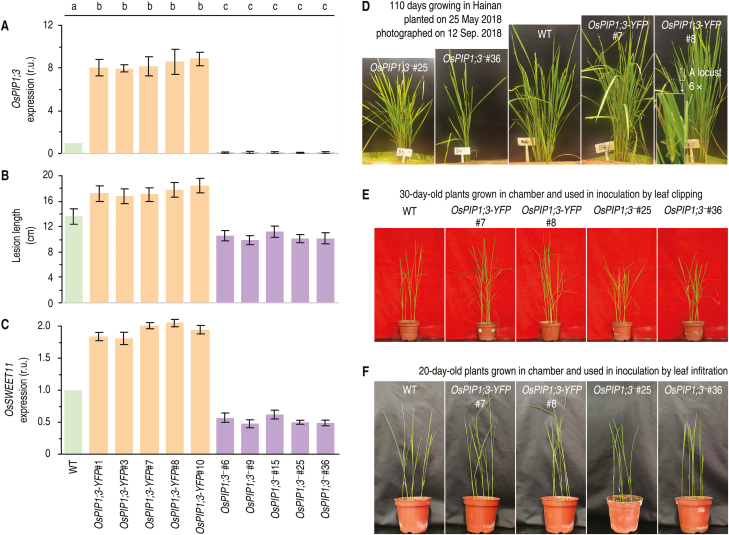
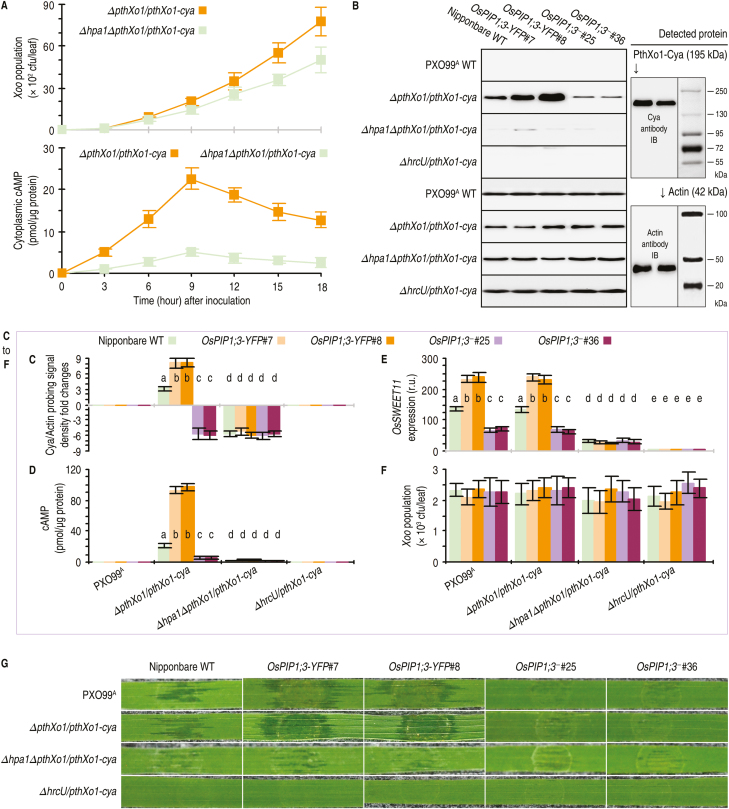
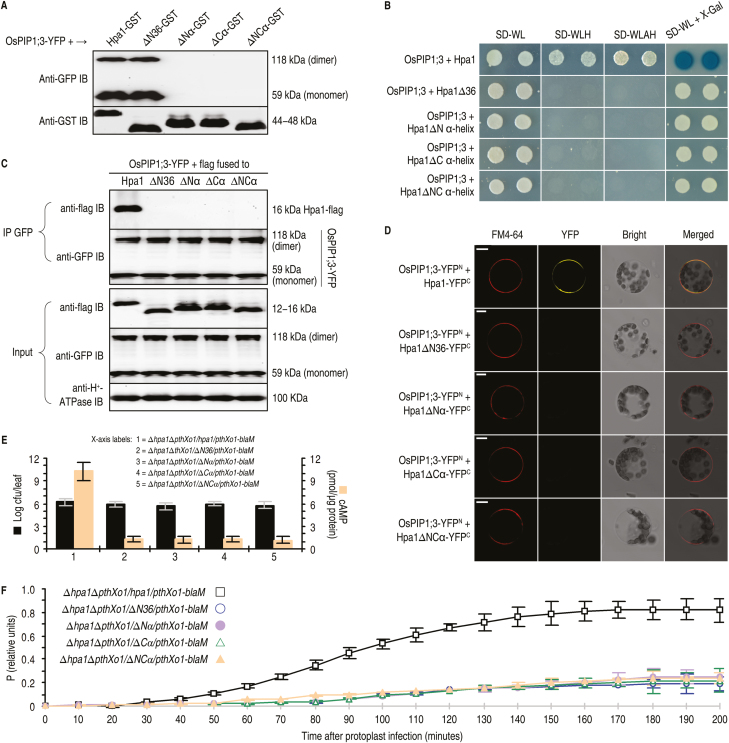
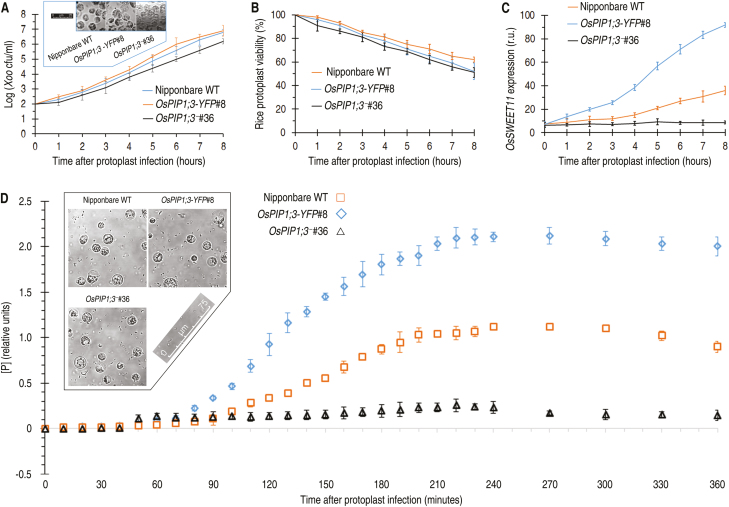
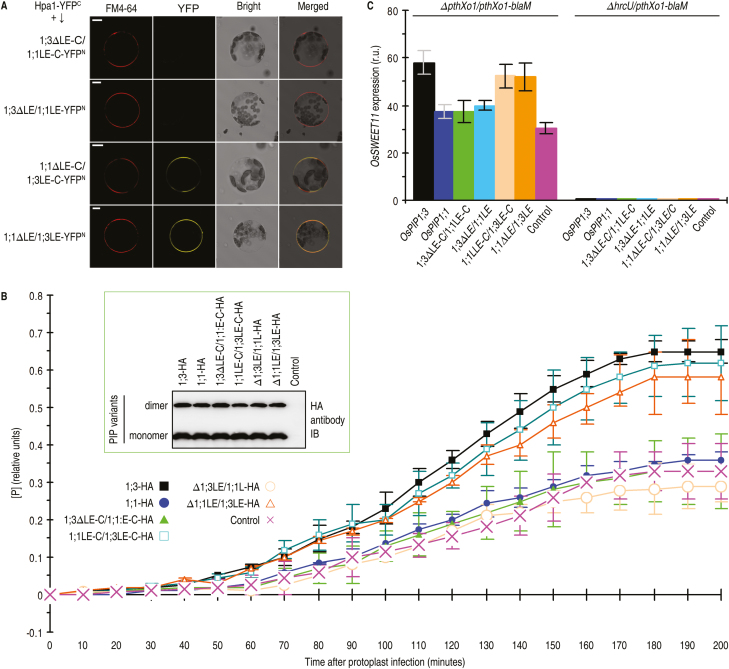
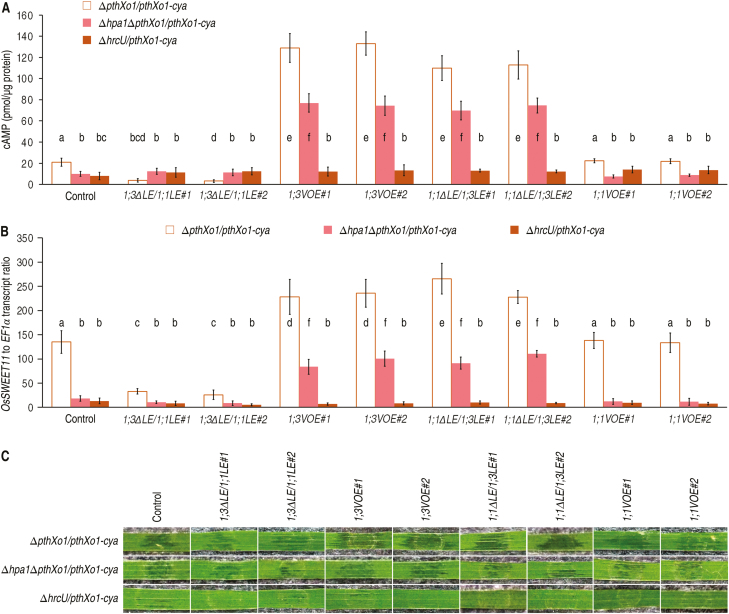
Varieties of Gram-negative bacterial pathogens infect their eukaryotic hosts by deploying the type III translocon to deliver effector proteins into the cytosol of eukaryotic cells in which effectors execute their pathological functions. The translocon is hypothetically assembled by bacterial translocators in association with the assumed receptors situated on eukaryotic plasma membranes. This hypothesis is partially verified in the present study with genetic, biochemical, and pathological evidence for the role of a rice aquaporin, plasma membrane intrinsic protein PIP1;3, in the cytosolic import of the transcription activator-like effector PthXo1 from the bacterial blight pathogen. PIP1;3 interacts with the bacterial translocator Hpa1 at rice plasma membranes to control PthXo1 translocation from cells of a well-characterized strain of the bacterial blight pathogen into the cytosol of cells of a susceptible rice variety. An extracellular loop sequence of PIP1;3 and the α-helix motif of Hpa1 determine both the molecular interaction and its consequences with respect to the effector translocation and the bacterial virulence on the susceptible rice variety. Overall, these results provide multiple experimental avenues to support the hypothesis that interactions between bacterial translocators and their interactors at the target membrane are essential for bacterial effector translocation.

Keywords: Aquaporin; PIP1; bacterial pathogen; rice; translocation; type III effector.


Figures

Fig. 1.
Fig. 1.
Hpa1 and OsPIP1;3 interact in vitro and in vivo. (A) SUB-Y2H tests of Hpa1 and OsPIP1s. KAT1-Cub+NubG-KAT1 and KAT1-Cub+NubG-SUT2 were used as positive and negative controls, respectively. (B) Co-IP of PM proteins from rice protoplasts co-transformed with OsPIP1;3-YFP and hpa1-flag. GFP antibody IP products and input proteins were detected by immunoblotting (IB) with the indicated antibodies. H+-ATPase was detected as a PM-localized protein reference. Weak signals of non-specific hybridization appear, presumably due to protein degradation and/or the presence of homologous proteins. (C) Immunoblotting of PM and cytosolic proteins isolated from rice protoplasts treated with the Hpa1-Flag fusion protein. (D) Co-IP of PM proteins from rice protoplasts co-transformed with YFP and hpa1-flag. (E) YFP BiFC of OsPIP1;3 and Hpa1 expressed in rice protoplasts. Scale bars=10 μm. (F) YFP BiFC of OsPIP1;3 and Hpa1 expressed in N. benthamiana leaves. Scale bars=20 μm. In (E, F) the red fluorescent PM marker FM4-64 was used to show cell outlines.
Fig. 2.
Fig. 2.
Altered OsPIP1;3 expression levels affect the virulent function of PthXo1 and growth extents of plants. (A) Relative units (r.u.) of OsPIP1;3 expression in rice leaves based on RT–qPCR analyses in which the average expression level was set as 1 in the WT plant to estimate relative levels of gene expression in other plants. (B) Lesion length of bacterial blight on leaves at 12 dpi by leaf-top clipping and the areas of hypersensitive cell death on leaves at 5 dpi by leaf infiltration with each of the bacterial suspensions. (C) Relative levels of gene expression in leaves 12 hpi. (A–C) All data are shown as mean values ±SD error bars; different letters on bar graphs indicate significant differences by Duncan’s multiple range tests; P<0.01; n=30 plants from six independent experiments each including five repetitions in (A); n=30 leaves from six independent experiments in (B); n=9 repetitions from three independent experiments in (C). (D) Plants grown in an environment-protected breeding base located at Hainan University, Haikou, Hainan Province, China. (E, F) Appearance of plants at two ages used in inoculation experiments.
Fig. 3.
Fig. 3.
Hpa1 and OsPIP1;3 influence the role of PthXo1 in Xoo virulence on the susceptible rice variety Nipponbare. The experiments were performed on the wild-type (WT) plant and two types of transgenic plants, OsPIP1;3-overexpressing (OsPIP1;3-YFP) and TALEN-based OsPIP1;3 knockout (OsPIP1;3). Transgenic plants were characterized in terms of OsPIP1;3 expression levels and the presence and absence of OsPIP1;3 protein production. Transgenic plants were further compared with the WT to evaluate the virulence of hpa1- and pthXo1-related bacterial strains. (A) OsPIP1;3 expression in leaves of the different plants. Gene expression was analyzed by RT–qPCR using the constitutively expressed EF1α gene as a reference. (B) Immunoblotting of rice PM fractions. H+-ATPase was detected as a PM-localized protein reference. (C) Bacterial populations in leaf tissues at 5 dpi by the leaf-top clipping method. (D) Graduated presentation of bacterial blight symptoms on rice leaves photographed at 12 dpi by the leaf-top clipping method. In (A, C), quantitative data are given as the means ±SEM. Different letters on bar graphs indicate significant differences among data from the different plants inoculated with the indicated bacterial strain (P<0.01). Repeat number (n)=30 plants from six independent experiments each including five plants in (A); n=24 repetitions from eight independent experiments each involving three repetitions in (C).
Fig. 4.
Fig. 4.
OsPIP1;3 and hpa1 cooperate for TALE translocation and function in rice leaves. The WT and OsPIP1;3-related plants were inoculated by leaf infiltration with a bacterial suspension of hpa1- and pthXo1-related Xoo strains. Inoculated leaves were sampled at the indicated time points in (A) or at 9 hpi in (B, F) for use in the indicated measurements. (A) Changes of the bacterial population in leaf tissues and concentrations of cAMP resulting from the PthXo1–Cya activity in leaf cells over the course of time after plant inoculation with the indicated bacterial strains. Data shown are mean values ±SEMs (n=3 independent experiments each involving five leaves). (B) Immunoblotting (IB) of cytoplasmic proteins from rice leaves. As shown on the right, protein blots were hybridized either with the specific anti-Cya antibody, or with the specific antibody against monomeric actin, which was used as a cytoplasmic protein marker. (C) Relative levels of the PthXo1–Cya protein in leaf samples based on densities of hybridization signals in blots from (B, D). Concentrations of cAMP from PthXo1–Cya activity in the cytosol of leaf cells. (E) Relative levels of OsSWEET11 expression in leaves. Quantities of the gene transcript in the corresponding plants inoculated with ΔhrcU/TALE-cya were defined as 1 to evaluate relative levels of the gene expression in other plants. (F) Bacterial populations in leaf tissues. (G) Segments of leaves photographed at 3 dpi. In (C, F), all data are provided as the means ±SEMs. On bar graphs, different letters indicate significant differences in multiple comparisons of data from the different combinations of plants and bacterial strains; P<0.01; n=15 repetitions from five independent experiments each involving three repetitions.
Fig. 5.
Fig. 5.
The pair of α-helices in the Hpa1 sequence is an OsPIP1;3-interacting motif playing a critical role in PthXo1 translocation. (A–D) Hpa1 mutant versions ∆N36, ∆Nα, ∆Cα, and αNC were generated by deleting the N-terminal region made up of 36 residues, the N-terminal α-helix, the C-terminal α-helix, and both α-helices, respectively. The canonical and mutant versions of Hpa1 were fused to the GST tag, followed by molecular interaction assays in single combinations with OsPIP1s, which were used either in the canonical form or in a fusion to YFP, depending on the experimental methods. (A) Pulldown assays. Every GST-linking protein was purified and then immobilized on glutathione affinity resins. The eluates were analyzed by immunoblotting with GST or GFP antibody. (B) SUB-Y2H tests of Hpa1 mutants and OsPIP1;3. (C) Co-IP of PM proteins from OsPIP1;3-YFP#8 rice protoplasts transformed with the hpa1 mutants. (D) YFP BiFC of OsPIP1;3 and Hpa1 mutant versions expressed in rice protoplasts. Scale bars=10 μm. (E, F) The hpa1 gene variants ∆N36, ∆Nα, ∆Cα, and αNC were introduced into the ∆hpa1 or ∆hpa1∆pthXo1/pthXo1-cya mutant of Xoo strain PXO99A. Recombinant bacteria were used in Nipponbare inoculation by the leaf-top clipping method. Inoculated plants were subjected to the following analyses. (E) Blight lesion length on leaves 9 dpi and the content of cAMP from PthXo1–Cya activity in cytoplasm of leaf cells at 12 hpi. (F) Concentrations of P from PthXo1–BlaM activity in rice protoplasts infected by co-incubation with bacteria of the indicated strains. In (E, F) data shown are the mean values ±SEM bars; n=9 repetitions from three independent experiments each involving three repetitions.
Fig. 6.
Fig. 6.
The Blam reporter confirms the regulatory role of OsPIP1;3 in PthXo1 translocation. (A–C) Changes of Xoo population, rice protoplast viability, and OsSWEET11 expression levels after 8 h of incubation with bacteria of the recombinant PXO99A strain containing the pthXo1-blaM fusion gene. Insert in (A) shows protoplasts photographed after an 8 h incubation. In (C), gene expression was analyzed by RT–qPCR using the EF1α gene as a reference to quantify OsPIP1;3 expression levels in protoplasts of the different plants. (D) Concentrations of Pfrom PthXo1–BlaM activity in rice protoplasts infected by co-incubation with bacteria of the recombinant PXO99A strain. The inset shows rice protoplasts photographed after 6 h of incubation. (A–D) All quantitative data are given as means ±SEMs; n=9 repetitions from three independent experiments each involving three repetitions.
Fig. 7.
Fig. 7.
OsPIP1;3 LE is a Hpa1-interacting motif critical for PthXo1 translocation. (A) Diagrams of predicted OsPIP1 structures and sequence region swapping between OsPIP1;3 and OsPIP1;1 to yield substituted proteins. TMs are shown as rectangles and indicated by numbers according to the predicted location in PIP sequences. The nomenclature for substituted proteins is, as for example in 1;3∆LE-C/1;1LE-C, created by switching the LE-linking C-end region from OsPIP1;1 to OsPIP1;3. (B) SUB-Y2H tests of Hpa1 and OsPIP1 substituted proteins. (C) Co-IP of PM proteins from Nipponbare protoplasts transformed with each pair of genes encoding the indicated proteins.
Fig. 8.
Fig. 8.
The Hpa1-interacting motif in OsPIP1;3 is critical for TALE translocation. (A) BiFC in Nipponbare protoplasts. Scale bars=10 µm. (B) PthXo1 translocation assessments based on [P] from PthXo1–BlaM activity. Protoplasts of Nipponbare TALEN line OsPIP1;3#25 were transformed with the HA-fused canonical or mutant form of OsPIP genes and infected with ∆pthXo1/pthXo1-blaM. Control refers to the vector used in gene recombination. Data are the means ±SEMs; asterisks indicate significant differences between proteins carrying OsPIP1;3 LE and lacking the loop, with respect to [P] at the time points from 50 min to 200 min; P<0.01; n=9 repetitions from three independent experiments. The inset is an immunoblotting analysis. (C) OsSWEET11 expression in protoplasts. Protoplasts of the Nipponbare TALEN line OsPIP1;3#25 were transformed with the HA-fused canonical or mutant form of OsPIP genes and infected with ∆PthXo1/PthXo1-blaM or ∆hrcU/PthXo1-blaM. Data shown are mean values ±SEM bars; different letters indicate significant differences by Duncan’s multiple range tests; P<0.01; n=9 repetitions from three independent experiments.
Fig. 9.
Fig. 9.
The function of the LE of OsPIP1;3 to support virulence in plants. (A) PthXo1–Cya translocation measured as cytoplasmic cAMP concentrations in leaves of 30-day-old Nipponbare seedlings. Fifteen days previously, plants were transformed with the empty VMGOE vector (control) or each of the indicated genes inserted into the vector. Plants were inoculated by leaf infiltration with every suspension of the recombinant PXO99A strains shown on top, and inoculated leaves were excised at 9 hpi for use in cAMP measurements. (B) OsSWEET11 expression in leaves equivalent to those in (A). (A, B) Data show are means ±SEMs; different letters indicate significant differences by Duncan’s multiple range tests; P<0.01; n=15 plants tested in three independent experiments. (C) Segments of leaves photographed at 5 dpi.

References

    1. Alfano JR, Collmer A. 2004. Type III secretion system effector proteins: double agents in bacterial disease and plant defense. Annual Review of Phytopathology 42, 385–414. - PubMed
    1. Baumgart F, Rossi A, Verkman AS. 2012. Light inactivation of water transport and protein–protein interactions of aquaporin–Killer Red chimeras. Journal of General Physiology 139, 83–91. - PMC - PubMed
    1. Bocsanczy AM, Nissinen RM, Oh CS, Beer SV. 2008. HrpN of Erwinia amylovora functions in the translocation of DspA/E into plant cells. Molecular Plant Pathology 9, 425–434. - PMC - PubMed
    1. Bogdanove AJ, Voytas DF. 2011. TAL effectors: customizable proteins for DNA targeting. Science 333, 1843–1846. - PubMed
    1. Büttner D. 2012. Protein export according to schedule: architecture, assembly, and regulation of type III secretion systems from plant- and animal-pathogenic bacteria. Microbiology and Molecular Biology Reviews 76, 262–310. - PMC - PubMed

Publication types

MeSH terms

Supplementary concepts