

Group ICA for identifying biomarkers in schizophrenia: 'Adaptive' networks via spatially constrained ICA show more sensitivity to group differences than spatio-temporal regression
- PMID: 30921608
- PMCID: PMC6438914
- DOI: 10.1016/j.nicl.2019.101747
Group ICA for identifying biomarkers in schizophrenia: 'Adaptive' networks via spatially constrained ICA show more sensitivity to group differences than spatio-temporal regression
Abstract
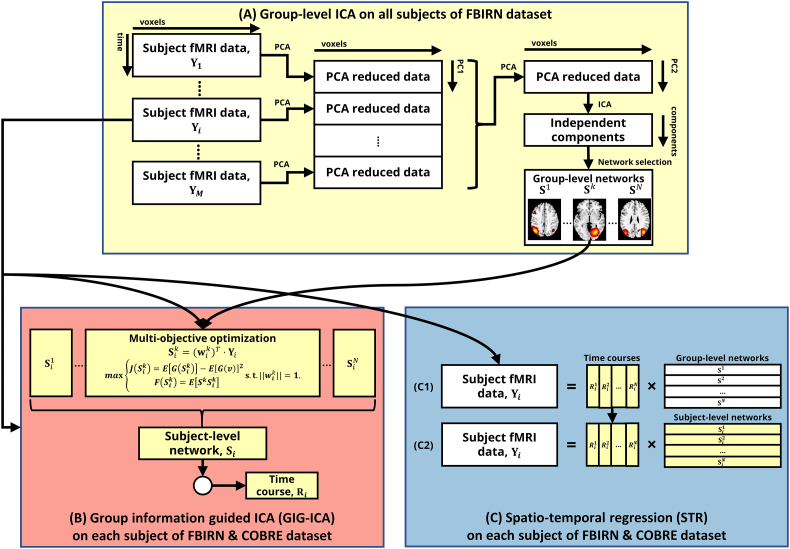
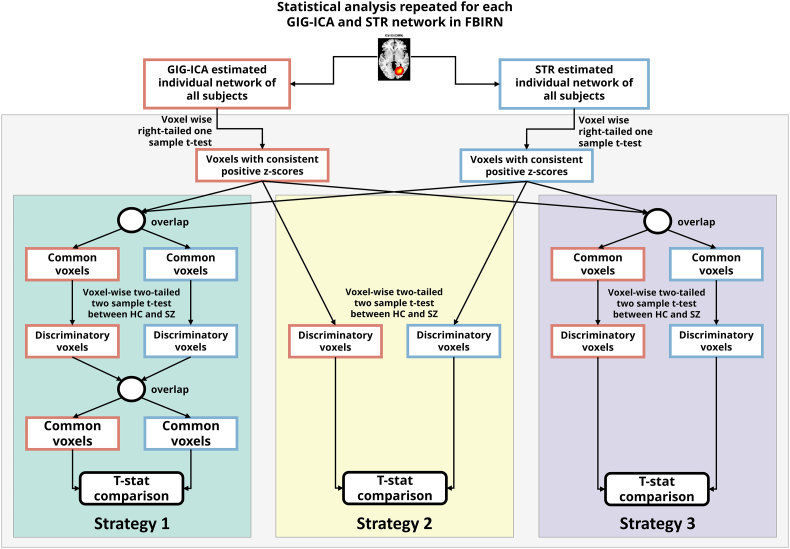
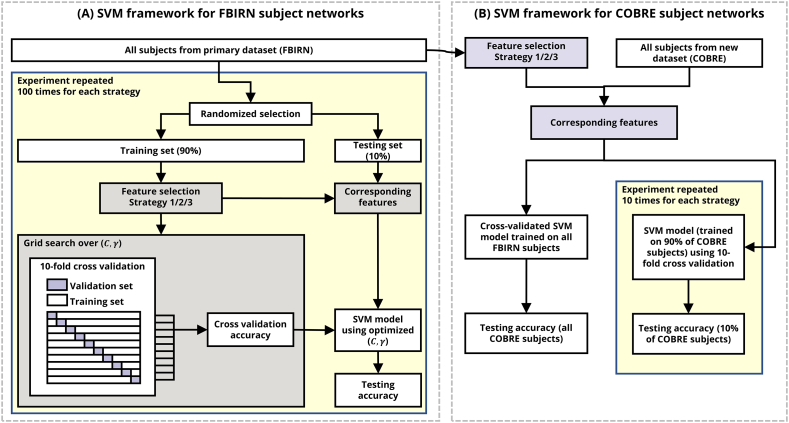
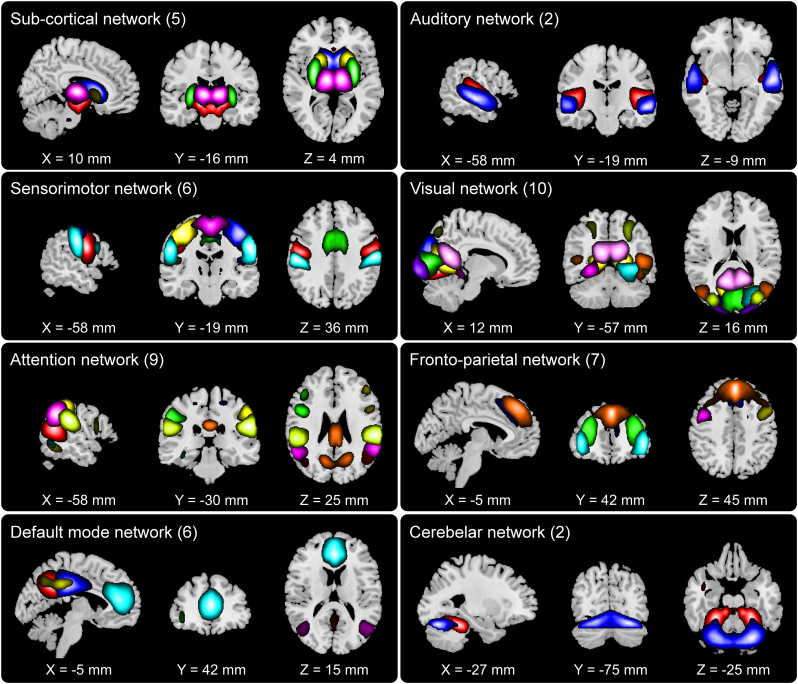
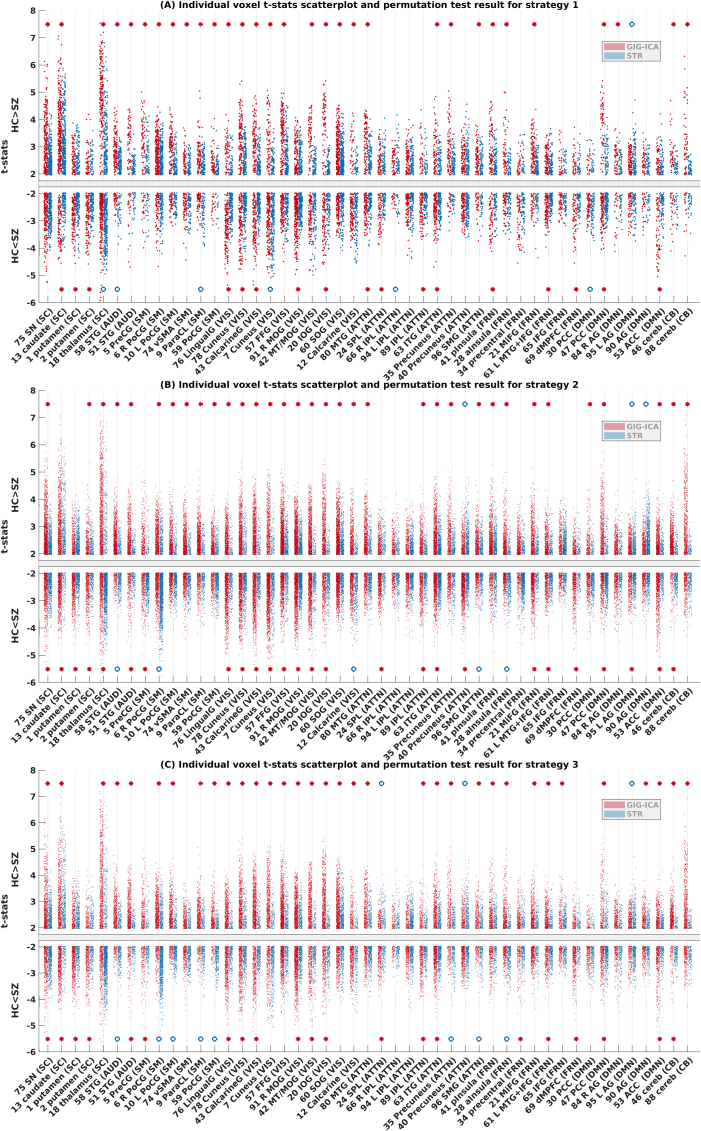
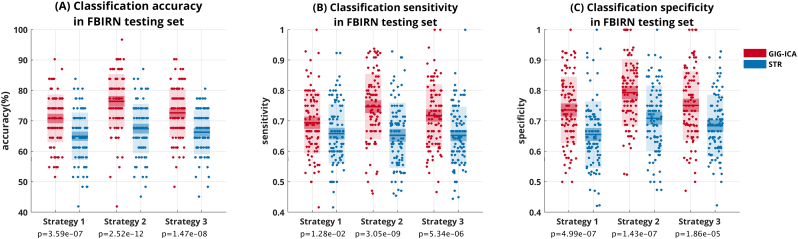
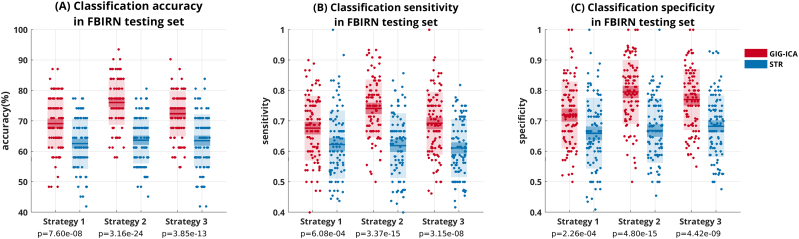
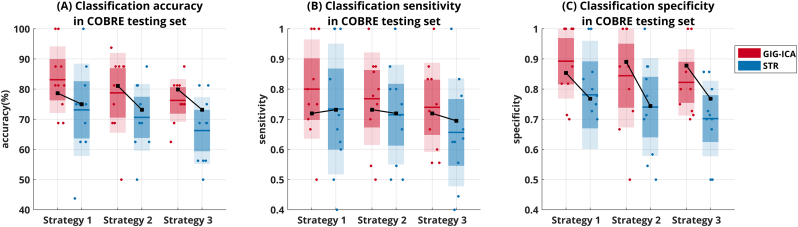
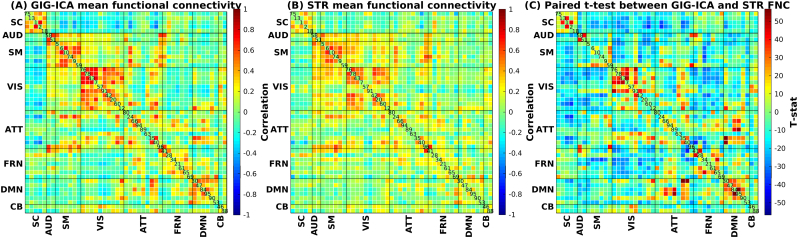
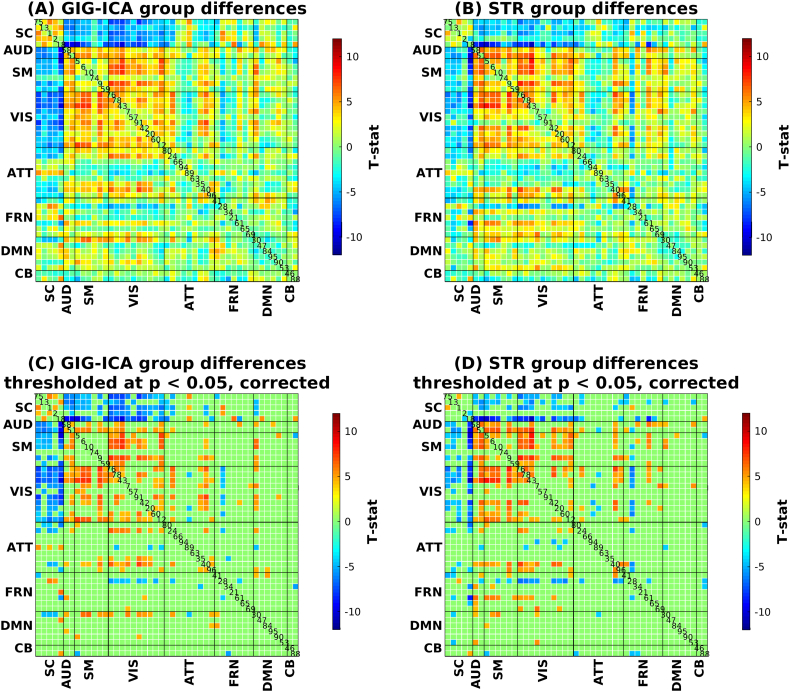
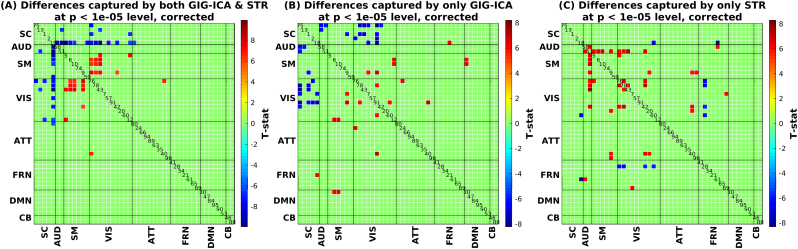
Brain functional networks identified from fMRI data can provide potential biomarkers for brain disorders. Group independent component analysis (GICA) is popular for extracting brain functional networks from multiple subjects. In GICA, different strategies exist for reconstructing subject-specific networks from the group-level networks. However, it is unknown whether these strategies have different sensitivities to group differences and abilities in distinguishing patients. Among GICA, spatio-temporal regression (STR) and spatially constrained ICA approaches such as group information guided ICA (GIG-ICA) can be used to propagate components (indicating networks) to a new subject that is not included in the original subjects. In this study, based on the same a priori network maps, we reconstructed subject-specific networks using these two methods separately from resting-state fMRI data of 151 schizophrenia patients (SZs) and 163 healthy controls (HCs). We investigated group differences in the estimated functional networks and the functional network connectivity (FNC) obtained by each method. The networks were also used as features in a cross-validated support vector machine (SVM) for classifying SZs and HCs. We selected features using different strategies to provide a comprehensive comparison between the two methods. GIG-ICA generally showed greater sensitivity in statistical analysis and better classification performance (accuracy 76.45 ± 8.9%, sensitivity 0.74 ± 0.11, specificity 0.79 ± 0.11) than STR (accuracy 67.45 ± 8.13%, sensitivity 0.65 ± 0.11, specificity 0.71 ± 0.11). Importantly, results were also consistent when applied to an independent dataset including 82 HCs and 82 SZs. Our work suggests that the functional networks estimated by GIG-ICA are more sensitive to group differences, and GIG-ICA is promising for identifying image-derived biomarkers of brain disease.
Keywords: Classification; Functional network; GIG-ICA; ICA; Schizophrenia; Spatio-temporal regression; fMRI.
Copyright © 2019 The Authors. Published by Elsevier Inc. All rights reserved.
Figures
Similar articles
-
Comparison of IVA and GIG-ICA in Brain Functional Network Estimation Using fMRI Data.Front Neurosci. 2017 May 19;11:267. doi: 10.3389/fnins.2017.00267. eCollection 2017. Front Neurosci. 2017. PMID: 28579940 Free PMC article.
-
Towards data-driven group inferences of resting-state fMRI data in rodents: Comparison of group ICA, GIG-ICA, and IVA-GL.J Neurosci Methods. 2022 Jan 15;366:109411. doi: 10.1016/j.jneumeth.2021.109411. Epub 2021 Nov 15. J Neurosci Methods. 2022. PMID: 34793852
-
Multi-model order spatially constrained ICA reveals highly replicable group differences and consistent predictive results from resting data: A large N fMRI schizophrenia study.Neuroimage Clin. 2023;38:103434. doi: 10.1016/j.nicl.2023.103434. Epub 2023 May 17. Neuroimage Clin. 2023. PMID: 37209635 Free PMC article.
-
The effect of preprocessing pipelines in subject classification and detection of abnormal resting state functional network connectivity using group ICA.Neuroimage. 2017 Jan 15;145(Pt B):365-376. doi: 10.1016/j.neuroimage.2016.03.038. Epub 2016 Mar 23. Neuroimage. 2017. PMID: 27033684 Free PMC article. Review.
-
Multisubject independent component analysis of fMRI: a decade of intrinsic networks, default mode, and neurodiagnostic discovery.IEEE Rev Biomed Eng. 2012;5:60-73. doi: 10.1109/RBME.2012.2211076. IEEE Rev Biomed Eng. 2012. PMID: 23231989 Free PMC article. Review.
Cited by
-
Distinct thalamocortical network dynamics are associated with the pathophysiology of chronic low back pain.Nat Commun. 2020 Aug 7;11(1):3948. doi: 10.1038/s41467-020-17788-z. Nat Commun. 2020. PMID: 32769984 Free PMC article.
-
Ability of an altered functional coupling between resting-state networks to predict behavioral outcomes in subcortical ischemic stroke: A longitudinal study.Front Aging Neurosci. 2022 Sep 15;14:933567. doi: 10.3389/fnagi.2022.933567. eCollection 2022. Front Aging Neurosci. 2022. PMID: 36185473 Free PMC article.
-
Construction of embedded fMRI resting-state functional connectivity networks using manifold learning.Cogn Neurodyn. 2021 Aug;15(4):585-608. doi: 10.1007/s11571-020-09645-y. Epub 2020 Nov 3. Cogn Neurodyn. 2021. PMID: 34367362 Free PMC article.
-
Dynamic Resting-State Connectivity Differences in Eyes Open Versus Eyes Closed Conditions.Brain Connect. 2020 Nov;10(9):504-519. doi: 10.1089/brain.2020.0768. Epub 2020 Oct 28. Brain Connect. 2020. PMID: 32892633 Free PMC article.
-
A resting-state network comparison of combat-related PTSD with combat-exposed and civilian controls.Soc Cogn Affect Neurosci. 2019 Sep 30;14(9):933-945. doi: 10.1093/scan/nsz072. Soc Cogn Affect Neurosci. 2019. PMID: 31588508 Free PMC article.
References
-
- Allen E.A., Erhardt E.B., Damaraju E., Gruner W., Segall J.M., Silva R.F., Havlicek M., Rachakonda S., Fries J., Kalyanam R., Michael A.M., Caprihan A., Turner J.A., Eichele T., Adelsheim S., Bryan A.D., Bustillo J., Clark V.P., Feldstein Ewing S.W., Filbey F., Ford C.C., Hutchison K., Jung R.E., Kiehl K.A., Kodituwakku P., Komesu Y.M., Mayer A.R., Pearlson G.D., Phillips J.P., Sadek J.R., Stevens M., Teuscher U., Thoma R.J., Calhoun V.D. A baseline for the multivariate comparison of resting-state networks. Front. Syst. Neurosci. 2011;5:2. - PMC - PubMed
-
- Beckmann C.F., Smith S.M. Tensorial extensions of independent component analysis for multisubject FMRI analysis. NeuroImage. 2005;25:294–311. - PubMed
Publication types
MeSH terms
Grants and funding
LinkOut - more resources
Full Text Sources
Medical
Miscellaneous
