

Personalized transcranial alternating current stimulation (tACS) and physical therapy to treat motor and cognitive symptoms in Parkinson's disease: A randomized cross-over trial
- PMID: 30921609
- PMCID: PMC6439208
- DOI: 10.1016/j.nicl.2019.101768
Personalized transcranial alternating current stimulation (tACS) and physical therapy to treat motor and cognitive symptoms in Parkinson's disease: A randomized cross-over trial
Abstract
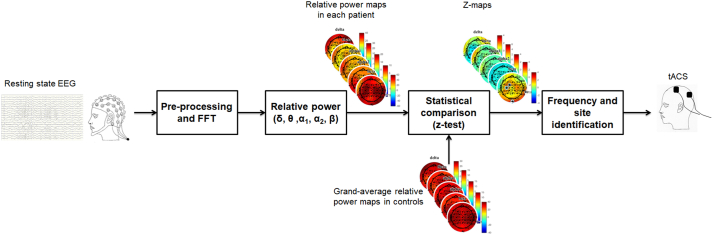
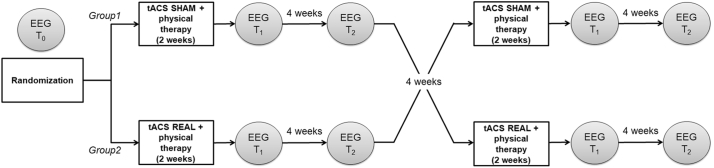
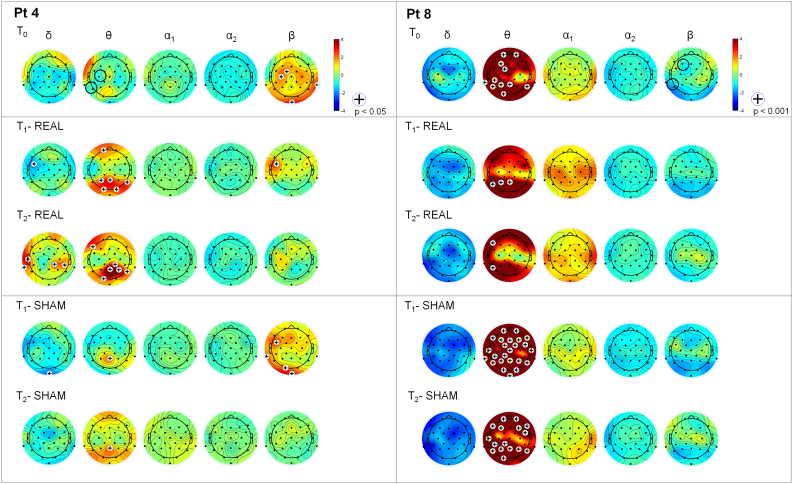
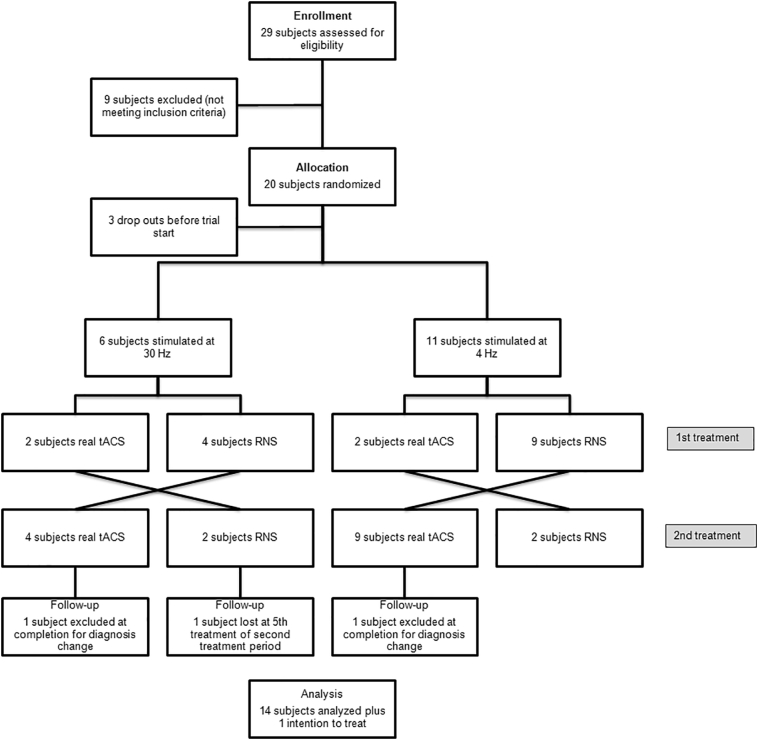
Abnormal cortical oscillations are markers of Parkinson's Disease (PD). Transcranial alternating current stimulation (tACS) can modulate brain oscillations and possibly impact on behaviour. Mapping of cortical activity (prevalent oscillatory frequency and topographic scalp distribution) may provide a personalized neurotherapeutic target and guide non-invasive brain stimulation. This is a cross-over, double blinded, randomized trial. Electroencephalogram (EEG) from participants with PD referred to Specialist Clinic, University Hospital, were recorded. TACS frequency and electrode position were individually defined based on statistical comparison of EEG power spectra maps with normative data from our laboratory. Stimulation frequency was set according to the EEG band displaying higher power spectra (with beta excess on EEG map, tACS was set at 4 Hz; with theta excess, tACS was set at 30 Hz). Participants were randomized to tACS or random noise stimulation (RNS), 5 days/week for 2-weeks followed by ad hoc physical therapy. EEG, motor (Unified Parkinson's Disease Rating Scale-motor: UPDRS III), neuropsychological (frontal, executive and memory tests) performance and mood were measured before (T0), after (T1) and 4-weeks after treatment (T2). A linear model with random effects and Wilcoxon test were used to detect differences. Main results include a reduction of beta rhythm in theta-tACS vs. RNS group at T1 over right sensorimotor area (p = .014) and left parietal area (p = .010) and at T2 over right sensorimotor area (p = .004) and left frontal area (p = .039). Bradykinesia items improved at T1 (p = .002) and T2 (p = .047) compared to T0 in the tACS group. In the tACS group the Montréal Cognitive Assessment (MoCA) improved at T2 compared with T1 (p = .049). Individualized tACS in PD improves motor and cognitive performance. These changes are associated with a reduction of excessive fast EEG oscillations.
Keywords: Electroencephalography; Neurophysiology; Neurotherapeutic target; Non-invasive brain stimulation (NIBS); Unified Parkinson's disease rating scale (UPDRS III).
Copyright © 2019 The Authors. Published by Elsevier Inc. All rights reserved.
Figures
References
-
- Abbruzzese G., Marchese R., Avanzino L., Pelosin E. Rehabilitation for Parkinson's disease: current outlook and future challenges. Park. Relat. Disord. 2016;22(Suppl. 1):S60–S64. - PubMed
-
- Beck A.T., Steer R.A., Brown G.K. Psychological Corporation; San Antonio, TX: 1996. Manual for the Beck Depression Inventory-II.
-
- Brandt J. The Hopkins verbal learning test: development of a new memory test with six equivalent forms. Clin. Neuropsychol. 1991;5(2):125–142.
Publication types
MeSH terms
LinkOut - more resources
Full Text Sources
Medical
