

Modeling grey matter atrophy as a function of time, aging or cognitive decline show different anatomical patterns in Alzheimer's disease
- PMID: 30921610
- PMCID: PMC6439228
- DOI: 10.1016/j.nicl.2019.101786
Modeling grey matter atrophy as a function of time, aging or cognitive decline show different anatomical patterns in Alzheimer's disease
Abstract
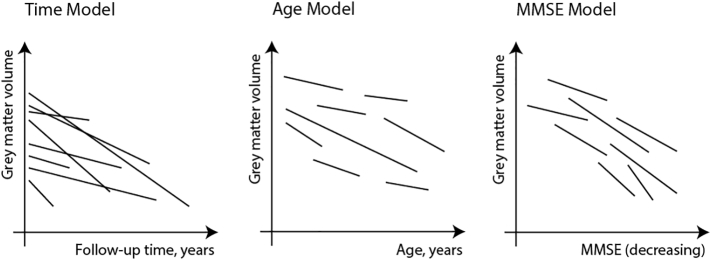
Background: Grey matter (GM) atrophy in Alzheimer's disease (AD) is most commonly modeled as a function of time. However, this approach does not take into account inter-individual differences in initial disease severity or changes due to aging. Here, we modeled GM atrophy within individuals across the AD clinical spectrum as a function of time, aging and MMSE, as a proxy for disease severity, and investigated how these models influence estimates of GM atrophy.
Methods: We selected 523 individuals from ADNI (100 preclinical AD, 288 prodromal AD, 135 AD dementia) with abnormal baseline amyloid PET/CSF and ≥1 year of MRI follow-up. We calculated total and 90 regional GM volumes for 2281 MRI scans (median [IQR]; 4 [3-5] scans per individual over 2 [1.6-4] years) and used linear mixed models to investigate atrophy as a function of time, aging and decline on MMSE. Analyses included clinical stage as interaction with the predictor and were corrected for baseline age, sex, education, field strength and total intracranial volume. We repeated analyses for a sample of participants with normal amyloid (n = 387) to assess whether associations were specific for amyloid pathology.
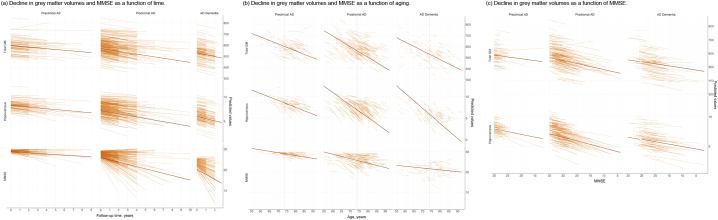
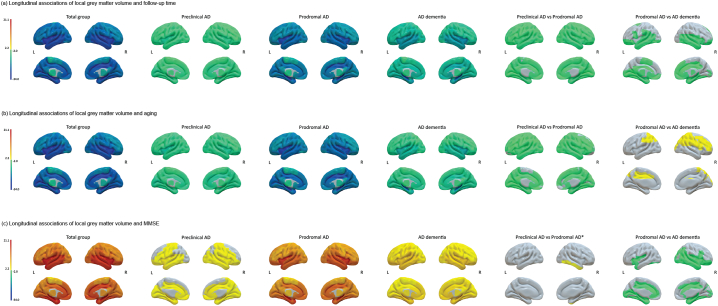
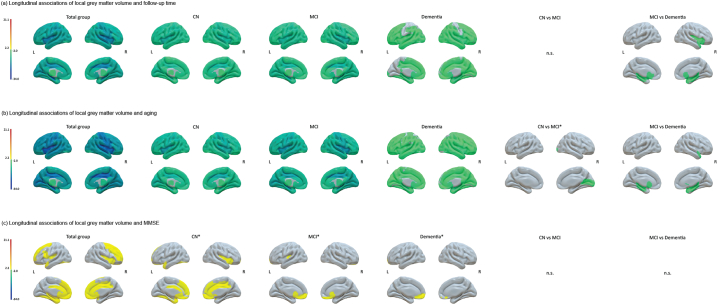
Results: Using time or aging as predictors, amyloid abnormal participants annually declined -1.29 ± 0.08 points and - 0.28 ± 0.03 points respectively on the MMSE and -12.23 ± 0.47 cm3 and -8.87 ± 0.34 respectively in total GM volume (p < .001). For the time and age models atrophy was widespread and preclinical and prodromal AD showed similar atrophy patterns. Comparing prodromal AD to AD dementia, AD dementia showed faster atrophy mostly in temporal lobes as modeled with time, while prodromal AD showed faster atrophy in mostly frontoparietal areas as modeled with age (pFDR < 0.05). Modeling change in GM volume as a function of decline on MMSE, slopes were less steep compared to those based on time and aging (-4.1 ± 0.25 cm3 per MMSE point decline; p < .001) and showed steeper atrophy for prodromal AD compared to preclinical AD in the right inferior temporal gyrus (p < .05) and compared to AD dementia mostly in temporal areas (pFDR < 0.05). Associations with time, aging and MMSE remained when accounting for these effects in the other models, suggesting that all measures explain part of the variance in GM atrophy. Repeating analyses in amyloid normal individuals, effects for time and aging showed similar widespread anatomical patterns, while associations with MMSE were largely reduced.
Conclusion: Effects of time, aging and MMSE all explained variance in GM atrophy slopes within individuals. Associations with MMSE were weaker than those for time or age, but specific for amyloid pathology. This suggests that at least some of the atrophy observed in time or age models may not be specific to AD.
Keywords: Aging; Alzheimer's disease; Amyloid; Atrophy; Cognition; Longitudinal.
Copyright © 2019 The Authors. Published by Elsevier Inc. All rights reserved.
Figures
Similar articles
-
Longitudinal structural cerebral changes related to core CSF biomarkers in preclinical Alzheimer's disease: A study of two independent datasets.Neuroimage Clin. 2018 Apr 16;19:190-201. doi: 10.1016/j.nicl.2018.04.016. eCollection 2018. Neuroimage Clin. 2018. PMID: 30023169 Free PMC article.
-
Associations between quantitative [18F]flortaucipir tau PET and atrophy across the Alzheimer's disease spectrum.Alzheimers Res Ther. 2019 Jul 4;11(1):60. doi: 10.1186/s13195-019-0510-3. Alzheimers Res Ther. 2019. PMID: 31272512 Free PMC article.
-
Association of short-term cognitive decline and MCI-to-AD dementia conversion with CSF, MRI, amyloid- and 18F-FDG-PET imaging.Neuroimage Clin. 2019;22:101771. doi: 10.1016/j.nicl.2019.101771. Epub 2019 Mar 13. Neuroimage Clin. 2019. PMID: 30927601 Free PMC article.
-
Characterizing the preclinical stages of Alzheimer's disease and the prospect of presymptomatic intervention.J Alzheimers Dis. 2013;33 Suppl 1(0 1):S405-16. doi: 10.3233/JAD-2012-129026. J Alzheimers Dis. 2013. PMID: 22695623 Free PMC article. Review.
-
Cerebral Volumetric Correlates of Apathy in Alzheimer's Disease and Cognitively Normal Older Adults: Meta-Analysis, Label-Based Review, and Study of an Independent Cohort.J Alzheimers Dis. 2022;85(3):1251-1265. doi: 10.3233/JAD-215316. J Alzheimers Dis. 2022. PMID: 34924392 Free PMC article.
Cited by
-
Modulation of Brain Activity and Functional Connectivity by Acupuncture Combined With Donepezil on Mild-to-Moderate Alzheimer's Disease: A Neuroimaging Pilot Study.Front Neurol. 2022 Jul 11;13:912923. doi: 10.3389/fneur.2022.912923. eCollection 2022. Front Neurol. 2022. PMID: 35899271 Free PMC article.
-
Early Alzheimer's disease-like reductions in gray matter and cognitive function with aging in nonhuman primates.Alzheimers Dement (N Y). 2022 Mar 13;8(1):e12284. doi: 10.1002/trc2.12284. eCollection 2022. Alzheimers Dement (N Y). 2022. PMID: 35310523 Free PMC article.
-
Progressive structural and covariance connectivity abnormalities in patients with Alzheimer's disease.Front Aging Neurosci. 2023 Jan 6;14:1064667. doi: 10.3389/fnagi.2022.1064667. eCollection 2022. Front Aging Neurosci. 2023. PMID: 36688148 Free PMC article.
-
Age- and cognition-related differences in the gray matter volume of the chimpanzee brain (Pan troglodytes): A voxel-based morphometry and conjunction analysis.Am J Primatol. 2021 Nov;83(11):e23264. doi: 10.1002/ajp.23264. Epub 2021 Apr 26. Am J Primatol. 2021. PMID: 33899958 Free PMC article.
-
Gray Matter Deterioration Pattern During Alzheimer's Disease Progression: A Regions-of-Interest Based Surface Morphometry Study.Front Aging Neurosci. 2021 Feb 3;13:593898. doi: 10.3389/fnagi.2021.593898. eCollection 2021. Front Aging Neurosci. 2021. PMID: 33613265 Free PMC article.
References
-
- Bateman R.J., Xiong C., Benzinger T.L., Fagan A.M., Goate A., Fox N.C., Marcus D.S., Cairns N.J., Xie X., Blazey T.M., Holtzman D.M., Santacruz A., Buckles V., Oliver A., Moulder K., Aisen P.S., Ghetti B., Klunk W.E., McDade E., Martins R.N., Masters C.L., Mayeux R., Ringman J.M., Rossor M.N., Schofield P.R., Sperling R.A., Salloway S., Morris J.C., Dominantly Inherited Alzheimer N. Clinical and biomarker changes in dominantly inherited Alzheimer's disease. N. Engl. J. Med. 2012;367(9):795–804. - PMC - PubMed
-
- Bates D., Machler M., Bolker B.M., Walker S.C. Fitting linear mixed-effects models using lme4. J. Stat. Softw. 2015;67(1):1–48.
-
- Benjamini Y., Hochberg Y. Controlling the false discovery rate – a practical and powerful approach to multiple testing. J. R. Stat. Soc. B Met. 1995;57(1):289–300.
Publication types
MeSH terms
Substances
Grants and funding
LinkOut - more resources
Full Text Sources
Medical
