. 2019:22:101751.
doi: 10.1016/j.nicl.2019.101751. Epub 2019 Mar 16.

Thalamo-cortical network hyperconnectivity in preclinical progranulin mutation carriers

Affiliations

Thalamo-cortical network hyperconnectivity in preclinical progranulin mutation carriers

Suzee E Lee et al. Neuroimage Clin. 2019.

Abstract

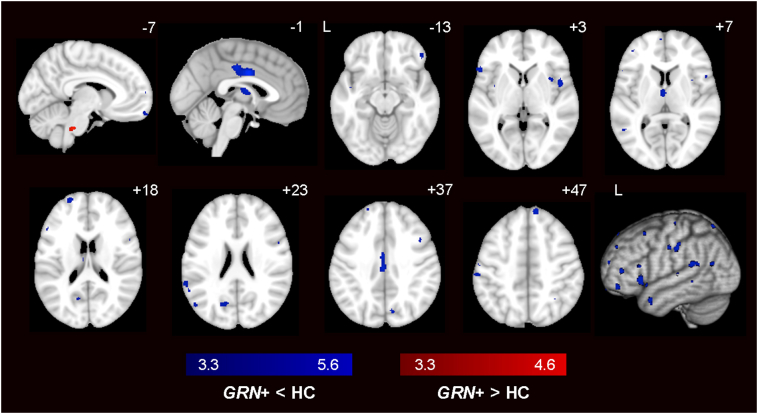
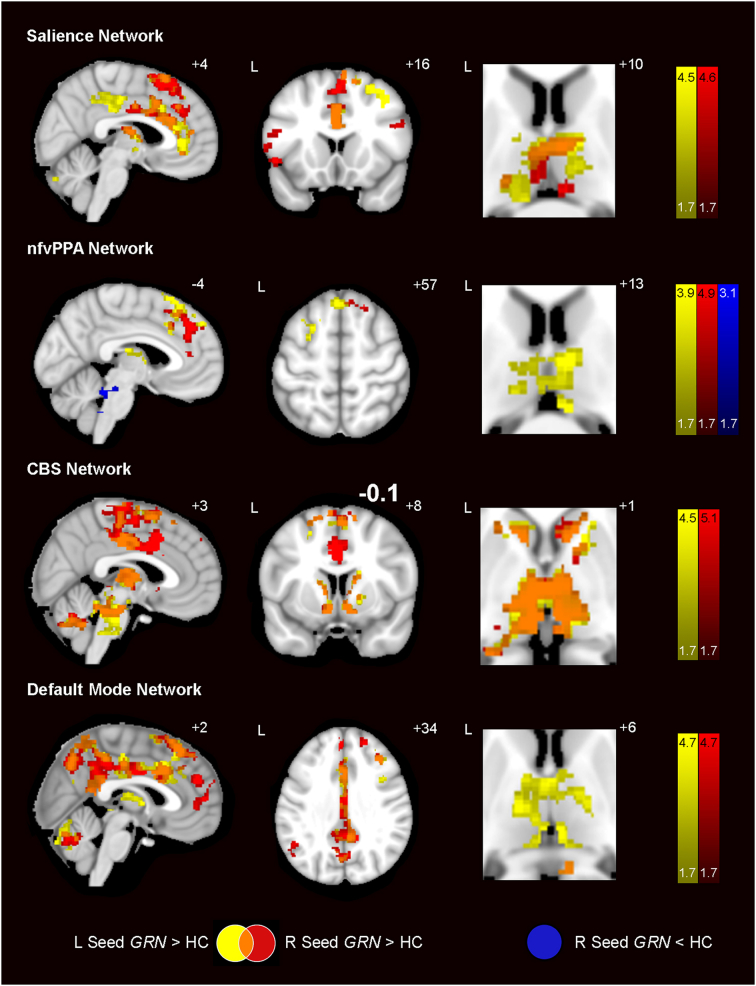
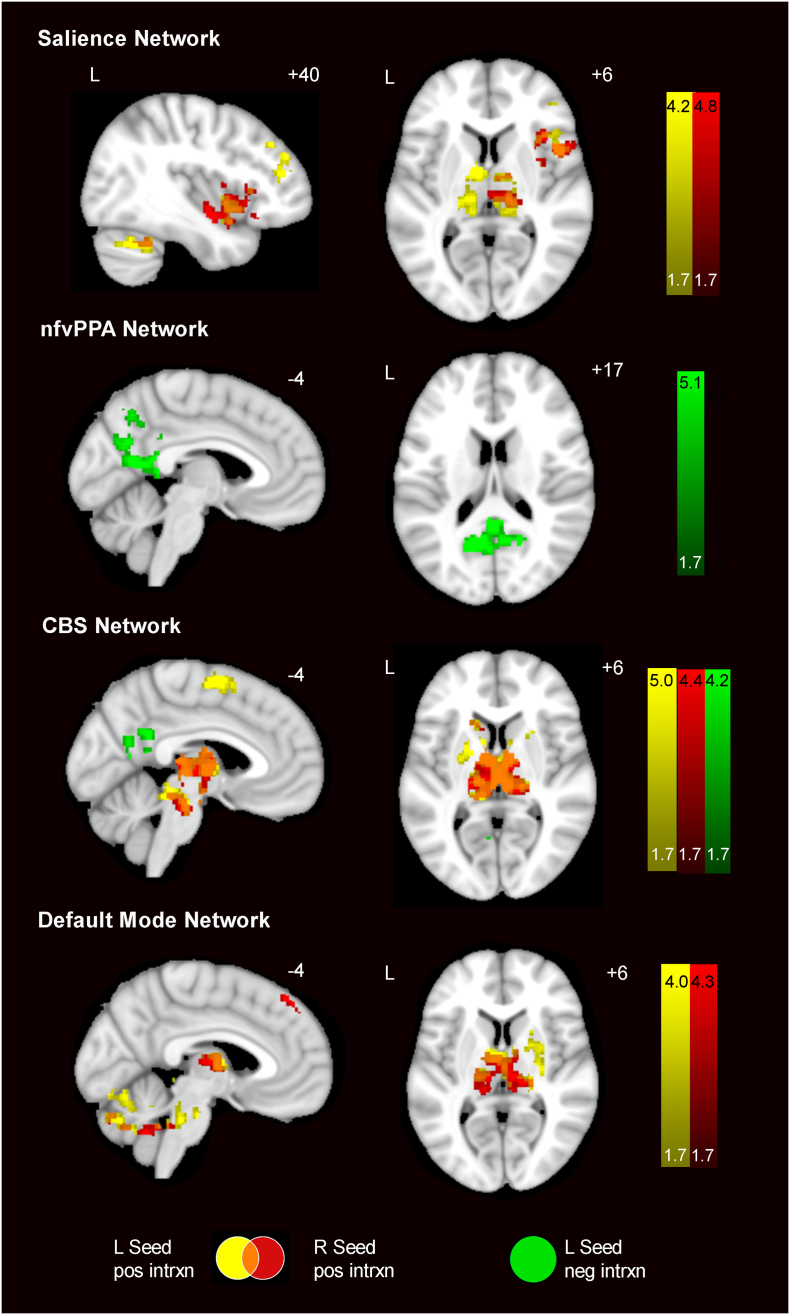
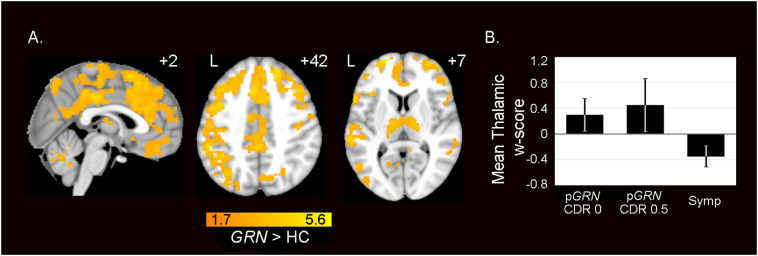
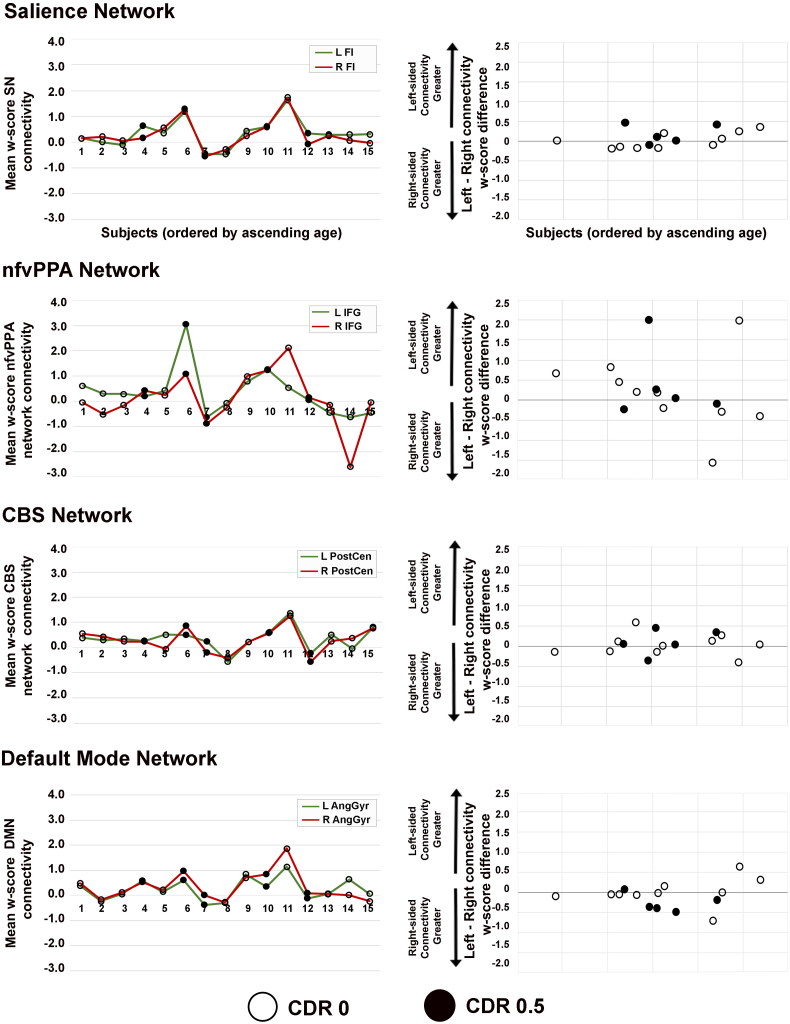
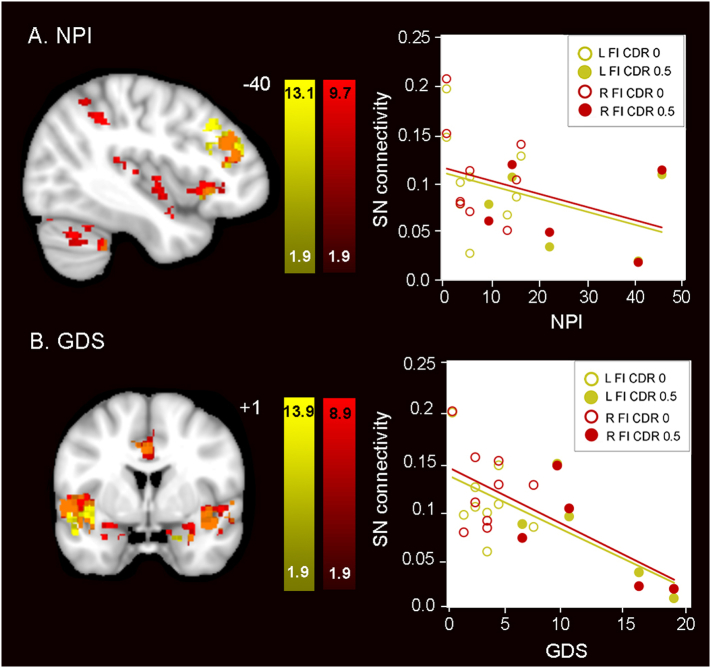
Mutations in progranulin (GRN) cause heterogeneous clinical syndromes, including behavioral variant frontotemporal dementia (bvFTD), primary progressive aphasia (PPA), corticobasal syndrome (CBS) and Alzheimer-type dementia (AD-type dementia). Human studies have shown that presymptomatic GRN carriers feature reduced connectivity in the salience network, a system targeted in bvFTD. Mice with homozygous deletion of GRN, in contrast, show thalamo-cortical hypersynchrony due to aberrant pruning of inhibitory synapses onto thalamo-cortical projection neurons. No studies have systematically explored the intrinsic connectivity networks (ICNs) targeted by the four GRN-associated clinical syndromes, or have forged clear links between human and mouse model findings. We compared 17 preclinical GRN carriers (14 "presymptomatic" clinically normal and three "prodromal" with mild cognitive symptoms) to healthy controls to assess for differences in cognitive testing and gray matter volume. Using task-free fMRI, we assessed connectivity in the salience network, a non-fluent variant primary progressive aphasia network (nfvPPA), the perirolandic network (CBS), and the default mode network (AD-type dementia). GRN carriers and controls showed similar performance on cognitive testing. Although carriers showed little evidence of brain atrophy, markedly enhanced connectivity emerged in all four networks, and thalamo-cortical hyperconnectivity stood out as a unifying feature. Voxelwise assessment of whole brain degree centrality, an unbiased graph theoretical connectivity metric, confirmed thalamic hyperconnectivity. These results show that human GRN disease and the prevailing GRN mouse model share a thalamo-cortical network hypersynchrony phenotype. Longitudinal studies will determine whether this network physiology represents a compensatory response as carriers approach symptom onset, or an early and sustained preclinical manifestation of lifelong progranulin haploinsufficiency.

Keywords: Frontotemporal dementia; GRN; MRI; Progranulin; Thalamus.


Figures

Fig. 1
Fig. 1
Voxel-based morphometry in preclinical GRN carriers vs. HC. Group difference maps showed reduced gray matter in midcingulate cortex, dorsolateral prefrontal cortex, and insula in 17 preclinical GRN carriers when compared with 30 HC (dark blue) at p < 0.001 uncorrected. Only a small pons cluster emerged from the GRN > HC analysis (red). No significant differences were detected at pFWE < 0.05. Color bars represent t-scores, and statistical maps are superimposed on the Montreal Neurological Institute template brain. The left side of the axial and coronal images corresponds to the left side of the brain. (For interpretation of the references to color in this figure legend, the reader is referred to the web version of this article.)
Fig. 2
Fig. 2
Prominent hyperconnectivity across vulnerable networks in preclinical GRN. Group difference maps show widespread regions of increased intrinsic connectivity in 15 preclinical GRN compared with 30 HC for all four networks studied. Seeds placed in the left (yellow) and right (red) hemispheres resulted in overlapping ICN increases (orange). All four ICNs showed thalamic hyperconnectivity. Only the nfvPPA network showed ICN decreases, which appeared as sparse regions in the brainstem (dark blue). Analyses were thresholded using joint probability distribution thresholding with a joint height and extent threshold of p < 0.05 corrected for multiple comparisons. Color bars represent t- scores, and statistical maps are on the Montreal Neurological Institute template brain. The left side of the axial and coronal images corresponds to the left side of the brain. (For interpretation of the references to color in this figure legend, the reader is referred to the web version of this article.)
Fig. 3
Fig. 3
ICN connectivity changes associated with increasing age. Colored regions depict the interaction between age and gene status on ICN connectivity for four networks. Preclinical GRN showed increasing connectivity with age in left-seeded (yellow) and right-seeded (red) ICNs increases, especially within the thalamus, in three of four networks. For the nfvPPA network and the CBS network, there were left-seeded (green) connectivity decreases with age. Analyses were thresholded using joint probability distribution thresholding with a joint height and extent threshold of p < 0.05 corrected for multiple comparisons. Color bars represent t- scores, and statistical maps are on the Montreal Neurological Institute template brain. The left side of the axial and coronal images corresponds to the left side of the brain. (For interpretation of the references to color in this figure legend, the reader is referred to the web version of this article.)
Fig. 4
Fig. 4
Preclinical GRN carriers show increased whole brain degree connectivity. (A) Group difference map demonstrates widespread increases in WBD centrality, a measure of overall regional connectivity, in preclinical GRN compared with HC. Analyses were thresholded using joint probability distribution thresholding with a joint height and extent threshold of p < 0.05 corrected for multiple comparisons. Color bars represent t- scores, and statistical maps are on the Montreal Neurological Institute template brain. The left side of the axial and coronal images corresponds to the left side of the brain. (B) Mean WBD w-score extracted from the thalamic preclinical GRN > HC difference map in A, shows WBD hyperconnectivity in preclinical GRN with CDR = 0 and preclinical GRN with CDR = 0.5 and reduced connectivity in symptomatic GRN carriers compared with controls. Error bars show 1 SEM. (For interpretation of the references to color in this figure legend, the reader is referred to the web version of this article.)
Fig. 5
Fig. 5
Individual subject plots of hemispheric ICN connectivity. Line plots in the left column show mean w-scores of ICN connectivity derived from a left-sided seed (green) and right-sided seed (red), which are shown for each preclinical GRN carrier ordered by ascending age on the x-axis. Dot plots in the right column display individual subject differences in ICN w-scores (left-sided seed ICN w-scores minus right-sided seed w-scores). Thus, a score of 0 on the y-axis indicates perfect symmetry of ICN connectivity w-scores for a given subject, and subjects with greater ICN asymmetry show a greater deviation from 0. Preclinical GRN carriers with CDR = 0 are depicted with black circles and those with CDR = 0.5 are shown as black dots. (For interpretation of the references to color in this figure legend, the reader is referred to the web version of this article.)
Fig. 6
Fig. 6
Higher neuropsychiatric symptoms and depression scores correlate with lower salience network connectivity in preclinical GRN. (A) NPI and (B) GDS total scores correlated with reduced salience network connectivity in preclinical GRN. In the left column, weaker connectivity of the left (yellow) and the right (red) frontoinsula seeds to the voxels shown predicted greater (A) neuropsychiatric symptom severity and (B) depression severity. In the right column, salience network mean connectivity beta values were extracted from the maps at left and plotted vs. (A) NPI and (B) GDS total scores. Preclinical GRN CDR = 0 subjects are indicated as circles and preclinical GRN CDR = 0.5 subjects are indicated as dots. Results are displayed at a joint cluster and extent probability threshold of p < 0.05, corrected for multiple comparisons. Color bars represent t- scores, and statistical maps are on the Montreal Neurological Institute template brain. The left side of the axial and coronal images corresponds to the left side of the brain. (For interpretation of the references to color in this figure legend, the reader is referred to the web version of this article.)

References

    1. Alberici A., Archetti S., Pilotto A., Premi E., Cosseddu M., Bianchetti A., Semeraro F., Salvetti M., Muiesan M.L., Padovani A., Borroni B. Results from a pilot study on amiodarone administration in monogenic frontotemporal dementia with granulin mutation. Neurol. Sci. 2014;35:1215–1219. - PubMed
    1. Armstrong M.J., Litvan I., Lang A.E., Bak T.H., Bhatia K.P., Borroni B., Boxer A.L., Dickson D.W., Grossman M., Hallett M., Josephs K.A., Kertesz A., Lee S.E., Miller B.L., Reich S.G., Riley D.E., Tolosa E., Tröster A.I., Vidailhet M., Weiner W.J. Criteria for the diagnosis of corticobasal degeneration. Neurology. 2013;80:496–503. - PMC - PubMed
    1. Arrant A.E., Filiano A.J., Unger D.E., Young A.H., Roberson E.D. Restoring neuronal progranulin reverses deficits in a mouse model of frontotemporal dementia. Brain. 2017;140:1447–1465. - PMC - PubMed
    1. Baker M., Mackenzie I.R., Pickering-Brown S.M., Gass J., Rademakers R., Lindholm C., Snowden J., Adamson J., Sadovnick A.D., Rollinson S., Cannon A., Dwosh E., Neary D., Melquist S., Richardson A., Dickson D., Berger Z., Eriksen J., Robinson T., Zehr C., Dickey C.A., Crook R., McGowan E., Mann D., Boeve B., Feldman H., Hutton M. Mutations in progranulin cause tau-negative frontotemporal dementia linked to chromosome 17. Nature. 2006;442:916–919. - PubMed
    1. Borroni B., Alberici A., Cercignani M., Premi E., Serra L., Cerini C., Cosseddu M., Pettenati C., Turla M., Archetti S., Gasparotti R., Caltagirone C., Padovani A., Bozzali M. Granulin mutation drives brain damage and reorganization from preclinical to symptomatic FTLD. Neurobiol. Aging. 2012;33:2506–2520. - PubMed

Publication types

MeSH terms