. 2019;49(4):331-342.
doi: 10.1159/000499597. Epub 2019 Mar 28.

Canagliflozin Prevents Intrarenal Angiotensinogen Augmentation and Mitigates Kidney Injury and Hypertension in Mouse Model of Type 2 Diabetes Mellitus

Affiliations

Canagliflozin Prevents Intrarenal Angiotensinogen Augmentation and Mitigates Kidney Injury and Hypertension in Mouse Model of Type 2 Diabetes Mellitus

T Cooper Woods et al. Am J Nephrol. 2019.

Abstract

Background: Hypertension and renal injury are common complications of type 2 diabetes mellitus (T2DM). Hyperglycemia stimulates renal proximal tubular angiotensinogen (AGT) expression via elevated oxidative stress contributing to the development of high blood pressure and diabetic nephropathy. The sodium glucose cotransporter 2 (SGLT2) in proximal tubules is responsible for the majority of glucose reabsorption by renal tubules. We tested the hypothesis that SGLT2 inhibition with canagliflozin (CANA) prevents intrarenal AGT augmentation and ameliorates kidney injury and hypertension in T2DM.

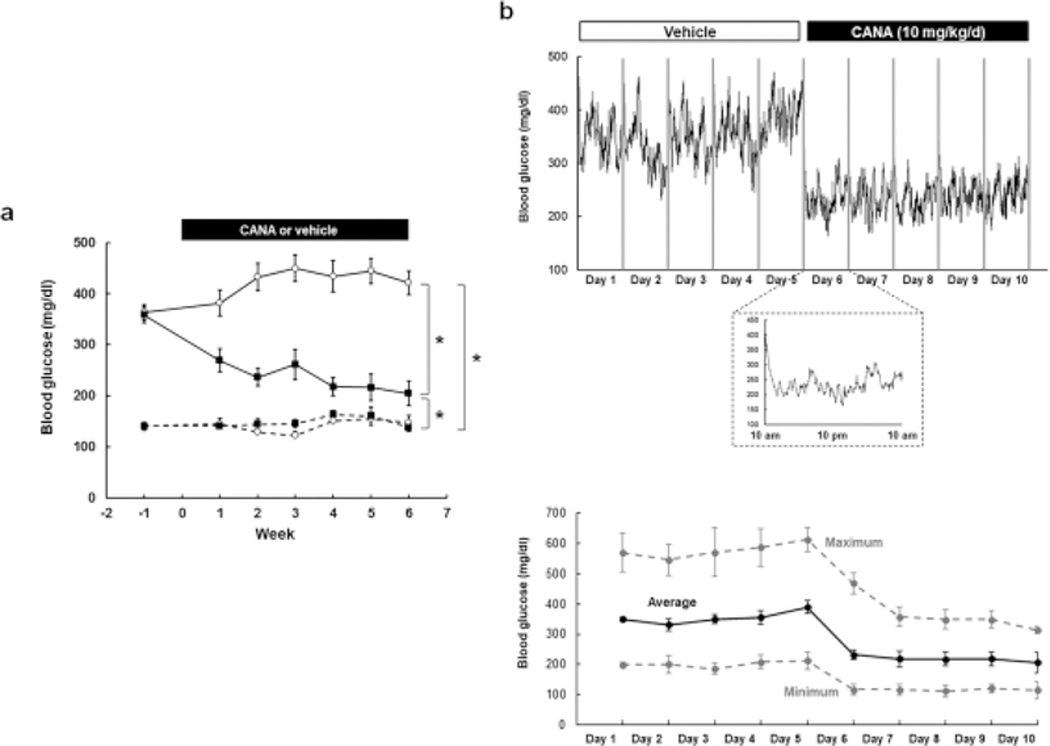
Methods: We induced T2DM in New Zealand obese mice with a high fat diet (DM, 30% fat) with control mice receiving regular fat diet (ND, 4% fat). When DM mice exhibited > 350 mg/dL blood glucose levels, both DM- and ND-fed mice were treated with 10 mg/kg/day CANA or vehicle by oral gavage for 6 weeks. We evaluated intrarenal AGT, blood pressure, and the development of kidney injury.

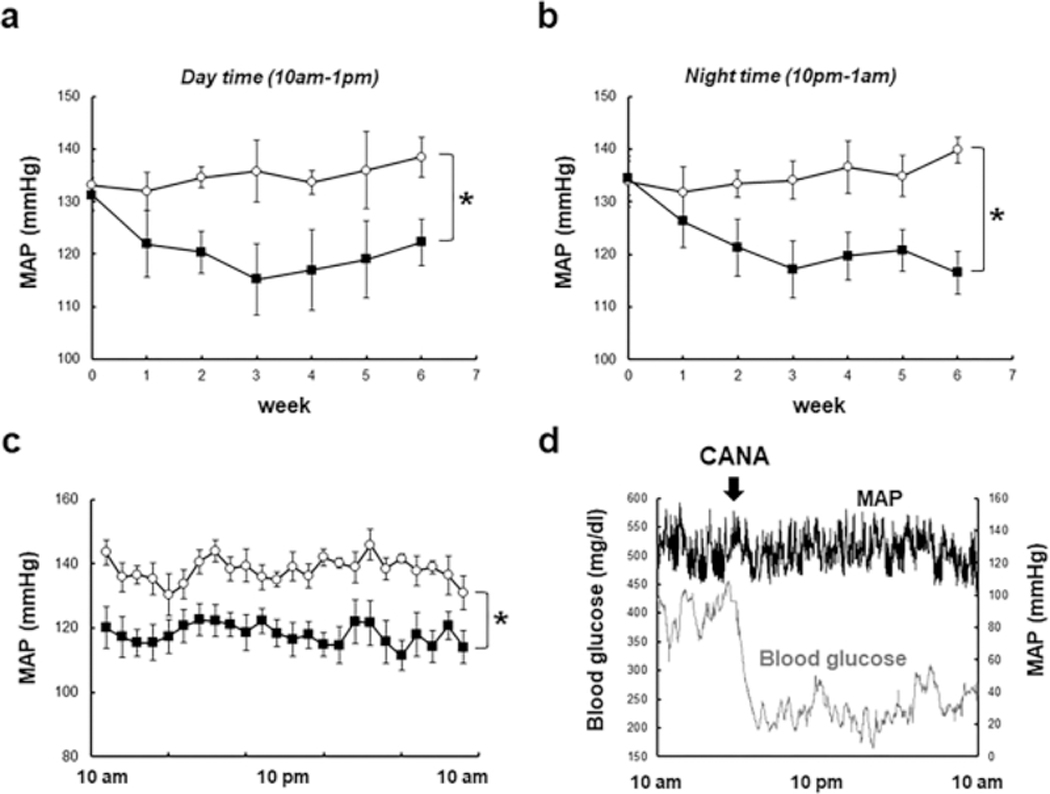
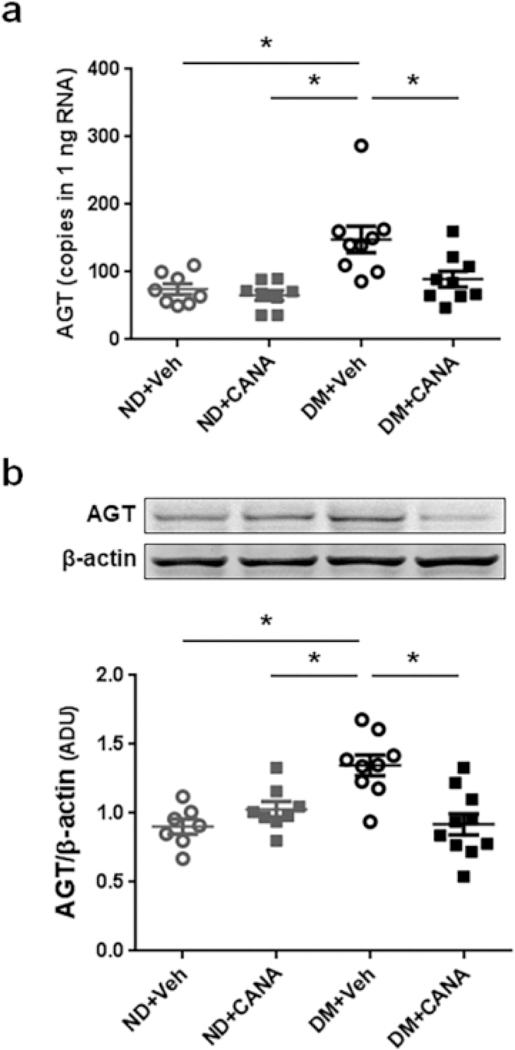
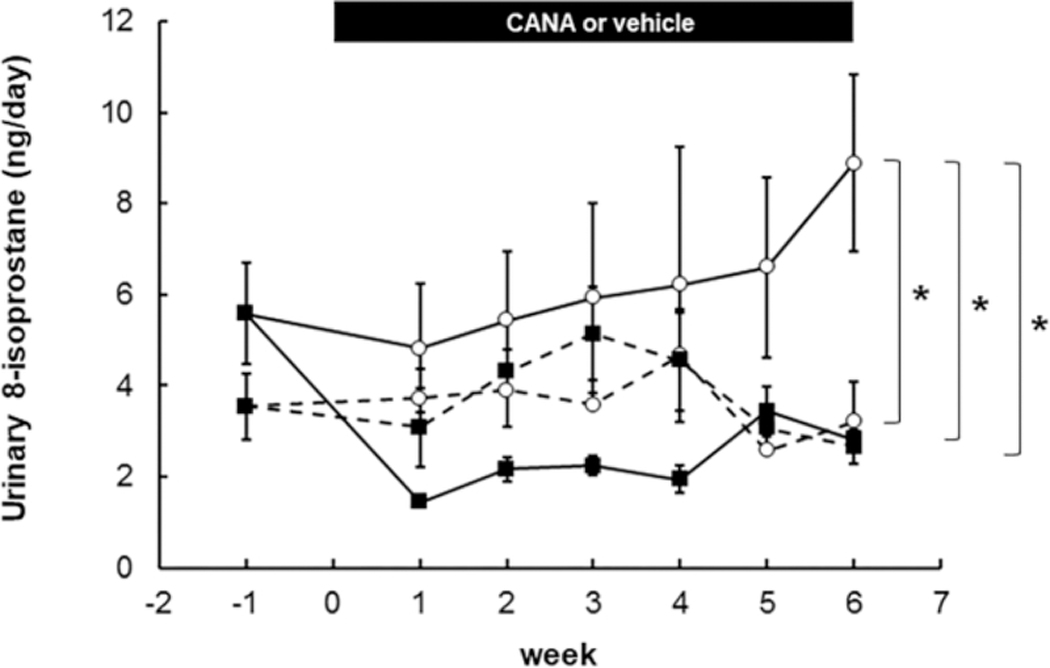
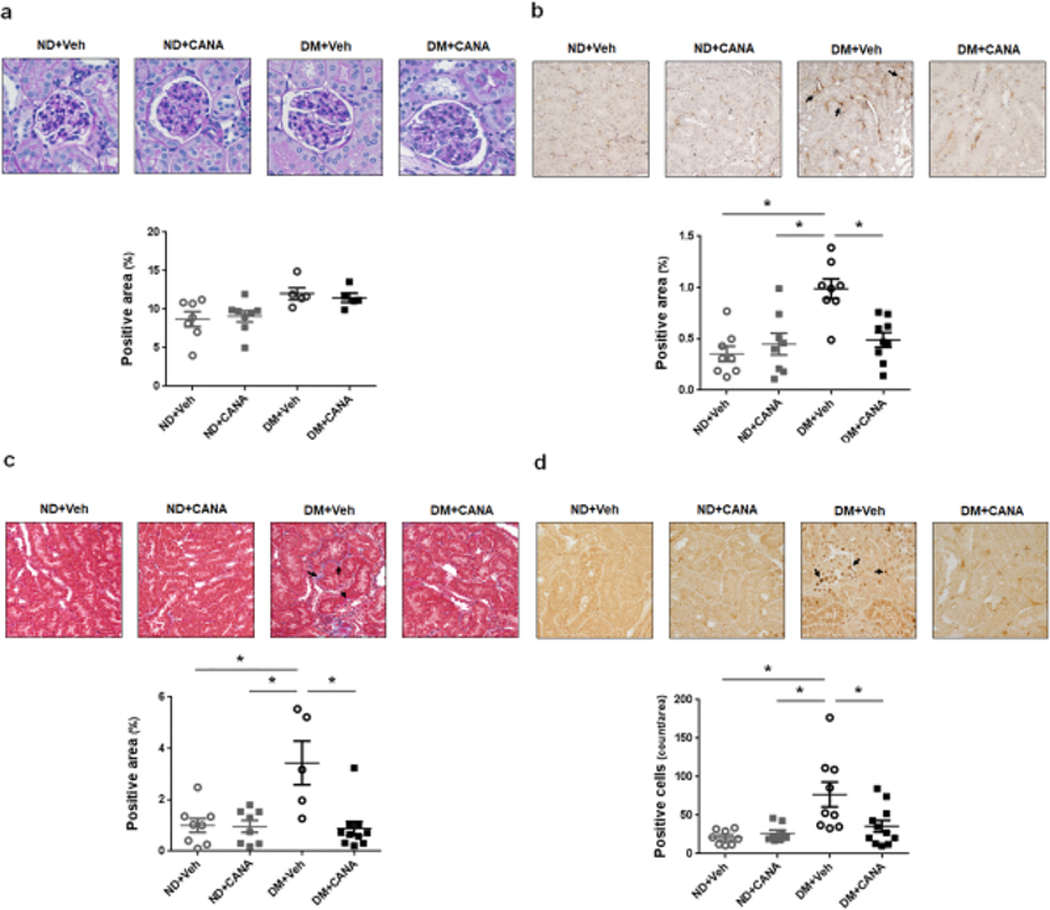
Results: Systolic blood pressure in DM mice (133.9 ± 2.0 mm Hg) was normalized by CANA (113.9 ± 4.0 mm Hg). CANA treatment ameliorated hyperglycemia-associated augmentation of renal AGT mRNA (148 ± 21 copies/ng RNA in DM, and 90 ± 16 copies/ng RNA in DM + CANA) and protein levels as well as elevation of urinary 8-isoprostane levels. Tubular fibrosis in DM mice (3.4 ± 0.9-fold, fibrotic score, ratio to ND) was suppressed by CANA (0.9 ± 0.3-fold). Furthermore, CANA attenuated DM associated increased macrophage infiltration and cell proliferation in kidneys of DM mice.

Conclusions: CANA prevents intrarenal AGT upregulation and oxidative stress and which may mitigate high blood pressure, renal tubular fibrosis, and renal inflammation in T2DM.

Keywords: Angiotensinogen; Blood pressure; Diabetes mellitus; Kidney; Sodium glucose cotransporter 2 inhibition.


Figures

Fig. 1.
Fig. 1.. Effects of CANA on hyperglycemia in T2DM mice
a Blood glucose levels measured by a glucose meter. ND+Veh: N=12, ND+CANA: N=11, DM+Veh: N=10–12, DM+CANA: N=14–16. Dotted lines show results in ND mice. Solid lines indicate results in DM mice. Open circles and closed squares are vehicle- and CANA-treated groups, respectively. b b Continuous recording of blood glucose in DM mice by a telemetry system. Average of blood glucose levels (N=5) measured by a telemetry system were plotted every one minute. Treatments were performed from 10:00 am - 10:30 am. The top panel shows changes in blood glucose levels during vehicle treatment (day 1–5) and CANA treatment (day6–10). The bottom panel shows changes in blood glucose levels on day 6. c Variation of blood glucose in DM mice. Average, maximum and minimum of blood glucose levels (N=5) measured by a telemetry system. Treatments were performed from 10:00 am – 10:30 am. The panel shows changes in blood glucose levels during vehicle treatment (day 1–5) and CANA treatment (day6–10).
Fig. 2.
Fig. 2.. Effects of CANA on blood pressure in T2DM mice
a-c. Blood pressure measured by a telemetry system. Panel a (day time) and b (night time) show changes in MAP. Panel c indicates MAP during 24 hours on week 6. Panel d shows comparison between acute responses of blood glucose levels (N=5) and MAP (N=5) to CANA treatment. Mean ± SE. N=4 in Vehicle group, N=5 in CANA group. Asterisk (p < 0.05) indicates significant difference between groups.
Fig. 3.
Fig. 3.. Effects of CANA on intrarenal AGT expression in T2DM mice
a and b Intrarenal AGT mRNA and protein levels, respectively. ND+Veh: N=8, ND+CANA: N=8, DM+Veh: N=9, DM+CANA: N=10. Mean ± SE. Asterisk (p < 0.05) indicates significant difference among groups. Mean ± SE. In both ND and DM groups, there are no significant changes by CANA.
Fig. 4.
Fig. 4.. Effects of CANA on renal oxidative stress in T2DM mice
ND+Veh: N=4–8, ND+CANA: N=5–8, DM+Veh: N= 5–8, DM+CANA: N=5–6. Dotted lines show results in ND mice. Solid lines indicate results in DM mice. Open circles and closed squares are vehicle- and CANA-treated groups, respectively. Mean ± SE. Asterisk (p < 0.05) indicates significant difference among groups.
Fig. 5.
Fig. 5.. Effects of CANA on kidney injury in T2DM mice
a. Mesangial expansion. ND+Veh: N=7, ND+CANA: N=8, DM+Veh: N=5, DM+CANA: N=5. Mean ± SE. There is no significant difference among groups. b. Renal monocyte/macrophage infiltration. Brown color indicates filtered monocytes and macrophages in the images. ND+Veh: N=8, ND+CANA: N=8, DM+Veh: N=8, DM+CANA: N=9. Mean ± SE. Asterisk (p < 0.05) indicates significant difference among groups. c. Renal tubular fibrosis. Blue color indicates renal tubular fibrotic areas in the images. ND+Veh: N=8, ND+CANA: N=8, DM+Veh: N=5, DM+CANA: N=10. Mean ± SE. Asterisk (p < 0.05) indicates significant difference among groups. d. Renal cell proliferation. Brown color indicates nuclei of proliferating cells. ND+Veh: N=8, ND+CANA: N=8, DM+Veh: N=10, DM+CANA: N=11. Mean ± SE. Asterisk (p < 0.05) indicates significant difference among groups.

Comment in

References

    1. Elmarakby AA, Abdelsayed R, Yao Liu J, Mozaffari MS: Inflammatory cytokines as predictive markers for early detection and progression of diabetic nephropathy. The EPMA journal, 1: 117–129, 2010. - PMC - PubMed
    1. Varga ZV, Giricz Z, Liaudet L, Hasko G, Ferdinandy P, Pacher P: Interplay of oxidative, nitrosative/nitrative stress, inflammation, cell death and autophagy in diabetic cardiomyopathy. Biochim Biophys Acta, 1852: 232–242, 2015. - PMC - PubMed
    1. Navar LG, Prieto MC, Satou R, Kobori H: Intrarenal angiotensin II and its contribution to the genesis of chronic hypertension. Current opinion in pharmacology, 11: 180–186, 2011. - PMC - PubMed
    1. Kobori H, Nangaku M, Navar LG, Nishiyama A: The intrarenal renin-angiotensin system: from physiology to the pathobiology of hypertension and kidney disease. Pharmacological reviews, 59: 251–287, 2007. - PubMed
    1. Miyata K, Ohashi N, Suzaki Y, Katsurada A, Kobori H: Sequential activation of the reactive oxygen species/angiotensinogen/renin-angiotensin system axis in renal injury of type 2 diabetic rats. Clin Exp Pharmacol Physiol, 35: 922–927, 2008. - PMC - PubMed

Publication types

MeSH terms