Review
. 2019 May;45(5):1056-1080.
doi: 10.1016/j.ultrasmedbio.2018.10.035. Epub 2019 Mar 26.

For Whom the Bubble Grows: Physical Principles of Bubble Nucleation and Dynamics in Histotripsy Ultrasound Therapy

Affiliations
Review

For Whom the Bubble Grows: Physical Principles of Bubble Nucleation and Dynamics in Histotripsy Ultrasound Therapy

Kenneth B Bader et al. Ultrasound Med Biol. 2019 May.

Abstract

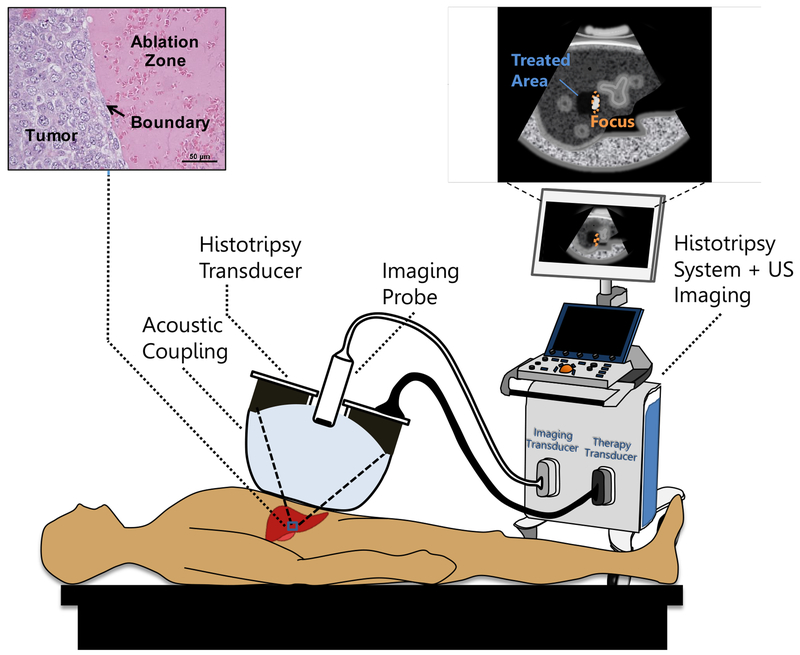
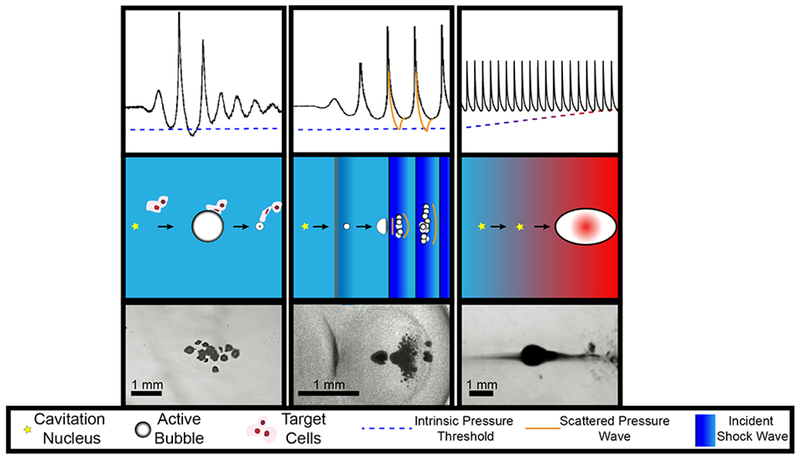
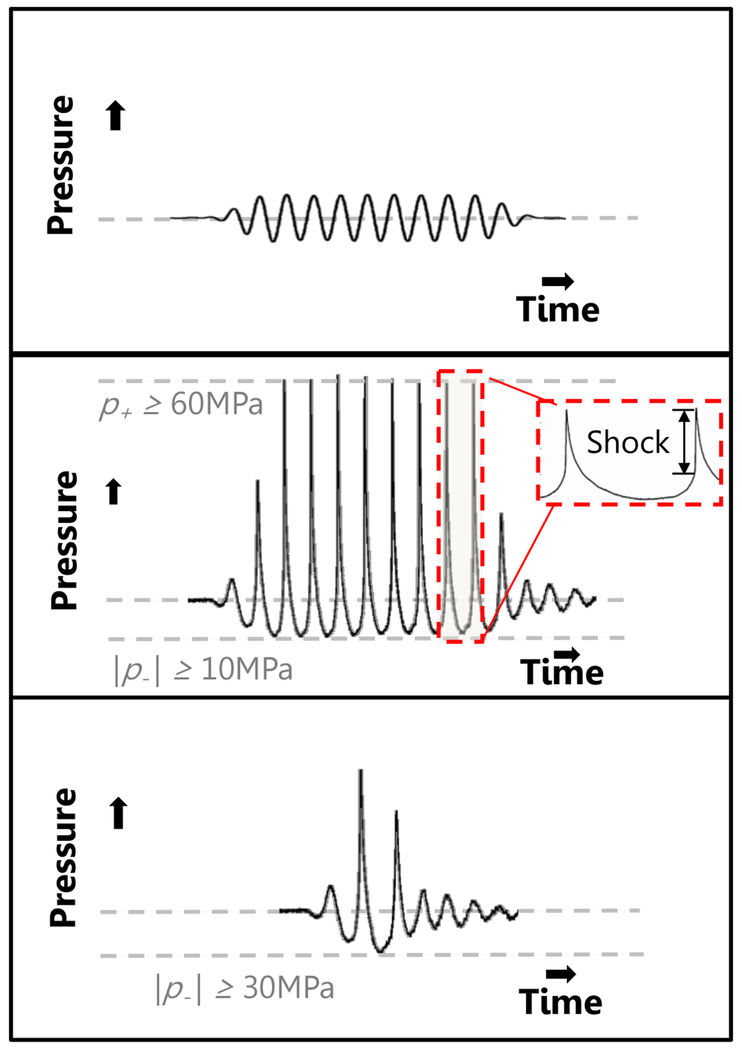
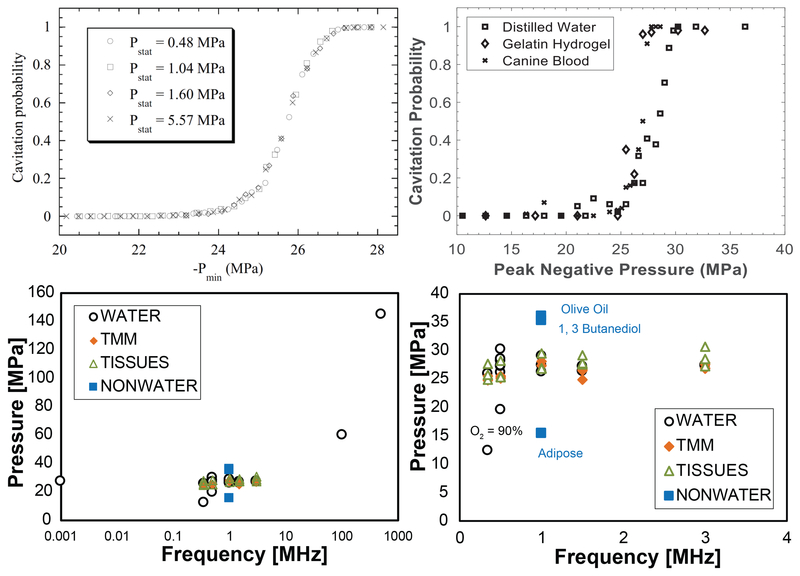
Histotripsy is a focused ultrasound therapy for non-invasive tissue ablation. Unlike thermally ablative forms of therapeutic ultrasound, histotripsy relies on the mechanical action of bubble clouds for tissue destruction. Although acoustic bubble activity is often characterized as chaotic, the short-duration histotripsy pulses produce a unique and consistent type of cavitation for tissue destruction. In this review, the action of histotripsy-induced bubbles is discussed. Sources of bubble nuclei are reviewed, and bubble activity over the course of single and multiple pulses is outlined. Recent innovations in terms of novel acoustic excitations, exogenous nuclei for targeted ablation and histotripsy-enhanced drug delivery and image guidance metrics are discussed. Finally, gaps in knowledge of the histotripsy process are highlighted, along with suggested means to expedite widespread clinical utilization of histotripsy.

Keywords: Ablation; Bubbles; Cavitation; Focused ultrasound; Histotripsy.


Conflict of interest statement

Disclosures of conflicts of interest

E. Vlaisavljevich is a consultant for HistoSonics (Ann Arbor, MI). A. Maxwell is a consultant and has financial interests with SonoMotion, Inc (South San Francisco, CA).

Figures

Fig. 1:
Fig. 1:
Conceptual illustration of a noninvasive histotripsy procedure. A focused ultrasound transducer is coupled to the patient through a confined water bolus attached to the transducer face. The transducer also contains an ultrasound (US) imaging probe for targeting and guidance. Both transducers are controlled by a combined imaging/therapy system. The transducer focus is positioned within the target tissue using US imaging guidance. When therapy is administered, bubbles appear on the US image as a hyperechoic region confined to the focus. Over a short time, the tissue is disintegrated into subcellular debris with a precise boundary. Once the tissue is ablated, it appears on imaging as a hypoechoic area indicating to the operator that treatment is complete.
Fig. 2:
Fig. 2:
Summary of histotripsy-induced cavitation dynamics. For all forms of histotripsy, nanoscale nuclei intrinsic to the medium are present in the tissue. Left Column: For intrinsic threshold insonations, the cavitation nucleus is activated with a single-cycle pulse with tension below the intrinsic medium threshold (left arrow, middle row). The expanded bubble then undergoes an inertial collapse under ambient pressure (right arrow, middle row). Middle Column: In shock-scattering histotripsy excitations, the activated nucleus grows slowly over the course of several cycles (left arrow, middle row) and deforms due to the incident shock waves (right arrow, middle row). Additional bubbles form spatially and temporally in regions of constructive interference between the incident wave, and waves scattered by the deformed bubble. Right column: In boiling histotripsy, shock-enhanced heating alters cavitation nucleus (left arrow, middle tow) to reduce the requisite tension for bubble formation (right arrow, middle row). For all forms of histotripsy, the expansion and contraction of the bubble imparts lethal strain on the cellular and extracellular components of the tissue in close proximity to the bubble (depicted in left column, middle row only). Representative frames from high speed videography of histotripsy-generated bubbles are shown in the bottom row. Note: Bubble sizes and nuclei in second row not to scale.
Fig. 3:
Fig. 3:
Focal pressure waveforms generated by a source in the linear (top panel) and nonlinear (bottom panel) regime with a 10-cycle pulse. A short pulse, such as that used in intrinsic-threshold histotripsy is shown in the middle panel. Note the highly asymmetric waveform in the middle and bottom panels, typical for focused sources due to the combined effects of diffraction and nonlinear propagation.
Fig. 4:
Fig. 4:
Cavitation probability vs. pulse peak negative pressure measured by Herbert et al. (2006) in water under different hydrostatic pressures (Top Left) and in several media by Maxwell et al. 2013 at 1 MHz (Top Right). These and other measurements suggest the probability for histotripsy-induced cavitation is greater than 0.5 for peak negative pressures greater than 26-30 MPa. (Bottom Left) Pressure in MPa to achieve a 50% cavitation probability or the minimum pressure required to initiate cavitation detectable via acoustic backscatter (Pmin) for different materials (Maxwell et al. 2013; Vlaisavljevich et al. 2015b). (Bottom Right) The same plot focused on frequencies of interest for most histotripsy applications. Top left panel is reprinted from Physical Review E, vol. 74, Herbert et al, Cavitation pressure in water, p. 041603 1-22, Copyright (2006), with permission from the American Physical Society.
Fig. 5:
Fig. 5:
Blake threshold as a function of bubble nucleus radius and surface tension. The resonant frequency, calculated in the absence of viscosity and elasticity, of the bubble nuclei are noted in the dashed, blue lines.
Fig. 6:
Fig. 6:
Bubbles generated by a one cycle histotripsy pulse using a 500 kHz array transducer in an agar phantom as a function of peak negative pressure. Reprinted from Physics in Medicine and Biology, vol. 62, Vlaisavljevich et al, Effects of f-number on the histotripsy intrinsic threshold and cavitation bubble cloud behavior, p. 1269, Copyright (2017), doi.org/10.1088/1361-6560/aa54c7. © Institute of Physics and Engineering in Medicine. Reproduced by permission of IOP Publishing. All rights reserved.
Fig. 7:
Fig. 7:
(Left) Initiation of a bubble cloud via shock scattering captured by shadowography. Ultrasound propagation is from left to right. The scattering bubble (dark cone, t = 0 frame) has been distorted due to the asymmetric incident shock wave (dark line). The large size of the scattering bubble compared to the shock thickness and the flattened surface allow strong scattering of the incident shock wave. Furthermore, the pressure release boundary condition of the bubble/gel interface invert the shock. The scattered, inverted wave nucleate cavitation proximal to the bubble. (Right) A shadowgraph sequence showing formation of a bubble cloud over a 15-cycle pulse. The acoustic propagation is left to right, but cloud growth forms in the opposite direction during passage of the pulse.
Fig. 8:
Fig. 8:
(A) Time to boil for shock-induced heating in soft tissues. (B) Time to boil as a function of the temperature of the medium. The center frequency of the insonation is noted in the legend, and a 100 MPa shock amplitude was assumed. The dashed back lines span 5-20 μs in panels B, the typical duration of a shock scattering histotripsy pulse (Khokhlova et al. 2015; Maxwell et al. 2012). The specific heat per unit mass was 3.5 × 10⁶ J/m3•C.
Fig. 9:
Fig. 9:
Temporal sequence of millisecond boiling at the focus of a 1-MHz boiling histotripsy transducer. As heat is deposited, a shadow appears due to changes in index of refraction around the focus (t = 5 ms). At t = 5.75 ms, a boiling bubble occurs, and a cavitation cloud appears behind the bubble over the next 0.5 ms due to scattering. Ultrasound propagation is from top to bottom.
Fig. 10:
Fig. 10:
Optical images of bubbles produced by histotripsy pulses inside agarose tissue phantoms of increasing Young’s modulus. Images demonstrate a decrease in bubble size with increasing frequency and increasing medium stiffness. Reprinted from Physics in Medicine and Biology, vol. 60, Vlaisavljevich et al, Effects of tissue stiffness, ultrasound frequency, and pressure on histotripsy-induced cavitation bubble behavior, p. 2271, doi.org/10.1088/0031-9155/60/6/2271. Copyright (2015), © Institute of Physics and Engineering in Medicine. Reproduced by permission of IOP Publishing. All rights reserved.
Fig. 11:
Fig. 11:
Left: Calculated response of a 20-nm diameter bubble (right hand axis) to a single cycle of a shock scattering histotripsy pulse (left hand axis) via the Yang/Church model (Yang and Church 2005). Right: External pressure forces acting on bubble wall during the excitation due to surface tension, viscosity, elasticity, and the ambient pressure (0.1 MPa). The following values of the medium properties were used: surface tension, σ = 56 mN/m, dynamic viscosity, μ = 0.005 kg/m•s, and elastic modulus, E = 100 kPa. The exact pressure at the bubble wall will change for variations in the cavitation process (e.g. bubble size, medium properties, histotripsy excitation), though the trends will remain (Bader 2018).
Fig. 12:
Fig. 12:
Overview of exogenous nuclei utilized in histotripsy. (A) Microbubble contrast agent, typically composed of a high molecular weight gas (e.g. C3F8) surrounded by a stabilizing shell, such as a lipid. (B) Schematic of echogenic liposome loaded with the thrombolytic drug rt-PA and octafluoropropane gas microbubbles. A portion of the thrombolytic is encapsulated within the liposome. The remaining portion is intercalated within the lipid bilayer, exposing the finger domain to target fibrin. Upon exposure to a histotripsy pulse, the encapsulated bubble will expand, locally releasing the thrombolytic. (C) Polymer encapsulated nanodroplets containing perfluorocarbon liquid core used to lower the cavitation nucleation threshold. (D) Nanocup used to entrap and stabilize gas to act as an extrinsic cavitation nucleus.
Fig. 13:
Fig. 13:
Nanodroplet-mediated histotripsy. (A) Perfluorocarbon nanodroplets significantly reduce the histotripsy intrinsic threshold, allowing for (B) selective generation of cavitation only in regions containing the targeted nanodroplets. Reprinted from Theranostics, vol. 3, Vlaisavljevich et al, Nanodroplet-mediated histotripsy for image-guided targeted ultrasound cell ablation, p. 851, doi:10.7150/thno.6717.(2013).
Fig. 14:
Fig. 14:
Summary of imaging modalities for real-time assessment for histotripsy image guidance. (A) B-mode imaging of hyperechoic bubble cloud via changes in grayscale value (histotripsy pulse propagating from left to right in the image). (B) Passive cavitation imaging (PCI) maps acoustic emissions generated by the bubble cloud spatially (histotripsy pulse propagating from left to right in the image). (C) Color Doppler images acquired during histotripsy liquefaction of ex vivo porcine liver, indicating movement both towards (left image) and away from (right image) due to coherent motion associated with translation of the bubble cloud (Miller et al. 2016). (D) Ex vivo porcine liver sample prior to histotripsy excitation imaged with a spin-echo imaging sequence (left frame), and just after histotripsy excitation with a cavitation-sensitive 2D EPI sequence (white arrow, right frame) (Allen et al. 2015). Panel C reprinted with permission from IEEE Transactions on Ultrasonics, Ferroelectrics and Frequency Control, vol. 63, Miller et al, Bubble-induced color Doppler feedback for histotripsy tissue fractionation, p. 408, doi:10.1109/TUFFC.2016.2525859. Copyright (2016), © IEEE. Panel D reprinted with permission from Magnetic Resonance in Medicine, vol. 76, Allen et al, MR-based detection of individual bubble clouds form in tissue and phantoms, p. 1486, doi:10.1002/mrm.26062. Copyright (2015), © John Wiley and Sons, Inc.
Fig. 15:
Fig. 15:
(Top panel) Passive cavitation image (PCI) registered with processed phantom image. The liquefaction zone border is outlined in blue. (Bottom panel) Comparison of the PCI and plane wave B-mode image along the dotted line in the top panel and binary phantom image. For the phantom, values of 1 indicate liquefaction, and values of 0 indicate intact phantom. The histotripsy pulse (1-MHz center frequency, 10-μs pulse duration, 18 MPa peak negative pressure) was propagating from left to right in the image (Bader et al. 2018). Reprinted with permission from IEEE Transactions on Medical Imaging, vol. 37, Bader et al, Post hoc analysis of passive cavitation imaging for classification of histotripsy-induced liquefaction in vitro, p. 408, doi: 10.1109/TMI.2017.2735238. Copyright (2018), © IEEE.

References

    1. Acconcia C, Leung BYC, Hynynen K, Goertz DE. Interactions between ultrasound stimulated microbubbles and fibrin clots. Appl Phys Lett 2013;103:053701.
    1. Ainslie MA, Leighton TG. Review of scattering and extinction cross-sections, damping factors, and resonance frequencies of a spherical gas bubble. J Acoust Soc Am 2011;130:3184. - PubMed
    1. Allen SP, Hall TL, Cain CA, Hernandez-Garcia L. Controlling cavitation-based image contrast in focused ultrasound histotripsy surgery. Magn Reson Med 2014;73:204–213. - PubMed
    1. Allen SP, Hernandez-Garcia L, Cain CA, Hall TL. MR-based detection of individual histotripsy bubble clouds formed in tissues and phantoms. Magn Reson Med 2015;76:1486–1493. - PubMed
    1. Allen SP, Vlaisavljevich E, Shi J, Hernandez-Garcia L, Cain CA, Xu Z, Hall TL. The response of MRI contrast parameters in in vitro tissues and tissue mimicking phantoms to fractionation by histotripsy. Phys Med Biol 2017;62:7167–7180. - PubMed

Publication types

MeSH terms