. 2019 Jun;18(6):1183-1196.
doi: 10.1074/mcp.RA119.001319. Epub 2019 Mar 28.

Effects of Size and Geographical Origin on Atlantic salmon, Salmo salar, Mucin O-Glycan Repertoire

Affiliations

Effects of Size and Geographical Origin on Atlantic salmon, Salmo salar, Mucin O-Glycan Repertoire

John Benktander et al. Mol Cell Proteomics. 2019 Jun.

Abstract

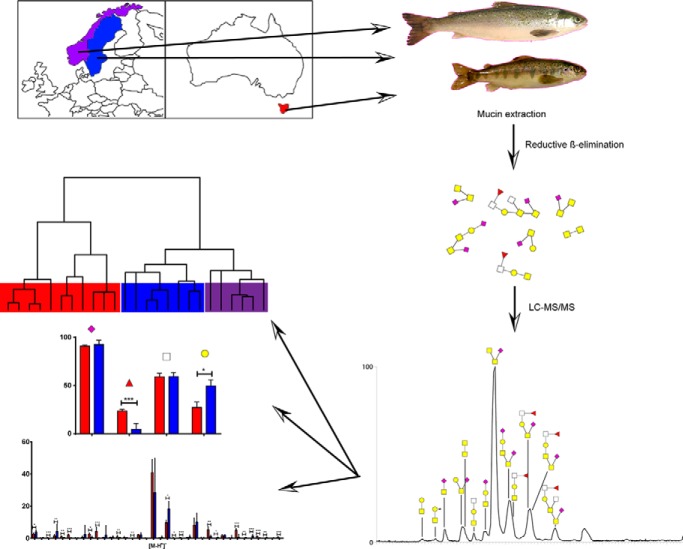
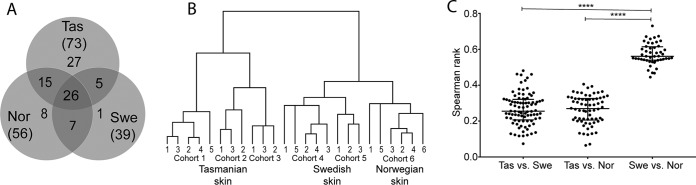
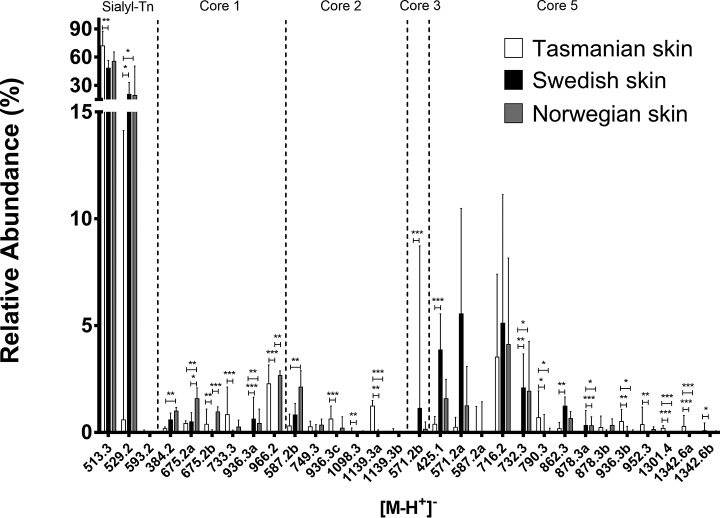
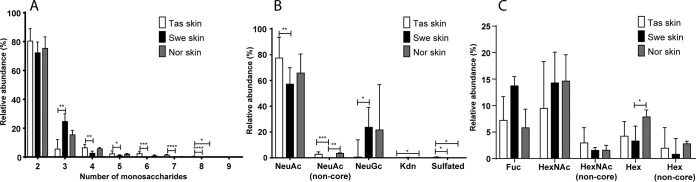
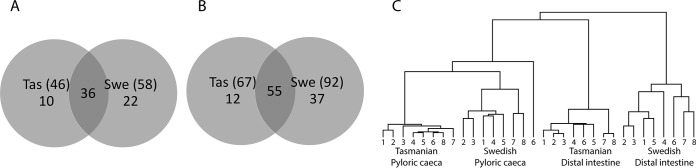
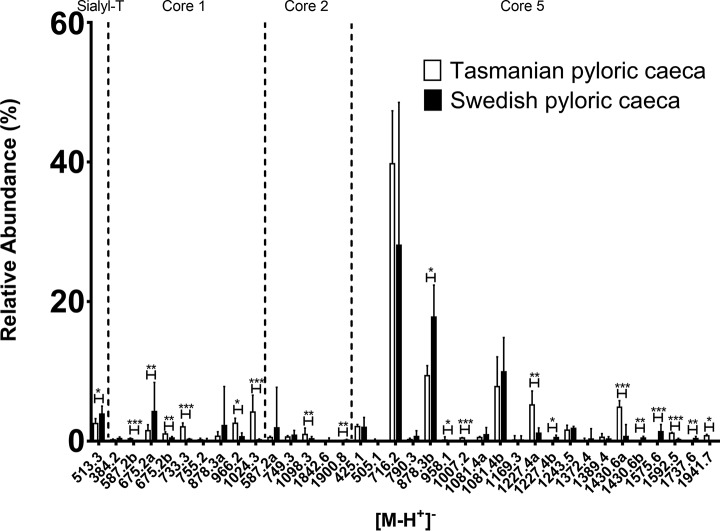
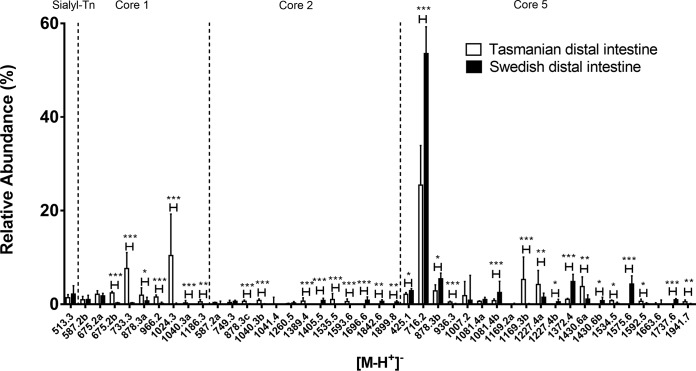
Diseases cause ethical concerns and economic losses in the Salmonid industry. The mucus layer comprised of highly O-glycosylated mucins is the first contact between pathogens and fish. Mucin glycans govern pathogen adhesion, growth and virulence. The Atlantic salmon O-glycome from a single location has been characterized and the interindividual variation was low. Because interindividual variation is considered a population-based defense, hindering the entire population from being wiped out by a single infection, low interindividual variation among Atlantic salmon may be a concern. Here, we analyzed the O-glycome of 25 Atlantic salmon from six cohorts grown under various conditions from Sweden, Norway and Australia (Tasmania) using mass spectrometry. This expanded the known Atlantic salmon O-glycome by 60% to 169 identified structures. The mucin O-glycosylation was relatively stable over time within a geographical region, but the size of the fish affected skin mucin glycosylation. The skin mucin glycan repertoires from Swedish and Norwegian Atlantic salmon populations were closely related compared with Tasmanian ones, regardless of size and salinity, with differences in glycan size and composition. The internal mucin glycan repertoire also clustered based on geographical origin and into pyloric cecal and distal intestinal groups, regardless of cohort and fish size. Fucosylated structures were more abundant in Tasmanian pyloric caeca and distal intestine mucins compared with Swedish ones. Overall, Tasmanian Atlantic salmon mucins have more O-glycan structures in skin but less in the gastrointestinal tract compared with Swedish fish. Low interindividual variation was confirmed within each cohort. The results can serve as a library for identifying structures of importance for host-pathogen interactions, understanding population differences of salmon mucin glycosylation in resistance to diseases and during breeding and selection of strains. The results could make it possible to predict potential vulnerabilities to diseases and suggest that inter-region breeding may increase the glycan diversity.

Keywords: Glycomics; Glycoprotein Structure*; Glycoproteins*; Glycosylation; Mass Spectrometry; Mucins; Mucus; O-glycan; Tandem Mass Spectrometry.


Figures

None
Graphical abstract
Fig. 1.
Fig. 1.
Relation between Atlantic salmon skin mucin O-glycans from different geographical regions. A, Venn diagram of O-glycans found among Tasmanian (Tas, n = 11: Cohort 1, 2 and 3), Swedish (Swe, n = 8: Cohort 4 and 5) and Norwegian (Nor, n = 6) salmon skin mucins. B, Tree view after hierarchal clustering of O-glycans from Atlantic salmon skin mucins. The hierarchical clustering was performed using Spearman rank correlations with centroid linkage. C, Spearman rank correlation coefficient r (ρ) values between individual skin mucin glycan profiles from the different locations. Significance was calculated using Kruskal-Wallis tests with Dunn′s multiple comparison corrections.
Fig. 2.
Fig. 2.
Relative abundances of Atlantic salmon skin mucin O-glycans from different geographical regions. Tasmanian (cohort 1, 2 and 3, n = 11), Swedish (cohort 4 and 5, n = 8) and Norwegian (cohort 6, n = 6) Atlantic salmon skin mucin O-glycans with at least one value above 1% were compared (for all O-glycans see supplemental Table S1). Error bars show the interquartile range. Significance was calculated using Kruskal-Wallis tests with Dunn′s multiple comparison corrections.
Fig. 3.
Fig. 3.
Comparison of size and composition of O-glycans from Atlantic salmon skin mucins. A, Size of the O-glycans (number of monosaccharides in the structures identified) on Tasmanian (Tas), Swedish (Swe) and Norwegian (Nor) skin mucins. B, Relative abundance of structures containing acidic monosaccharides. C, Relative abundance of structures containing neutral terminal monosaccharides. Non-core signifies exclusion of the structures with terminal glycans from the core structures or sialyl-Tn. The hexoses are most likely galactose, as terminal mannose and glucose to our knowledge have not been identified on O-glycans. Error bars show the interquartile range. Significance was calculated using Kruskal-Wallis tests with Dunn′s multiple comparison corrections.
Fig. 4.
Fig. 4.
Relation between Atlantic salmon pyloric caeca and distal intestine mucin O-glycans from different geographical regions. A, Venn diagram of O-glycans found on pyloric caeca mucins from Tasmanian (Tas) and Swedish (Swe) Atlantic salmon. B, Venn diagram of O-glycans among distal intestine mucins. C, Tree view after hierarchal clustering of mucin O-glycans from pyloric caeca and distal intestine. The hierarchical clustering was performed using Spearman rank correlations with centroid linkage. Tasmanian 1–5: ∼750 g fish (cohort 1), Tasmanian 6–8: ∼25 g fish (cohort 2), Swedish fish 1–5: ∼270 g, sampled 2012 (cohort 4) (13), Swedish 6–8: ∼270 g, sampled 2015 (cohort 5).
Fig. 5.
Fig. 5.
Relative abundances of mucin O-glycans from Tasmanian and Swedish Atlantic salmon pyloric caeca. Mucin O-glycans with at least one value above 1% were compared (for all O-glycans see supplemental Table S1). Diagram shows O-glycan structure masses sorted by core structure. Error bars show the interquartile range. Significance was calculated using Mann-Whitney U-tests (* p value <0.05, ** p value <0.01, *** p value <0.001).
Fig. 6.
Fig. 6.
Annotated MS/MS of fucosylated structures. MS/MS of fucosylated structures with significantly higher relative abundance among pyloric caeca mucin O-glycans in Tasmanian compared with Swedish salmon. Symbols represents: yellow circle, Gal; yellow square, GalNAc; blue square, GlcNAc; empty square, HexNAc; red triangle, Fuc; purple diamond, NeuAc. Detailed assumptions related to linkage configuration and position, and validation of assigned structures can be found in materials and methods. Proposed structures are depicted using the Symbol Nomenclature for Glycomics (SNFG).
Fig. 7.
Fig. 7.
Relative abundances of Atlantic salmon distal intestinal mucin O-glycans from Tasmania and Sweden. Mucin O-glycans with at least one value above 1% were compared (for all O-glycans see supplemental Table S1). The diagram shows O-glycan structure masses sorted by core structure. Error bars show the interquartile range. Significance was calculated using Mann-Whitney U-tests (* p value <0.05, ** p value <0.01, *** p value <0.001).
Fig. 8.
Fig. 8.
MS/MS of sulfated O-glycans from Tasmanian Atlantic salmon distal intestinal mucins. Some of the fragment ions occur because of sulfate migration (+SO3) (33). Proposed structures are illustrated using CFG symbol nomenclature with sulfate groups shown as SO3.
Fig. 9.
Fig. 9.
Glycan size and terminal components on Tasmanian (Tas) and Swedish (Swe) mucins from the pyloric caeca and distal intestine. A–B, Size of the O-glycans (number of monosaccharides in the structures identified) pyloric caeca (A) and distal intestine (B) mucins. C and D, Relative abundance of O-glycan structures with terminal neutral monosaccharides from the pyloric caeca and distal intestine mucins. “Non-core” signifies exclusion of structures with terminal monosaccharide in the core. The hexoses are most likely galactose, as terminal mannose and glucose to our knowledge have not been identified on O-glycans. E and F, Relative abundance of O-glycan structures with acidic constituents from pyloric caeca and distal intestine mucins. “Non-core” signifies exclusion of structures with a reducing end X-(NeuAcα2–6)GalNAc (Sialyl-Tn). Error bars show the interquartile range. Significance was calculated using Mann-Whitney tests. * p value <0.05, ** p value <0.01, *** p value <0.001.
Fig. 10.
Fig. 10.
O-glycan diversity and distribution among cohorts. A, Distribution of skin mucin O-glycan structures among fish in Tasmanian (Tas, cohort 1) and Swedish (Swe, cohort 4) Atlantic salmon: bars represent the percentage of total glycan structures identified in only one fish (1/5) and up to 5 fish (5/5) in each group. B, Distribution of the pyloric caeca mucin O-glycan structures among fish in respective populations. C, Distribution of the distal intestine mucin O-glycan structures among fish in respective populations. D, Spearman′s rank correlations (ρ) of relative abundance of the glycan structures within cohorts were compared: skin (Tas-Swe: p = 0.0355, Tas-Nor: p = 0.0475, Swe-Nor: p = ns), pyloric caeca (p = 0.0355) and distal intestine (p = 0.0003). Significance was calculated using Mann-Whitney U-tests.

References

    1. Groff J. M., and Lapatra S. E. (2000) Infectious Diseases Impacting the Commercial Culture of Salmonids. J. Appl. Aquaculture 10, 17–90
    1. Ellis T., Turnbull J. F., Knowles T. G., Lines J. A., and Auchterlonie N. A. (2016) Trends during development of Scottish salmon farming: An example of sustainable intensification? Aquaculture 458, 82–99
    1. Bornø G., and Lie L. M. (Eds) (2015) Fish health report 2014, The Norwegian Veterinary Institute.
    1. McGuckin M. A., Lindén S. K., Sutton P., and Florin T. H. (2011) Mucin dynamics and enteric pathogens. Nat. Rev. Micro. 9, 265–278 - PubMed
    1. Gomez D., Sunyer J. O., and Salinas I. (2013) The mucosal immune system of fish: the evolution of tolerating commensals while fighting pathogens. Fish Shellfish Immunol. 35, 1729–1739 - PMC - PubMed

Publication types

LinkOut - more resources