. 2019 May 6;216(5):1214-1229.
doi: 10.1084/jem.20181365. Epub 2019 Mar 28.

CD4+ resident memory T cells dominate immunosurveillance and orchestrate local recall responses

Affiliations

CD4+ resident memory T cells dominate immunosurveillance and orchestrate local recall responses

Lalit K Beura et al. J Exp Med. .

Abstract

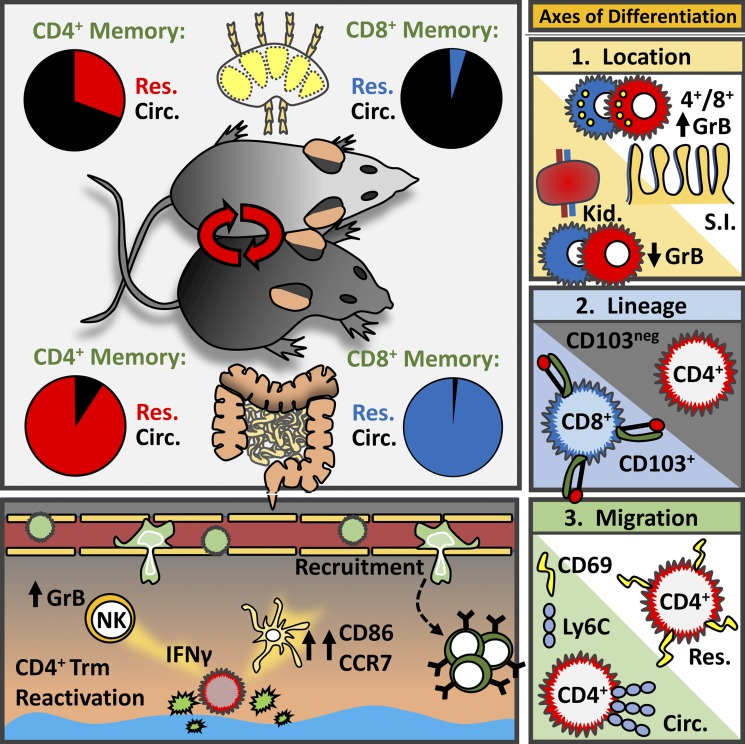
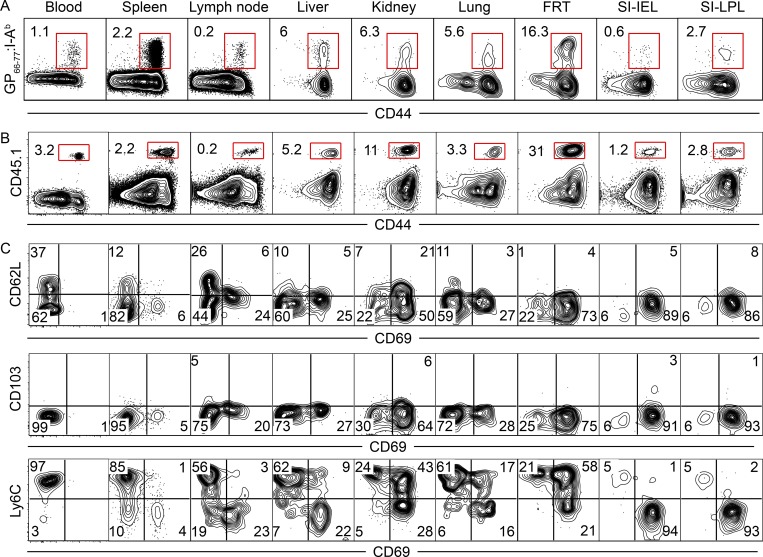
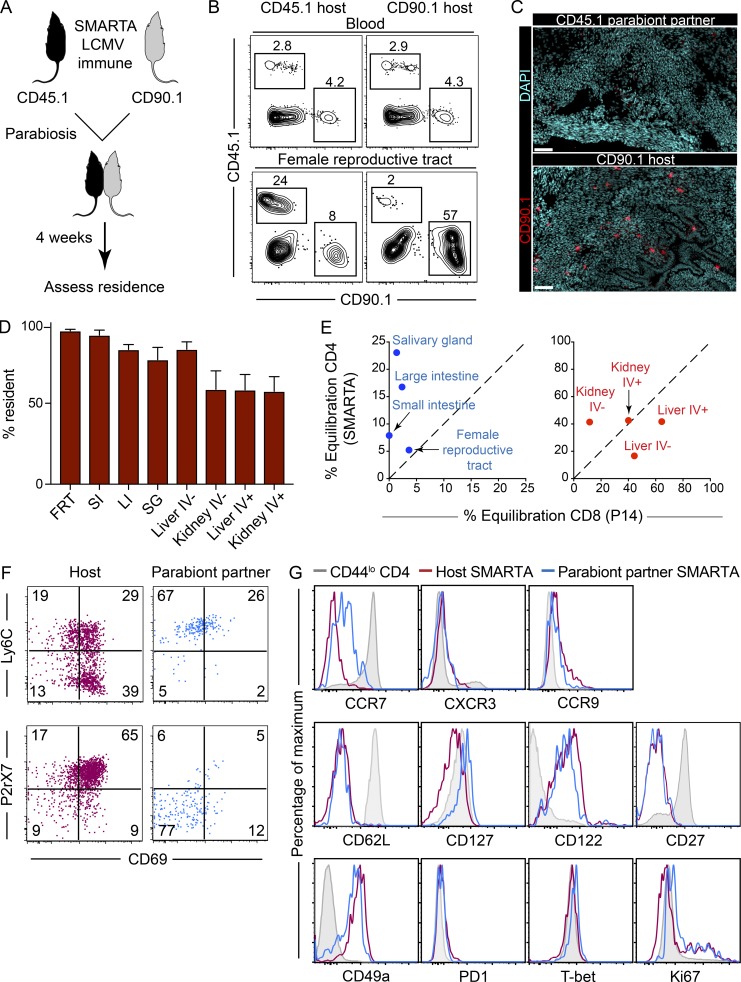
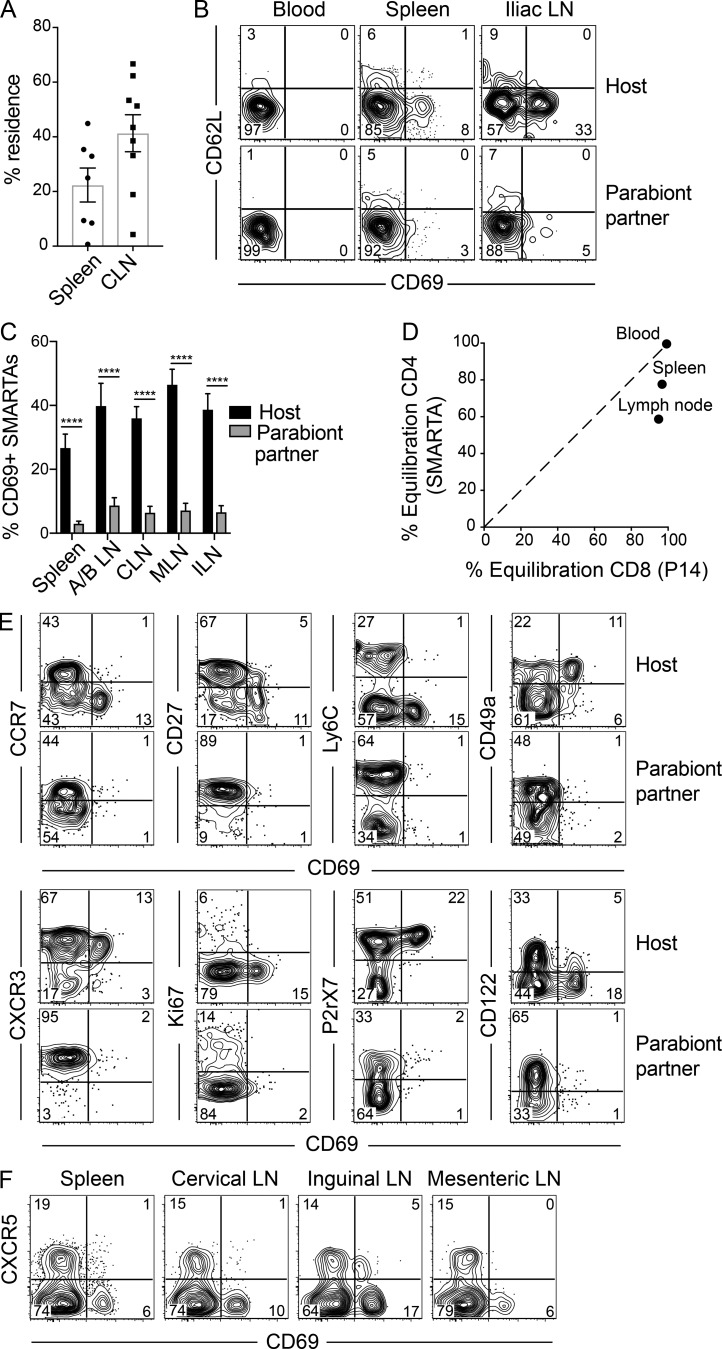
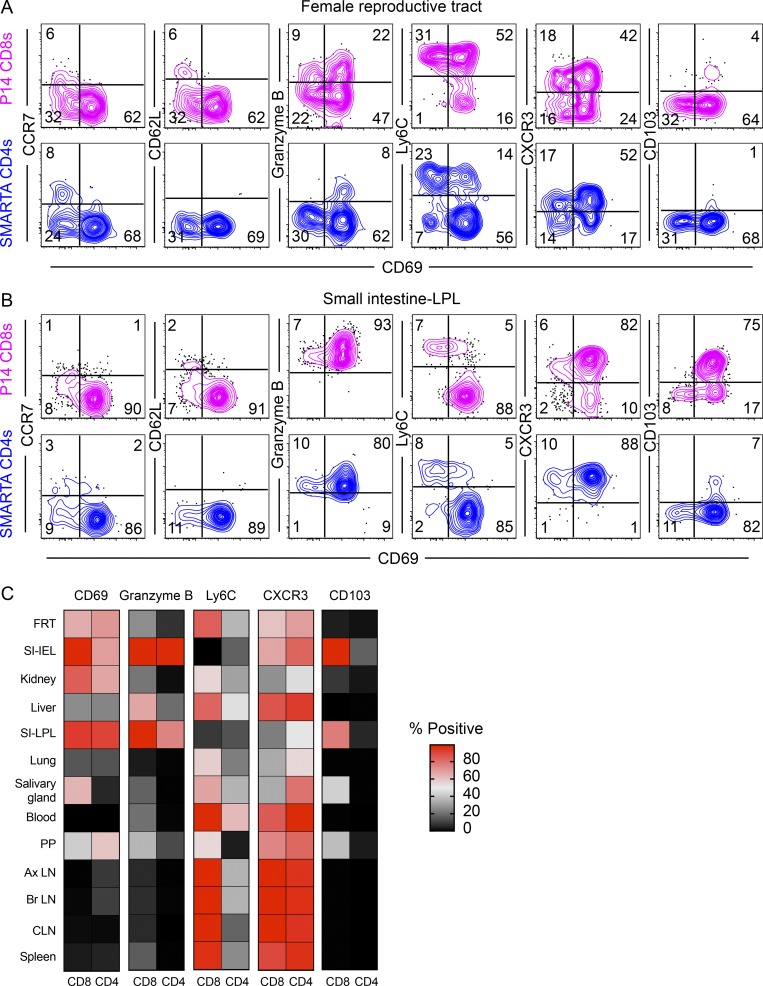
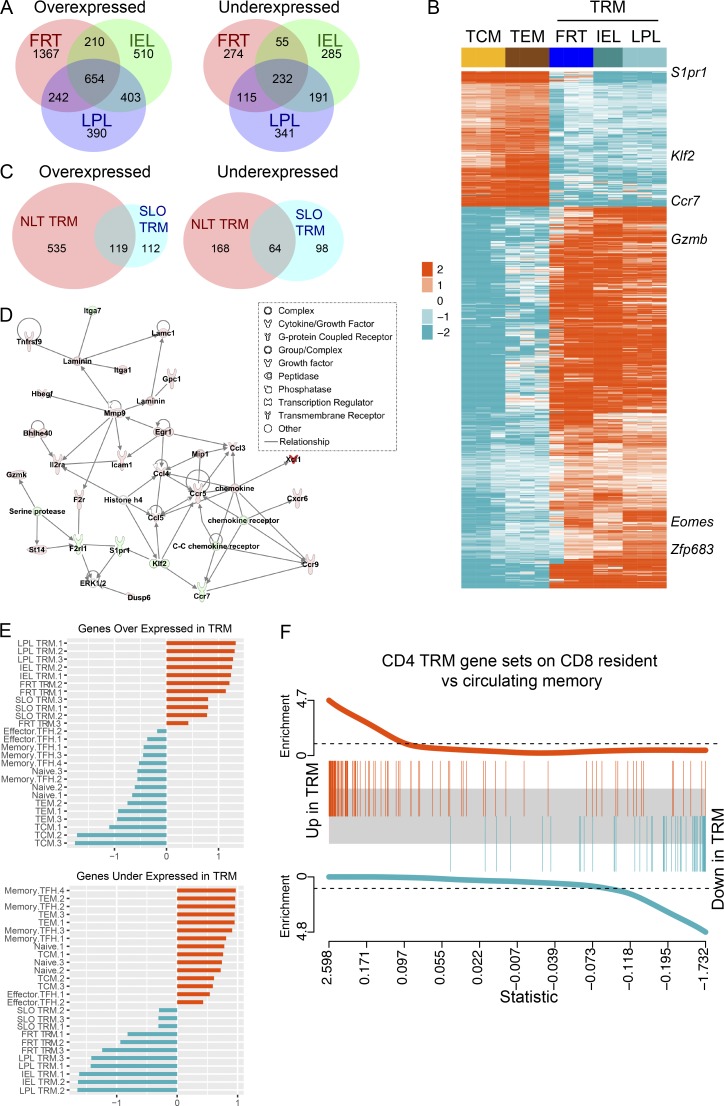
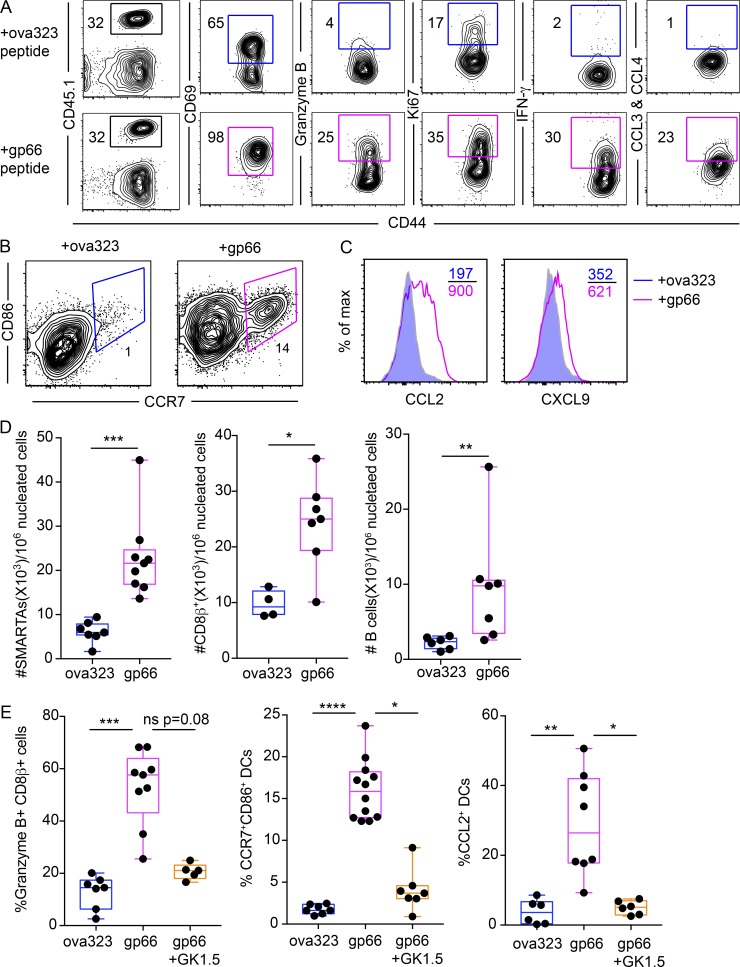
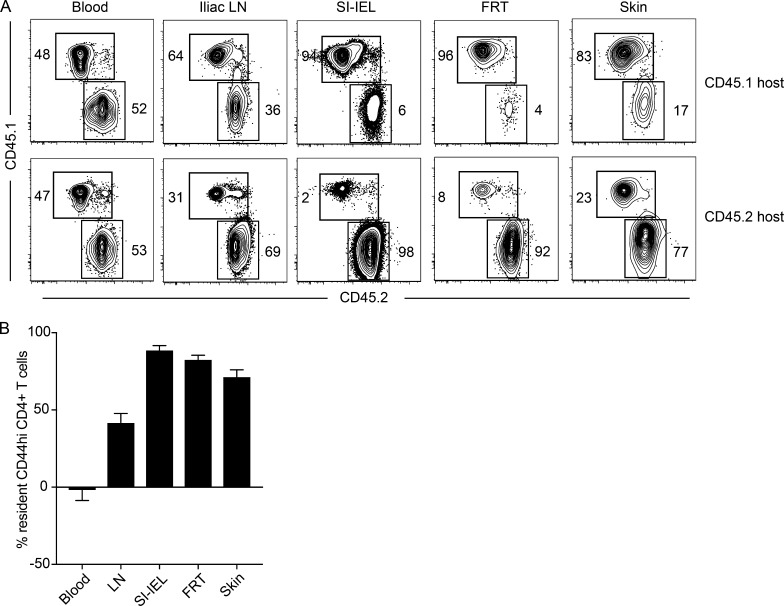
This study examines the extent to which memory CD4+ T cells share immunosurveillance strategies with CD8+ resident memory T cells (TRM). After acute viral infection, memory CD4+ T cells predominantly used residence to survey nonlymphoid tissues, albeit not as stringently as observed for CD8+ T cells. In contrast, memory CD4+ T cells were more likely to be resident within lymphoid organs than CD8+ T cells. Migration properties of memory-phenotype CD4+ T cells in non-SPF parabionts were similar, generalizing these results to diverse infections and conditions. CD4+ and CD8+ TRM shared overlapping transcriptional signatures and location-specific features, such as granzyme B expression in the small intestine, revealing tissue-specific and migration property-specific, in addition to lineage-specific, differentiation programs. Functionally, mucosal CD4+ TRM reactivation locally triggered both chemokine expression and broad immune cell activation. Thus, residence provides a dominant mechanism for regionalizing CD4+ T cell immunity, and location enforces shared transcriptional, phenotypic, and functional properties with CD8+ T cells.


Figures

None
Graphical abstract
Figure 1.
Figure 1.
LCMV-Armstrong infection establishes broadly distributed memory CD4+ T cells. (A) C57BL/6J mice were infected with 2 × 10⁵ PFU LCMV-Armstrong. Distribution of endogenous (GP66-77:I-Ab MHCII tetramer+) memory CD4+ T cells within blood, SLOs, and NLTs was assessed 50 d after infection. (B and C) CD45.1+ SMARTA CD4+ T cells were transferred to C57BL/6J mice 1 d before infection with LCMV-Armstrong. Mice were analyzed 64 d after infection. Distribution (B) and phenotype (C) of SMARTA CD4+ memory T cells within blood, SLOs, and NLTs are shown. Data are representative of three independent experiments with n = 4 mice per experiment (A) or three separate experiments with n = 3 mice per experiment (B and C). SI, small intestine; IEL, intraepithelial lymphocytes; LPL, lamina propria lymphocytes.
Figure 2.
Figure 2.
Residence is a dominant feature of memory CD4+ T cells in NLTs. (A) CD90.1+ and CD45.1+ SMARTA memory immune chimeras were conjoined via parabiosis 45–60 d after LCMV-Armstrong infection. Parabiont pairs were analyzed 4 wk after parabiosis. (B) Frequency of host- and parabiont partner–derived SMARTA cells in blood and FRT were determined by flow cytometric analysis. Plots are gated on total live CD4+ T cells. (C) FRT of both mice stained with DAPI (cyan) and anti-CD90.1 (to label SMARTA cells; red). Bars, 50 µm. (D) Number of CD45.1+ and CD90.1+ SMARTA CD4+ T cells in both parabiont partners in indicated tissues was calculated by QIM. Percentage of CD4+ residence was determined by the formula described previously (Steinert et al., 2015). IV+ indicates cells labeled by anti-CD45 antibody injected i.v. 3 min before sacrifice. LI, large intestine; SG, salivary gland. (E) Equilibration of CD4+ SMARTA cells and CD8+ P14 cells in NLTs and vascular compartments following LCMV-Armstrong infection (as determined by QIM). (F and G) Phenotypic comparison of host (CD90.1+, maroon)– and partner (CD45.1+, blue)–derived SMARTA CD4+ T cells in FRT. CD44lo naive CD4+ T cells are shown in gray. Data are representative of two separate experiments with a total of 12 individual mice. Bars represent mean ± SEM. SI, small intestine.
Figure 3.
Figure 3.
Abundant CD4+ TRM cells in SLOs. (A–D) LCMV-immune SMARTA parabionts were generated as described in Fig. 2 A. (A) Percent residence of SMARTA CD4+ T cells in spleen and cervical LNs (CLN) as determined by QIM. (B) CD69 and CD62L expression on host- and partner-derived SMARTA CD4+ T cells in blood, spleen, and iliac LNs. (C) Percent CD69+ SMARTA cells from spleen and LNs (combined axillary/brachial [A/B LN], cervical, mesenteric [MLN], and iliac [ILN]) of host and parabiont partner as determined by flow cytometry. (D) Equilibration of CD4+ SMARTA cells and CD8+ P14 cells in spleen and cervical LN following LCMV-Armstrong infection (as determined by QIM). (E) Phenotypic analysis of host- and partner-derived SMARTA cells isolated from spleen 28 d after parabiosis. (F) CD69 and CXCR5 expression on SMARTA CD4+ T cells of SMARTA immune chimeras 75 d after LCMV-Armstrong infection. Data are representative of two separate experiments with a total of 12 individual mice (A–D) or two independent experiment with n = 4 mice per experiment (E). ****, P < 0.0001. Two-way ANOVA with Sidak’s multiple comparison test (C). Bars represent mean ± SEM.
Figure 4.
Figure 4.
Comparison of mucosal memory CD4+ and CD8+ T cells after LCMV infection. SMARTA and P14 immune chimeras were prepared by transferring naive SMARTA CD4+ and P14 CD8+ T cells to C57BL/6J mice and infecting the recipients with LCMV-Armstrong 1 d after. (A and B) Phenotypic comparison between memory P14 CD8+ T cells and SMARTA CD4+ T cells (40 d after infection) from (A) FRT and (B) small intestine lamina propria (SI-LPL) are shown. (C) Heatmap showing comparative expression of indicated markers between P14 CD8+ and SMARTA CD4+ T cells in various NLTs and SLOs. Data are representative of two independent experiments with n = 4 mice per treatment/experiment. CLN, cervical LN; Ax LN, axillary LN; Br LN, brachial LN; PP, Peyer's patches.
Figure 5.
Figure 5.
Common transcriptional signature of resident memory T cells. NLT CD69+ SMARTA memory CD4+ T cells were isolated and sorted from the FRT, small intestine epithelium (IEL), and small intestine lamina propria (LPL). TCM (CD62L+), TEM (CD62L/CD69), and SLO TRM (CD69+CD62L) SMARTA CD4+ T cells were isolated and sorted from spleen. Cells were obtained 54 d after LCMV infection. (A) Venn diagrams showing the number of unique and common DEGs between NLT CD69+ SMARTA TRM cells and TCM and TEM (criteria for significance: FDR ≤0.05 and absolute value of fold change ≥2). Full lists of common and unique DEGs are provided in Table S2. (B) Heatmap generated from clustering analysis with normalized expression of genes that showed differential expression in all NLT TRM as identified in A. Several known resident memory genes are highlighted. (C) Venn diagram showing the overlap of overexpressed and underexpressed genes between NLT CD69+ SMARTA TRM cells and SLO TRM cells relative to circulating TCM and TEM cells. A full list of DEGs is provided in Table S2. (D) Most enriched gene network. IPA was used to generate the network from the genes shared by both SLO TRM and NLT TRM (identified in Fig. 5 C) and the average fold change value obtained from averaging the absolute fold change from all comparisons of TRM to circulating TCM and TEM cells. Edges (lines and arrows) represent direct interactions as supported by information in the IPA database. Genes included in the TRM gene list have a colored node. Node color indicates up-regulated genes (orange) and down-regulated genes (blue) in TRM. Node shapes represent functional classes of gene product. (E) Comparison of CD4+ datasets with a previously published dataset containing transcript profiles of mouse effector and memory TFH from an LCMV infection model (GSE43863; Hale et al., 2013). Gene set summary values were calculated for each sample. Z scores of gene set summary scores are plotted. (F) GSEA plot. A CD8+ ranked gene list was obtained from the output of a GSEA enrichment test comparing previously published gut TRM to circulating memory samples (GSE47045; Mackay et al., 2013). The limma barcode plot function was used to plot enrichment of the overexpressed and underexpressed CD4+ TRM gene sets in the CD8+ ranked gene list.
Figure 6.
Figure 6.
Mucosal CD4+ TRM execute sensing and alarm functions. SMARTA memory immune chimeras were challenged transcervically with ova323 (control) or gp66 peptide 35–65 d after LCMV-Armstrong infection. (A) Phenotypic analysis of SMARTA CD4+ T cells in FRT 16 h following reactivation. Left-most plots are gated on total live CD4+ T cells. All other plots are gated on CD45.1+ SMARTA CD4+ T cells. (B and C) Expression of maturation markers CCR7, CD86 (B) and chemokines (C) on CD11chi MHCIIhi dendritic cells in the FRT 16 h following peptide challenge. (D) Enumeration of SMARTA CD4+ T cells, CD8β+ T cells, and B cells in the FRT 48 h after recall by QIM. (E) SMARTA memory immune chimeras were injected with either CD4-depleting antibody (GK1.5) or PBS. Treated mice were t.c. challenged with indicated peptides. CD11chi MHCIIhi dendritic cell maturation and CD8+ T cell activation (granzyme B upregulation) in the FRT were assessed 16 h after challenge by flow cytometry. Data are representative of three separate experiments with n = 3 mice/group per experiment (A–D) or two independent experiments with n = 3 mice/group per experiment (E). *, P < 0.05; **, P < 0.01; ***, P < 0.001; ****, P < 0.0001; ns, not significant. Mann-Whitney U test (D), Kruskal Wallis one-way ANOVA with Dunn’s multiple comparison test (E). Box plots indicate medians (center lines), 25th and 75th percentiles (bottom and top box edges, respectively), minima and maxima (whiskers), and individual data points (circles).
Figure 7.
Figure 7.
Residence is the dominant mechanism of immune surveillance by CD4+ T cells in non-SPF (dirty) mice. Congenically distinct SPF C57BL/6J mice (CD45.1+ and CD45.2+) and pet store mice were cohoused for 60 d to generate dirty mice. Dirty CD45.1+ and CD45.2+ mice were conjoined via parabiosis for 4 wk before analysis by flow cytometry and QIM. (A) Frequency of host- and partner-derived CD4+ T cells in indicated tissues. Plots are gated on CD44hi CD4+ live T cells. (B) Host- and partner-derived cells were enumerated by flow cytometry–based counting in indicated tissues, and the percent residence of CD44hi CD4 T cells was calculated by the formula described previously (Steinert et al., 2015). SI, small intestine. Bars represent mean ± SEM. Data are representative of three separate experiments with at least three parabiont pairs per experiment.

Comment in

References

    1. Allen A.C., Wilk M.M., Misiak A., Borkner L., Murphy D., and Mills K.H.G.. 2018. Sustained protective immunity against Bordetella pertussis nasal colonization by intranasal immunization with a vaccine-adjuvant combination that induces IL-17-secreting TRM cells. Mucosal Immunol. 11:1763–1776. 10.1038/s41385-018-0080-x - DOI - PubMed
    1. Anderson K.G., Mayer-Barber K., Sung H., Beura L., James B.R., Taylor J.J., Qunaj L., Griffith T.S., Vezys V., Barber D.L., and Masopust D.. 2014. Intravascular staining for discrimination of vascular and tissue leukocytes. Nat. Protoc. 9:209–222. 10.1038/nprot.2014.005 - DOI - PMC - PubMed
    1. Andrews S.2010. FastQC A Quality Control tool for High Throughput Sequence Data. Available at: http://www.bioinformatics.babraham.ac.uk/projects/fastqc/.
    1. Asrir A., Aloulou M., Gador M., Pérals C., and Fazilleau N.. 2017. Interconnected subsets of memory follicular helper T cells have different effector functions. Nat. Commun. 8:847 10.1038/s41467-017-00843-7 - DOI - PMC - PubMed
    1. Benoun J.M., Peres N.G., Wang N., Pham O.H., Rudisill V.L., Fogassy Z.N., Whitney P.G., Fernandez-Ruiz D., Gebhardt T., Pham Q.-M., et al. 2018. Optimal protection against Salmonella infection requires noncirculating memory. Proc. Natl. Acad. Sci. USA. 115:10416–10421. 10.1073/pnas.1808339115 - DOI - PMC - PubMed

Publication types