. 2019 Apr 16;116(16):8018-8027.
doi: 10.1073/pnas.1819448116. Epub 2019 Mar 28.

Macroscale intrinsic network architecture of the hypothalamus

Affiliations

Macroscale intrinsic network architecture of the hypothalamus

Joel D Hahn et al. Proc Natl Acad Sci U S A. .

Abstract

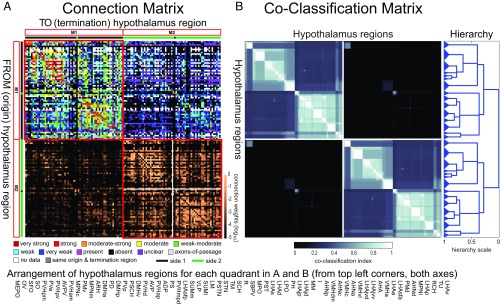
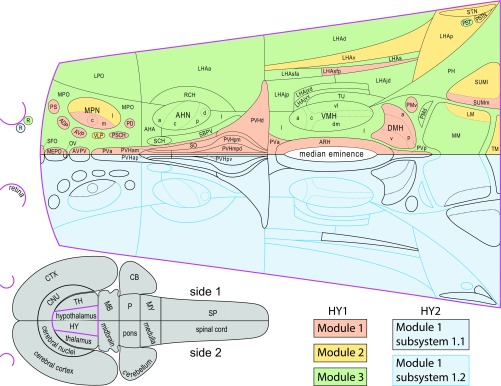
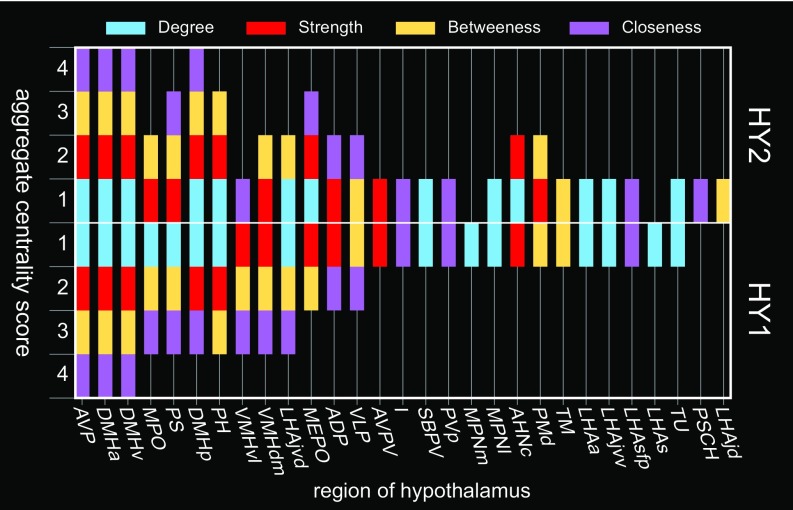
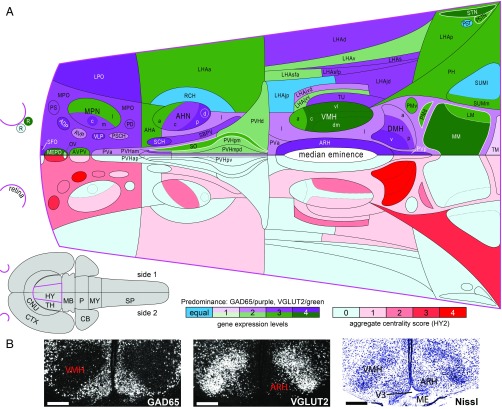
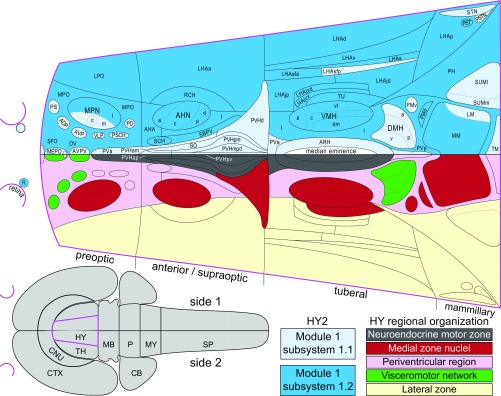
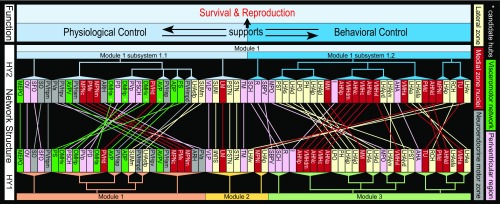
Control of multiple life-critical physiological and behavioral functions requires the hypothalamus. Here, we provide a comprehensive description and rigorous analysis of mammalian intrahypothalamic network architecture. To achieve this at the gray matter region (macroscale) level, macroscale connection (macroconnection) data for the rat hypothalamus were extracted from the primary literature. The dataset indicated the existence of 7,982 (of 16,770 possible) intrahypothalamic macroconnections. Network analysis revealed that the intrahypothalamic macroconnection network (its macroscale subconnectome) is divided into two identical top-level subsystems (or subnetworks), each composed of two nested second-level subsystems. At the top-level, this suggests a deeply integrated network; however, regional grouping of the two second-level subsystems suggested a partial separation between control of physiological functions and behavioral functions. Furthermore, inclusion of four candidate hubs (dominant network nodes) in the second-level subsystem that is associated prominently with physiological control suggests network primacy with respect to this function. In addition, comparison of network analysis with expression of gene markers associated with inhibitory (GAD65) and excitatory (VGLUT2) neurotransmission revealed a significant positive correlation between measures of network centrality (dominance) and the inhibitory marker. We discuss these results in relation to previous understandings of hypothalamic organization and provide, and selectively interrogate, an updated hypothalamus structure-function network model to encourage future hypothesis-driven investigations of identified hypothalamic subsystems.

Keywords: hypothalamus; mammal; neuroinformatics; neurome; neuronal connections.


Conflict of interest statement

Conflict of interest statement: L.W.S. and C.B.S. were coauthors of a 2016 Commentary.

Figures

Fig. 1.
Fig. 1.
Empirical models advance understanding. (A) Interrelated statements by Richard Feynman conveying how knowledge-based modeling can advance scientific understanding. (B) The X-ray diffraction pattern of DNA obtained by Rosalind Franklin (B) was instrumental for determining the double helical structure of DNA by James Watson and Francis Crick (C), enabling genome determination. (D) Visualized injection site of the anterograde neuronal pathway tracer Phaseolus vulgaris-leucoagglutinin in the rat hypothalamus. fx, fornix; V3h, third ventricle, hypothalamic part. (Scale bar: 250 µm.) (E) Data obtained from pathway-tracing experiments can be used to construct a network model for the complete nervous system that describes connections between all parts of the nervous system and between the nervous system and the rest of the body—a neurome (7); genome structure is a fundamental determinant of neurome structure (dashed arrow). (A) Image courtesy of the Archives, California Institute of Technology. (B) Reproduced by permission from ref. , Springer Nature: Nature, copyright (1953). (C) Reproduced by permission from ref. , Springer Nature: Nature, copyright (1953). (D) Reproduced from ref. .
Fig. 2.
Fig. 2.
(A and B, Top) Connection and coclassification network matrices for the bilateral intrahypothalamic subconnectome (HY2). (Bottom) Arrangement of hypothalamus regions for each quadrant in A and B. (A) Directed and weighted monosynaptic macroconnection matrix for the rat hypothalamus, with gray matter region sequence in a subsystem arrangement derived from MRCC analysis (shown in B). Connection weights are represented by descriptive values (Upper half, color key shown Below), and on a log10 scale (Lower half, scale shown at right edge); sides 1 and 2 are indicated by green and black bars, respectively. Two bilateral top-level subsystems (M1 and M2) are outlined in red; two second-level subsystems are delineated by a white cross (shown only for M2 for clarity but applies to both M1 and M2). (B) Complete coclassification matrix obtained from MRCC (as in A) for the 130 regions (65 per side) of the hypothalamus. A linearly scaled coclassification index (shown Below) gives a range between 0 (no coclassification at any resolution) and 1 (perfect coclassification across all resolutions). Ordering and hierarchical arrangement are determined after building a hierarchy (Right) of nested solutions that recursively partition each cluster (i.e., subsystem), starting with the two top-level subsystems. The 30 subsystems obtained for the finest partition are indicated on the left edge of the dendrogram, while the two identical top-level subsystems (corresponding to M1 and M2) appear at the root of the tree (far right edge). A total of 21 distinct hierarchical levels are present, as determined by the sum of vertical cuts through each unique set of branches. The length of each distinct set of branches represents a distance between adjacent solutions in the hierarchical tree that may be interpreted as its persistence along the entire spectrum; dominant solutions extend longer branches, while fleeting or unstable solutions extend shorter branches. All solutions plotted in the tree survive the statistical significance level of α = 0.05. Abbreviations are defined in Dataset S2.
Fig. 3.
Fig. 3.
Comparison of bilateral (HY2) and unilateral (HY1) intrahypothalamic subsystems. (Top) Organization of within and between-sides (bilateral) top-level and second-level subsystems (HY2, Lower half of flatmap), and within-side (unilateral) top-level subsystems (HY1, Upper half of flatmap), for the hypothalamus macroscale subconnectome. To facilitate comparison, each bilaterally mirrored dataset is represented on one side of a flatmap of the rat hypothalamus (17)—the hypothalamus (magenta delineated) and its spatial relation to the CNS is represented on the gray flatmap at Lower Left. Top-level subsystems (modules) (for HY1 and HY2) and second-level subsystems (for HY2) are color coded (key at Lower Right). For HY1, there are six modules (three per side, as shown); for HY2, there are two bilateral modules (one shown). Each HY2 module (pastel blue) has two second-level subsystems: mostly medial HY2 subsystem 1.1 (black delineated) includes all regions in HY1 module 1 (pastel pink); mostly lateral HY2 subsystem 1.2 (blue delineated) includes all regions in HY1 module 3 (pastel green). HY1 module 2 (pastel yellow) includes fewer regions than the other HY1 modules, and these separate into one or the other HY2 second-level subsystem. Abbreviations are defined in Dataset S2.
Fig. 4.
Fig. 4.
Central nodes of the intrahypothalamic network. Identification of candidate hub regions (and others with high network centrality) for the bilateral (HY2) and unilateral (HY1) hypothalamic subconnectomes. Regions are assigned a score of 0 to 4 according to the number of times they fall within the top 20th percentile for each of four measures of centrality (degree, strength, betweenness, and closeness) and are arranged from left to right by HY1 descending aggregate centrality and topographically (17). Regions with a centrality score of 4 are considered candidate hubs. For individual-region centrality values for each measure of centrality (for HY2), see SI Appendix, Fig. S3. Note that aggregate centrality scores are modulated between HY1 and HY2, indicative of the relevance of HY2 contralateral connections to the overall structure of the network. Abbreviations are defined in Dataset S2.
Fig. 5.
Fig. 5.
Comparison of intrahypothalamic network centrality with GAD65 and VGLUT2 mRNA expression. (A, Lower half of flatmap) Regional distribution of aggregate centrality measures for the bilateral hypothalamus macroscale subconnectome (HY2) (color key shown Below Right). (A, Upper half of flatmap) mRNA expression levels of GAD65 and VGLUT2 (color key shown Below Middle). For comparison, each bilateral dataset is represented on one side of a rat hypothalamus flatmap. The hypothalamus (magenta) and its spatial relation to the CNS is represented on the gray flatmap at Lower Left. A five-point index is used for both centrality and mRNA expression levels: for centrality, regions are assigned a score of 0 to 4 according to the number of times they fall within the top 20th percentile for each of four measures of centrality (degree, strength, betweenness, and closeness); for gene expression, regions are assigned a score of 1 to 4 according to binned data for their average expression levels ranging from 0 to 7 (1, 0 to 1.75; 2, >1.75 to 3.5; 3, >3.5 to 5.25; and 4, >5.25 to 7). Flatmap coloration for aggregate centrality follows the corresponding color scale (candidate hubs have a score of 4 and are bright red). Flatmap coloration for mRNA expression indicates region predominance (GAD65/purple, VGLUT2/green) and expression level (1 to 4); regions with equal expression levels of both genes are blue (these regions had a binned score of 2); regions outlined in white express either GAD65 or VGLUT2. (B) Representative darkfield photomicrographs of mRNA expression for GAD65 (Left) and VGLUT2 (Middle) at a midrostrocaudal level of the VMH nucleus (shown in corresponding Nissl-stained section image, Right). Note the inverse relationship between GAD65 and VGLUT in the VMH and ARH. (Scale bars: 500 µm.) ME, median eminence; V3, third ventricle. Abbreviations for the hypothalamus flatmap are defined in Dataset S2 and those for the gray flatmap are defined in Fig. 3. Maps adapted from ref. .
Fig. 6.
Fig. 6.
Comparison of current (network) and previous (cell group-based) models of hypothalamic organization. An established cell group-based model of hypothalamic organization (Lower half of flatmap) divides it into four transverse levels (preoptic, anterior/supraoptic, tuberal, mammillary) and three longitudinal zones (periventricular, medial, lateral). Refinements to this model include the identification of a neuroendocrine motor zone (gray), medial zone nuclei (red) considered to form the rostral end of a behavior control column, and a periventricular region (pink) containing a putative visceromotor network (green), leaving the remaining lateral zone (yellow) (11, 35). The Upper half of the flatmap shows the two top-level partitions of the bilateral hypothalamus macroscale subconnectome (HY2). For comparison, each organization schema is presented on a single side. Most HY2 subsystem 1.1 regions (lighter blue) are in the periventricular zone and include all regions of the neuroendocrine motor zone and a putative visceromotor network, whereas most HY2 subsystem 1.2 regions (darker blue) are in the lateral and medial zones. The hypothalamus (magenta) and its spatial relation to the CNS is represented on the gray flatmap at Lower Left.
Fig. 7.
Fig. 7.
Hypothalamus structure–function network model. Network structures emerging from MRCC analysis of the bilateral (HY2) and unilateral (HY1) hypothalamus macroscale subconnectomes (colored dendrograms) are compared with one another and with an earlier model of hypothalamic cell group and network organization (11, 35). Colored lines connecting regions for HY1 and HY2 show correspondence between subsystem assignment determined by MRCC. Two-thirds of HY2 M1/2 subsystem 1.1 regions are in the periventricular zone, which includes the periventricular region (pink); included in this partition are all regions of a putative hypothalamic visceromotor pattern generator network (green), all regions of the neuroendocrine motor zone (gray), and both hypothalamic circumventricular organs [organum vasculosum of the lamina terminalis (OV) and subfornical organ (SFO)]; in contrast, four-fifths of HY2 M1/2 subsystem 1.2 regions are in the medial (dark red) and lateral (light yellow) hypothalamic zones. Overall, this organization suggests a prominent functional association for HY2 M1/2 subsystem 1.1 with physiological control (especially neuroendocrine signaling), and for subsystem 1.2 with behavioral control (especially somatomotor signaling). Moreover, primacy of physiological control is suggested by inclusion of all four candidate hubs in HY2 M1/2 subsystem 1.1 (white asterisks). However, both HY2 top-level subsystems 1.1 and 1.2 include regions involved in autonomic and behavioral-state control, and the existence of only two bilateral HY2 top-level modules underscores deep intrahypothalamic integration. Communication between HY2 M1/2 subsystems 1.1 and 1.2 may be considered mutually supportive, and both support the prime function of the hypothalamus to support survival and sexual reproduction. Abbreviations are defined in Dataset S2.

References

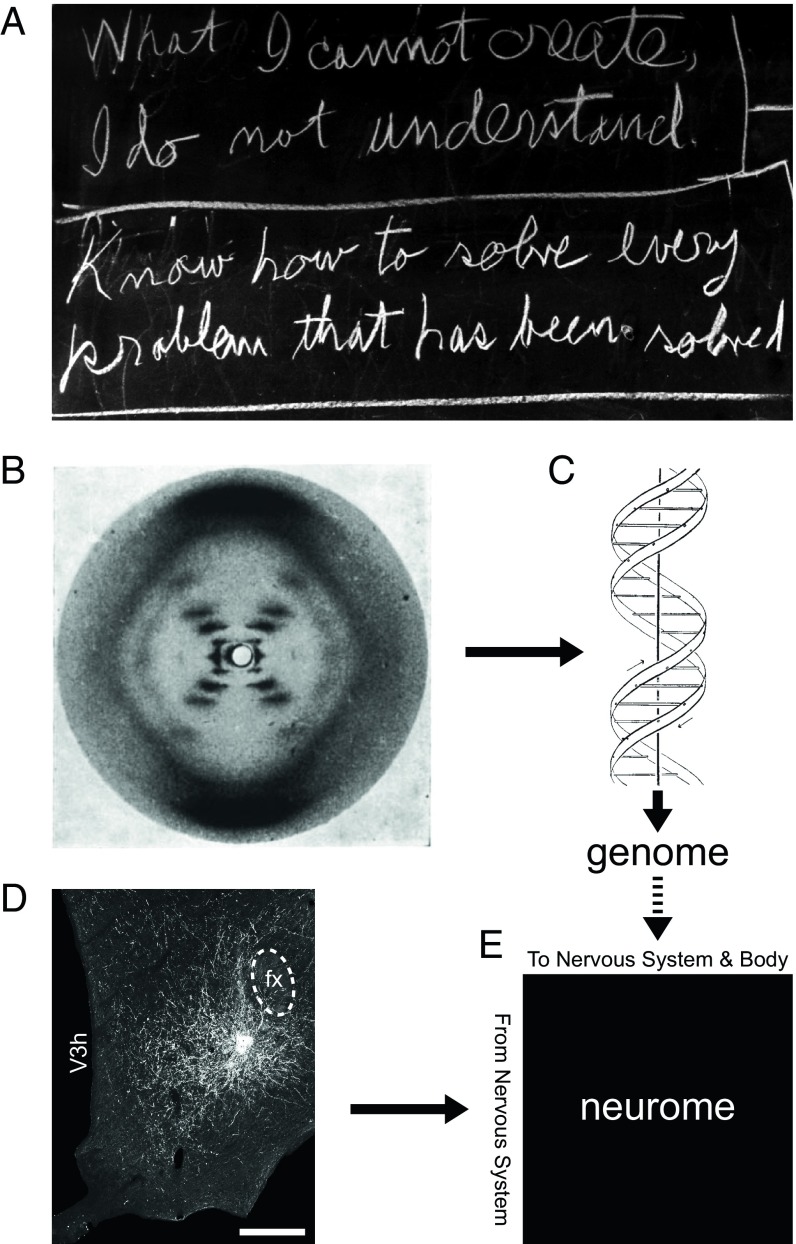
    1. Feynman RP, Phillips R, Gates B, Leighton R, Hutchings E. “Surely You’re Joking, Mr. Feynman!”: Adventures of a Curious Character. Reissue Ed W. W. Norton & Company; New York: 2018.
    1. Watson JD, Crick FH. Molecular structure of nucleic acids; a structure for deoxyribose nucleic acid. Nature. 1953;171:737–738. - PubMed
    1. Franklin RE, Gosling RG. Molecular configuration in sodium thymonucleate. Nature. 1953;171:740–741. - PubMed
    1. Bota M, Dong HW, Swanson LW. From gene networks to brain networks. Nat Neurosci. 2003;6:795–799. - PubMed
    1. Sporns O, Tononi G, Kötter R. The human connectome: A structural description of the human brain. PLoS Comput Biol. 2005;1:e42. - PMC - PubMed

Publication types

LinkOut - more resources